Schematic overview of the cellular and molecular mechanisms involved in the cancer progression, including the proposed cellular and molecular mechanisms in cancer cells trajectory. AT1: alveolar type 1 cells; AT2: alveolar type 2 cells; AAH: atypical adenomatous hyperplasia; AIS: adenocarcinoma in situ; MIA: minimally invasive adenocarcinoma; IA: invasive adenocarcinoma; EMT: epithelial-mesenchymal transition

Home

Download

Statistics

Help

Contact

Center for Computational Systems Medicine
leaf

Gene summary

leaf

Malignant transformation analysis

leaf

Malignant transformation related pathway analysis

leaf

Cell-cell communication analysis

leaf

Single-cell gene regulatory network inference analysis

leaf

Somatic mutation of malignant transformation related genes

leaf

Related drugs of malignant transformation related genes

Gene: ELF4

Gene summary for ELF4

check button Gene summary.

Gene informationSpeciesHuman
Gene symbol

ELF4

Gene ID

2000

Gene nameE74 like ETS transcription factor 4
Gene AliasELFR
CytomapXq26.1
Gene Typeprotein-coding
GO ID

GO:0001775

UniProtAcc

Q99607


Top

Malignant transformation analysis

check button Identification of the aberrant gene expression in precancerous and cancerous lesions by comparing the gene expression of stem-like cells in diseased tissues with normal stem cells
check button Malignant transformation involving gene list.
Entrez IDSymbolReplicatesSpeciesOrganTissueAdj P-valueLog2FCMalignancy
2000ELF4HTA11_2487_2000001011HumanColorectumSER1.44e-022.75e-01-0.1808
2000ELF4HTA11_1938_2000001011HumanColorectumAD2.41e-032.69e-01-0.0811
2000ELF4HTA11_347_2000001011HumanColorectumAD2.57e-073.66e-01-0.1954
2000ELF4HTA11_411_2000001011HumanColorectumSER7.47e-047.66e-01-0.2602
2000ELF4HTA11_696_2000001011HumanColorectumAD8.79e-103.70e-01-0.1464
2000ELF4HTA11_5212_2000001011HumanColorectumAD6.14e-034.20e-01-0.2061
2000ELF4HTA11_99999974143_84620HumanColorectumMSS4.34e-032.80e-010.3005
2000ELF4LZE24THumanEsophagusESCC1.02e-041.46e-010.0596
2000ELF4P1T-EHumanEsophagusESCC1.37e-021.19e-010.0875
2000ELF4P5T-EHumanEsophagusESCC1.13e-062.10e-020.1327
2000ELF4P8T-EHumanEsophagusESCC4.50e-091.05e-010.0889
2000ELF4P9T-EHumanEsophagusESCC5.47e-031.16e-010.1131
2000ELF4P10T-EHumanEsophagusESCC4.34e-081.90e-010.116
2000ELF4P12T-EHumanEsophagusESCC7.71e-076.64e-020.1122
2000ELF4P15T-EHumanEsophagusESCC2.79e-067.46e-020.1149
2000ELF4P17T-EHumanEsophagusESCC1.24e-032.19e-010.1278
2000ELF4P20T-EHumanEsophagusESCC4.34e-061.84e-010.1124
2000ELF4P21T-EHumanEsophagusESCC1.20e-082.56e-010.1617
2000ELF4P22T-EHumanEsophagusESCC2.45e-112.18e-010.1236
2000ELF4P23T-EHumanEsophagusESCC1.93e-083.16e-010.108
Page: 1 2 3 4 

check button Transcriptomic changes along malignancy continuum.
TissueExpression DynamicsAbbreviation
Colorectum (GSE201348)The image shows the transcriptomic changes along malignancy continuum.log2FC in expression of this searched gene in stem-like cells from each diseased tissue sample relative to stem-like cells in normal samples in each tissue plotted against the malignancy continuum. Samples are colored based on if they are from different disease stage.
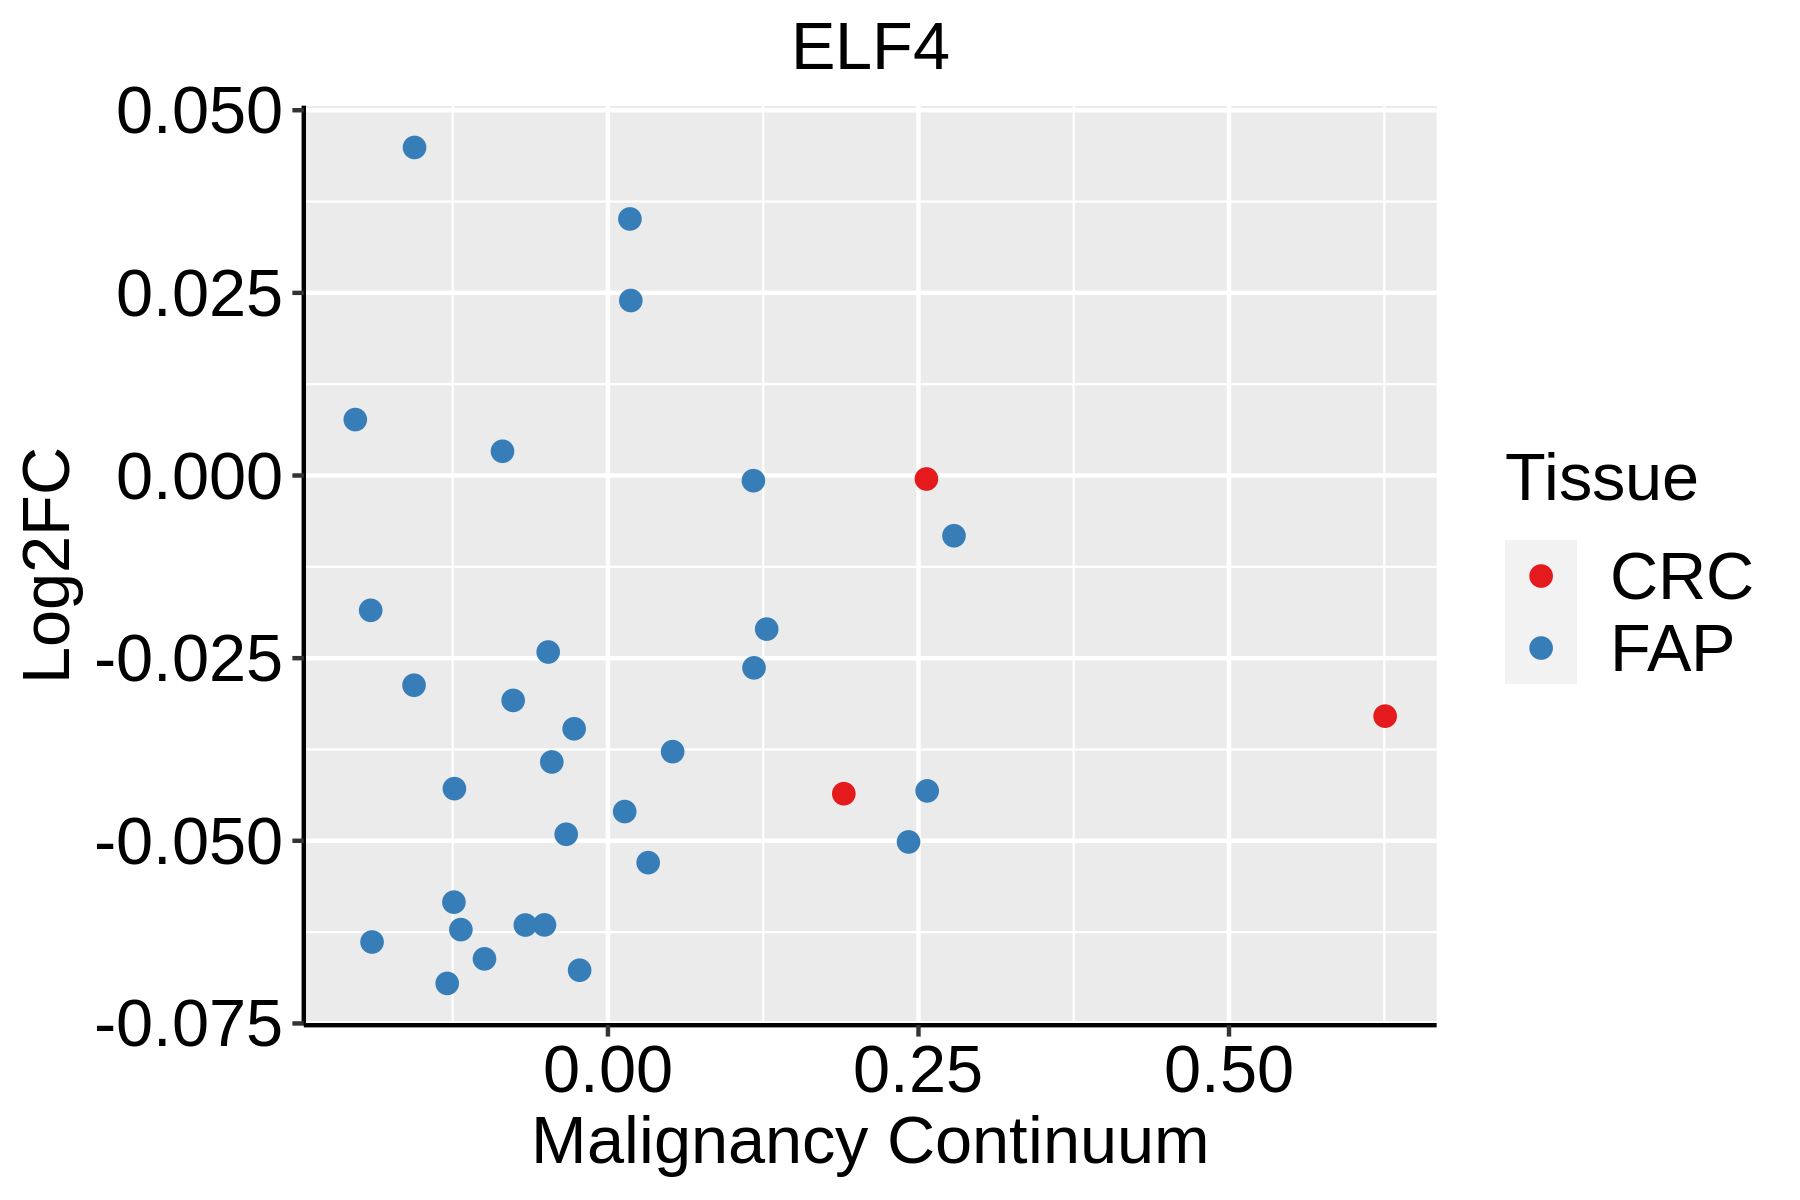
FAP: Familial adenomatous polyposis
CRC: Colorectal cancer
Colorectum (HTA11)The image shows the transcriptomic changes along malignancy continuum.log2FC in expression of this searched gene in stem-like cells from each diseased tissue sample relative to stem-like cells in normal samples in each tissue plotted against the malignancy continuum. Samples are colored based on if they are from different disease stage.AD: Adenomas
SER: Sessile serrated lesions
MSI-H: Microsatellite-high colorectal cancer
MSS: Microsatellite stable colorectal cancer
EsophagusThe image shows the transcriptomic changes along malignancy continuum.log2FC in expression of this searched gene in stem-like cells from each diseased tissue sample relative to stem-like cells in normal samples in each tissue plotted against the malignancy continuum. Samples are colored based on if they are from different disease stage.
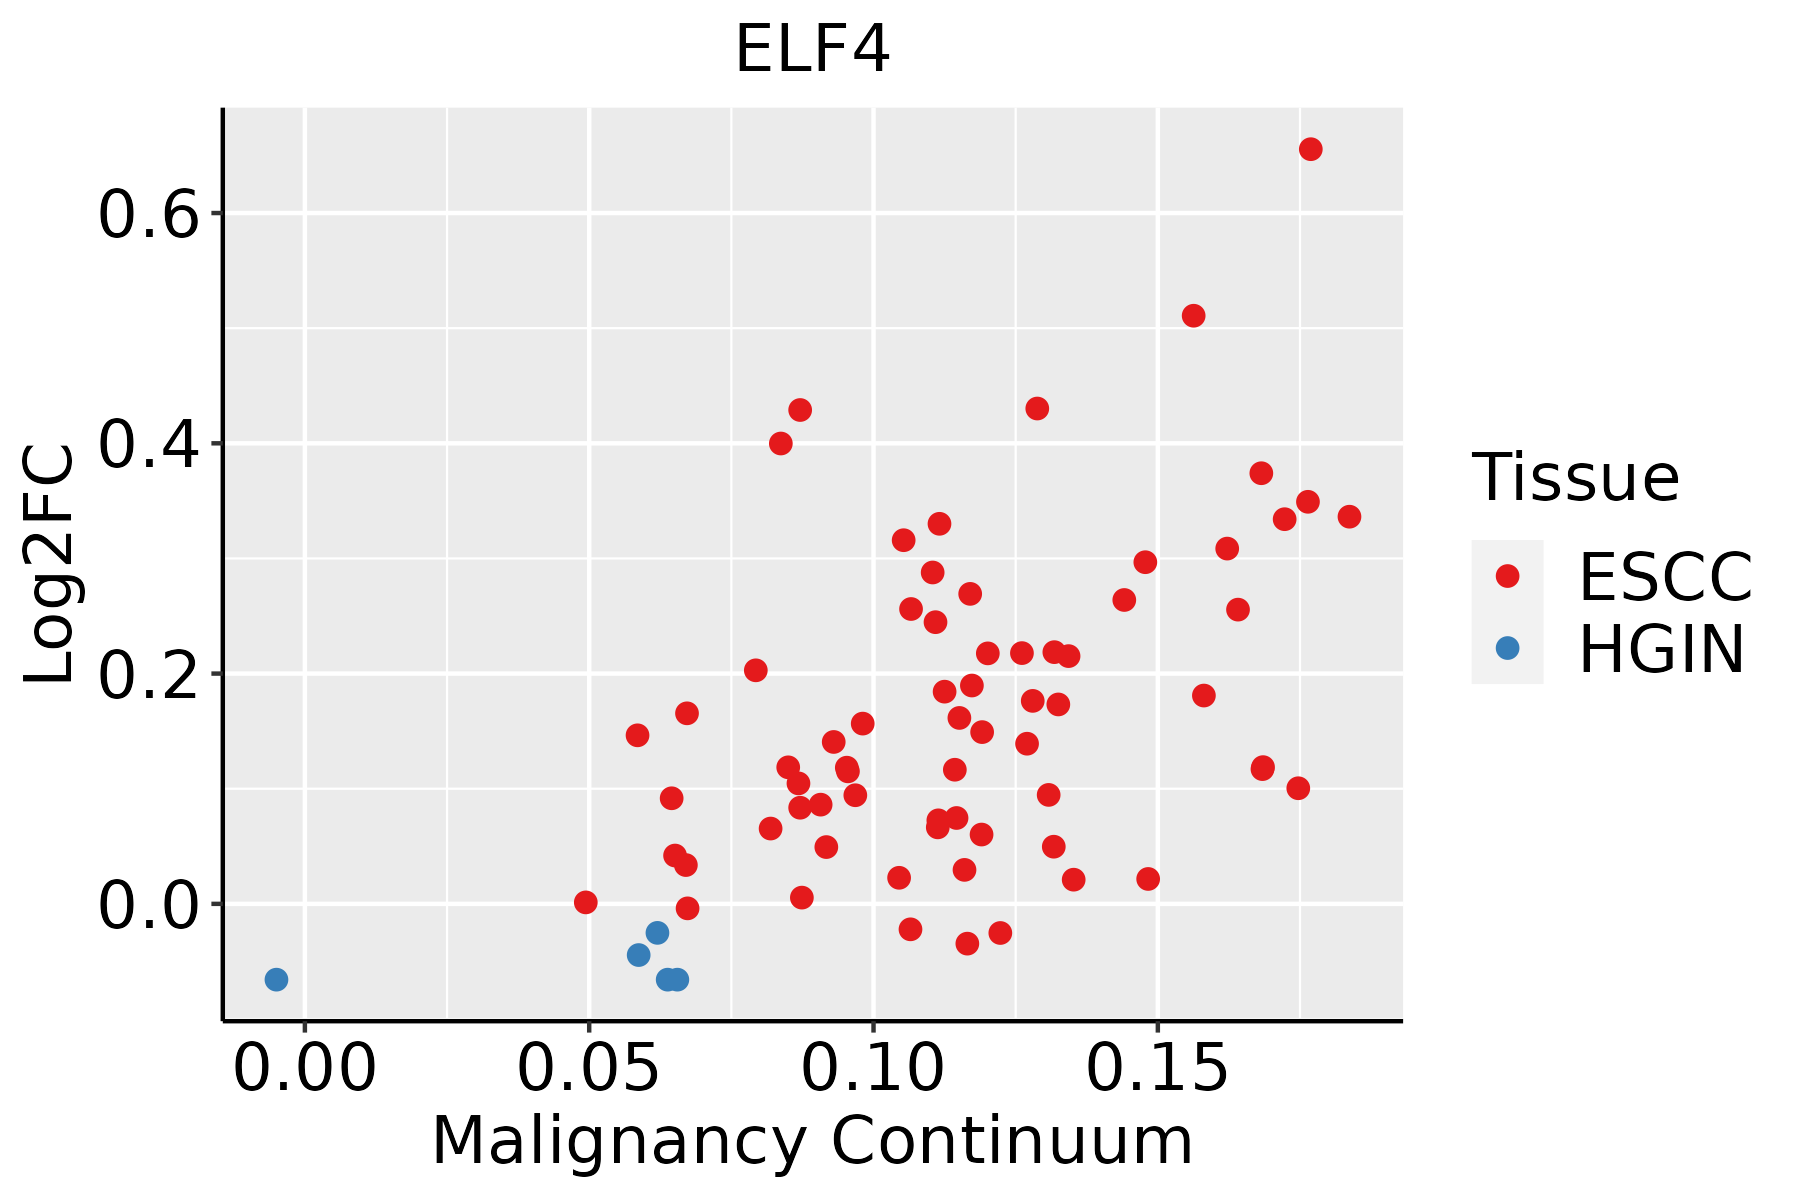
ESCC: Esophageal squamous cell carcinoma
HGIN: High-grade intraepithelial neoplasias
LGIN: Low-grade intraepithelial neoplasias
Oral CavityThe image shows the transcriptomic changes along malignancy continuum.log2FC in expression of this searched gene in stem-like cells from each diseased tissue sample relative to stem-like cells in normal samples in each tissue plotted against the malignancy continuum. Samples are colored based on if they are from different disease stage.EOLP: Erosive Oral lichen planus
LP: leukoplakia
NEOLP: Non-erosive oral lichen planus
OSCC: Oral squamous cell carcinoma
∗log2FC in expression of this searched gene in stem-like cells from each diseased tissue sample relative to stem-like cells in normal samples in each tissue plotted against the malignancy continuum. Samples are colored based on if they are from different disease stage.

Top

Malignant transformation related pathway analysis

check buttonFind out the enriched GO biological processes and KEGG pathways involved in transition from healthy to precancer to cancer
check button Figure of enriched GO biological processes.
TissueDisease StageEnriched GO biological Processes
ColorectumADGO analysis - Figure of enriched GO biological processes: Top 15 enriched GO BP terms are showed in the bar plot of each disease state in each tissue. Each row represents a significant GO biological process which is colored according to the -log10(p.adjust).
ColorectumSERGO analysis - Figure of enriched GO biological processes: Top 15 enriched GO BP terms are showed in the bar plot of each disease state in each tissue. Each row represents a significant GO biological process which is colored according to the -log10(p.adjust).
ColorectumMSSGO analysis - Figure of enriched GO biological processes: Top 15 enriched GO BP terms are showed in the bar plot of each disease state in each tissue. Each row represents a significant GO biological process which is colored according to the -log10(p.adjust).
ColorectumMSI-HGO analysis - Figure of enriched GO biological processes: Top 15 enriched GO BP terms are showed in the bar plot of each disease state in each tissue. Each row represents a significant GO biological process which is colored according to the -log10(p.adjust).
ColorectumFAPGO analysis - Figure of enriched GO biological processes: Top 15 enriched GO BP terms are showed in the bar plot of each disease state in each tissue. Each row represents a significant GO biological process which is colored according to the -log10(p.adjust).
∗Top 15 enriched GO BP terms are showed in the bar plot of each disease state in each tissue. Each row represents a significant GO biological process which is colored according to the -log10(p.adjust).
Page: 1 2 3 4 5 6 7 8 9 

check button Enriched GO biological processes.
GO IDTissueDisease StageDescriptionGene RatioBg Ratiopvaluep.adjustCount
GO:004211018EsophagusESCCT cell activation256/8552487/187231.18e-035.87e-03256
GO:004211016Oral cavityOSCCT cell activation245/7305487/187232.00e-073.22e-06245
GO:004209816Oral cavityOSCCT cell proliferation100/7305199/187237.93e-044.27e-03100
GO:00466333Oral cavityOSCCalpha-beta T cell proliferation24/730538/187232.21e-031.00e-0224
GO:00706618Oral cavityOSCCleukocyte proliferation145/7305318/187239.31e-033.33e-02145
GO:00466517Oral cavityOSCClymphocyte proliferation131/7305288/187231.41e-024.67e-02131
GO:0022613113ThyroidPTCribonucleoprotein complex biogenesis292/5968463/187233.24e-442.05e-40292
GO:0008380113ThyroidPTCRNA splicing273/5968434/187234.44e-411.40e-37273
GO:0000375113ThyroidPTCRNA splicing, via transesterification reactions202/5968324/187236.81e-303.91e-27202
GO:0000377113ThyroidPTCRNA splicing, via transesterification reactions with bulged adenosine as nucleophile199/5968320/187232.96e-291.44e-26199
GO:0000398113ThyroidPTCmRNA splicing, via spliceosome199/5968320/187232.96e-291.44e-26199
GO:1903311112ThyroidPTCregulation of mRNA metabolic process181/5968288/187231.60e-275.94e-25181
GO:0050684112ThyroidPTCregulation of mRNA processing98/5968137/187231.53e-213.10e-1998
GO:0043484113ThyroidPTCregulation of RNA splicing102/5968148/187232.03e-203.21e-18102
GO:0071826113ThyroidPTCribonucleoprotein complex subunit organization134/5968227/187232.34e-172.24e-15134
GO:0006417113ThyroidPTCregulation of translation236/5968468/187232.70e-172.52e-15236
GO:0022618113ThyroidPTCribonucleoprotein complex assembly130/5968220/187236.25e-175.47e-15130
GO:0048024113ThyroidPTCregulation of mRNA splicing, via spliceosome71/5968101/187232.39e-151.71e-1371
GO:1903313110ThyroidPTCpositive regulation of mRNA metabolic process76/5968118/187233.60e-131.80e-1176
GO:0001701111ThyroidPTCin utero embryonic development175/5968367/187231.40e-104.73e-09175
Page: 1 2 

check button Enriched KEGG pathways.
Pathway IDTissueDisease StageDescriptionGene RatioBg Ratiopvaluep.adjustqvalueCount
Page: 1 

Top

Cell-cell communication analysis

check buttonIdentification of potential cell-cell interactions between two cell types and their ligand-receptor pairs for different disease states
LigandReceptorLRpairPathwayTissueDisease Stage
Page: 1 

Top

Single-cell gene regulatory network inference analysis

check buttonFind out the significant the regulons (TFs) and the target genes of each regulon across cell types for different disease states
TFCell TypeTissueDisease StageTarget GeneRSSRegulon Activity
ELF4IMENTColorectumADJGLI4,AC025159.1,LAMB3, etc.2.95e-01The dot plots of a searched regulon are shown for all cell subpopulations in each disease state of each tissue based on the regulon specific score inferred using pySCENIC and by calculating the average expression.
ELF4MSC.SECLiverNAFLDITGB2,LAIR1,SPI1, etc.5.42e-01The dot plots of a searched regulon are shown for all cell subpopulations in each disease state of each tissue based on the regulon specific score inferred using pySCENIC and by calculating the average expression.
ELF4NEUTLungADJCCDC26,AC024028.1,TMC4, etc.5.03e-03The dot plots of a searched regulon are shown for all cell subpopulations in each disease state of each tissue based on the regulon specific score inferred using pySCENIC and by calculating the average expression.
ELF4M2MACOral cavityLPSRGAP2C,TYW1B,NOTCH1, etc.2.33e-01The dot plots of a searched regulon are shown for all cell subpopulations in each disease state of each tissue based on the regulon specific score inferred using pySCENIC and by calculating the average expression.
ELF4BASSkincSCCANKRD33B,AADACL2-AS1,FNDC3B, etc.1.23e-01The dot plots of a searched regulon are shown for all cell subpopulations in each disease state of each tissue based on the regulon specific score inferred using pySCENIC and by calculating the average expression.
ELF4PMCStomachADJVIM,FAM134A,THRB, etc.3.53e-01The dot plots of a searched regulon are shown for all cell subpopulations in each disease state of each tissue based on the regulon specific score inferred using pySCENIC and by calculating the average expression.
ELF4PMCStomachCSGVIM,FAM134A,THRB, etc.4.96e-01The dot plots of a searched regulon are shown for all cell subpopulations in each disease state of each tissue based on the regulon specific score inferred using pySCENIC and by calculating the average expression.
ELF4PMCStomachGCVIM,FAM134A,THRB, etc.3.77e-01The dot plots of a searched regulon are shown for all cell subpopulations in each disease state of each tissue based on the regulon specific score inferred using pySCENIC and by calculating the average expression.
ELF4PMCStomachSIMVIM,FAM134A,THRB, etc.4.40e-01The dot plots of a searched regulon are shown for all cell subpopulations in each disease state of each tissue based on the regulon specific score inferred using pySCENIC and by calculating the average expression.
∗The dot plots of a searched regulon are shown for all cell subpopulations in each disease state of each tissue based on the regulon specific score inferred using pySCENIC and by calculating the average expression.
Page: 1 

Top

Somatic mutation of malignant transformation related genes

check buttonAnnotation of somatic variants for genes involved in malignant transformation
Hugo SymbolVariant ClassVariant ClassificationdbSNP RSHGVScHGVSpHGVSp ShortSWISSPROTBIOTYPESIFTPolyPhenTumor Sample BarcodeTissueHistologySexAgeStageTherapy TypesDrugsOutcome
ELF4SNVMissense_Mutationc.1447N>Gp.Leu483Valp.L483VQ99607protein_codingtolerated(0.3)possibly_damaging(0.679)TCGA-AC-A23H-01Breastbreast invasive carcinomaFemale>=65I/IIUnknownUnknownPD
ELF4SNVMissense_Mutationnovelc.1705C>Tp.Leu569Phep.L569FQ99607protein_codingdeleterious(0.02)possibly_damaging(0.879)TCGA-AN-A046-01Breastbreast invasive carcinomaFemale>=65I/IIUnknownUnknownSD
ELF4SNVMissense_Mutationrs776215676c.922G>Ap.Glu308Lysp.E308KQ99607protein_codingtolerated(0.07)possibly_damaging(0.642)TCGA-AN-A046-01Breastbreast invasive carcinomaFemale>=65I/IIUnknownUnknownSD
ELF4SNVMissense_Mutationc.1517G>Ap.Gly506Glup.G506EQ99607protein_codingtolerated(0.48)benign(0.18)TCGA-AR-A24X-01Breastbreast invasive carcinomaFemale<65I/IIHormone TherapytamoxiphenSD
ELF4SNVMissense_Mutationc.1015N>Tp.Ala339Serp.A339SQ99607protein_codingtolerated(0.68)benign(0.005)TCGA-C8-A1HI-01Breastbreast invasive carcinomaFemale<65III/IVUnknownUnknownSD
ELF4SNVMissense_Mutationc.1447C>Tp.Leu483Phep.L483FQ99607protein_codingtolerated(0.34)possibly_damaging(0.88)TCGA-GM-A2DL-01Breastbreast invasive carcinomaFemale<65I/IIHormone TherapytamoxiphenCR
ELF4insertionFrame_Shift_Insnovelc.52_53insAp.Gly18GlufsTer4p.G18Efs*4Q99607protein_codingTCGA-A8-A09D-01Breastbreast invasive carcinomaFemale<65I/IIChemotherapydoxorubicinCR
ELF4insertionIn_Frame_Insnovelc.1694_1695insGCGGAGTCGCAGTCAp.Thr565_Leu566insArgSerArgSerHisp.T565_L566insRSRSHQ99607protein_codingTCGA-AN-A03X-01Breastbreast invasive carcinomaFemale>=65I/IIUnknownUnknownSD
ELF4insertionFrame_Shift_Insnovelc.1692_1693insCCTCGCGGACCAGCAGGTGAGCp.Thr565ProfsTer57p.T565Pfs*57Q99607protein_codingTCGA-AN-A03X-01Breastbreast invasive carcinomaFemale>=65I/IIUnknownUnknownSD
ELF4insertionFrame_Shift_Insnovelc.317_318insGACTGGGAAATCAAAGAAGAGAAGTAAGTGGGGGAGAGTGp.Asp106GlufsTer18p.D106Efs*18Q99607protein_codingTCGA-B6-A0I9-01Breastbreast invasive carcinomaFemale<65III/IVUnknownUnknownPD
Page: 1 2 3 4 5 6 7 8 

Top

Related drugs of malignant transformation related genes

check buttonIdentification of chemicals and drugs interact with genes involved in malignant transfromation
(DGIdb 4.0)
Entrez IDSymbolCategoryInteraction TypesDrug Claim NameDrug NamePMIDs
Page: 1