
|
|||||
|
 | |
| |
| |
| |
| |
| |
|
Gene: ELF3 |
Gene summary for ELF3 |
| Gene information | Species | Human | Gene symbol | ELF3 | Gene ID | 1999 |
| Gene name | E74 like ETS transcription factor 3 | |
| Gene Alias | EPR-1 | |
| Cytomap | 1q32.1 | |
| Gene Type | protein-coding | GO ID | GO:0001701 | UniProtAcc | A0A024R974 |
Top |
Malignant transformation analysis |
| Identification of the aberrant gene expression in precancerous and cancerous lesions by comparing the gene expression of stem-like cells in diseased tissues with normal stem cells |
| Entrez ID | Symbol | Replicates | Species | Organ | Tissue | Adj P-value | Log2FC | Malignancy |
| 1999 | ELF3 | GSM4909281 | Human | Breast | IDC | 2.78e-05 | -3.36e-01 | 0.21 |
| 1999 | ELF3 | GSM4909282 | Human | Breast | IDC | 2.97e-05 | 2.69e-01 | -0.0288 |
| 1999 | ELF3 | GSM4909286 | Human | Breast | IDC | 1.26e-03 | 1.29e-01 | 0.1081 |
| 1999 | ELF3 | GSM4909288 | Human | Breast | IDC | 1.35e-05 | -6.26e-01 | 0.0988 |
| 1999 | ELF3 | GSM4909290 | Human | Breast | IDC | 3.82e-14 | -6.31e-01 | 0.2096 |
| 1999 | ELF3 | GSM4909294 | Human | Breast | IDC | 2.45e-15 | -5.26e-01 | 0.2022 |
| 1999 | ELF3 | GSM4909296 | Human | Breast | IDC | 1.08e-03 | -1.67e-01 | 0.1524 |
| 1999 | ELF3 | GSM4909297 | Human | Breast | IDC | 2.19e-09 | -2.48e-01 | 0.1517 |
| 1999 | ELF3 | GSM4909299 | Human | Breast | IDC | 3.80e-05 | 2.76e-01 | 0.035 |
| 1999 | ELF3 | GSM4909300 | Human | Breast | IDC | 4.72e-04 | 4.84e-01 | 0.0334 |
| 1999 | ELF3 | GSM4909301 | Human | Breast | IDC | 6.50e-24 | 4.77e-01 | 0.1577 |
| 1999 | ELF3 | GSM4909304 | Human | Breast | IDC | 6.89e-13 | -5.49e-01 | 0.1636 |
| 1999 | ELF3 | GSM4909306 | Human | Breast | IDC | 1.43e-13 | 4.44e-01 | 0.1564 |
| 1999 | ELF3 | GSM4909311 | Human | Breast | IDC | 4.11e-37 | -6.21e-01 | 0.1534 |
| 1999 | ELF3 | GSM4909312 | Human | Breast | IDC | 1.33e-03 | -2.43e-01 | 0.1552 |
| 1999 | ELF3 | GSM4909313 | Human | Breast | IDC | 1.18e-13 | 5.23e-01 | 0.0391 |
| 1999 | ELF3 | GSM4909315 | Human | Breast | IDC | 5.76e-26 | -7.68e-01 | 0.21 |
| 1999 | ELF3 | GSM4909316 | Human | Breast | IDC | 6.89e-13 | -8.66e-01 | 0.21 |
| 1999 | ELF3 | GSM4909319 | Human | Breast | IDC | 2.49e-45 | -6.45e-02 | 0.1563 |
| 1999 | ELF3 | GSM4909321 | Human | Breast | IDC | 1.26e-48 | 6.88e-01 | 0.1559 |
| Page: 1 2 3 4 5 6 7 8 9 10 11 12 13 14 15 |
| Tissue | Expression Dynamics | Abbreviation |
| Breast |  | IDC: Invasive ductal carcinoma |
| DCIS: Ductal carcinoma in situ | ||
| Precancer(BRCA1-mut): Precancerous lesion from BRCA1 mutation carriers | ||
| Cervix |  | CC: Cervix cancer |
| HSIL_HPV: HPV-infected high-grade squamous intraepithelial lesions | ||
| N_HPV: HPV-infected normal cervix | ||
| Colorectum (GSE201348) |  | FAP: Familial adenomatous polyposis |
| CRC: Colorectal cancer | ||
| Colorectum (HTA11) |  | AD: Adenomas |
| SER: Sessile serrated lesions | ||
| MSI-H: Microsatellite-high colorectal cancer | ||
| MSS: Microsatellite stable colorectal cancer | ||
| Endometrium |  | AEH: Atypical endometrial hyperplasia |
| EEC: Endometrioid Cancer | ||
| Esophagus |  | ESCC: Esophageal squamous cell carcinoma |
| HGIN: High-grade intraepithelial neoplasias | ||
| LGIN: Low-grade intraepithelial neoplasias | ||
| GC |  | CAG: Chronic atrophic gastritis |
| CAG with IM: Chronic atrophic gastritis with intestinal metaplasia | ||
| CSG: Chronic superficial gastritis | ||
| GC: Gastric cancer | ||
| SIM: Severe intestinal metaplasia | ||
| WIM: Wild intestinal metaplasia | ||
| Liver | 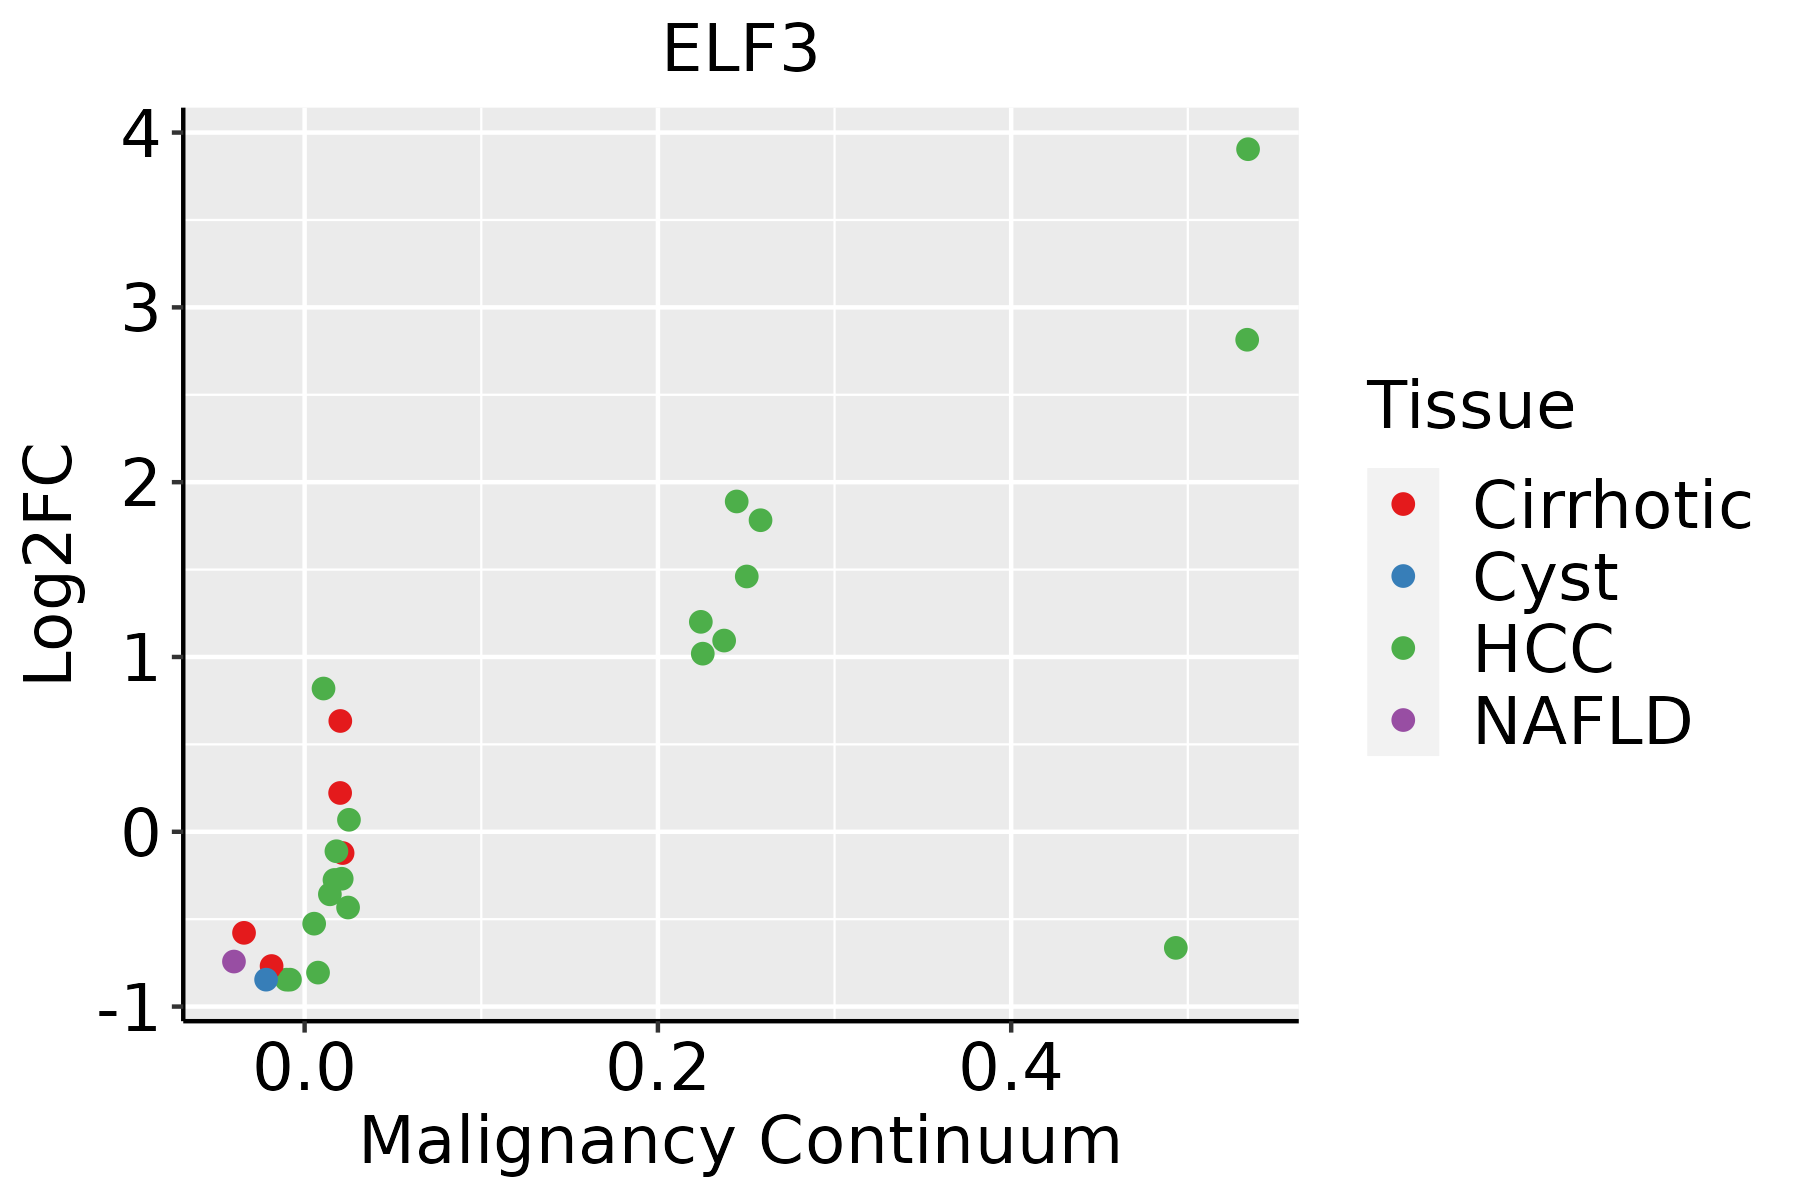 | HCC: Hepatocellular carcinoma |
| NAFLD: Non-alcoholic fatty liver disease | ||
| Lung | 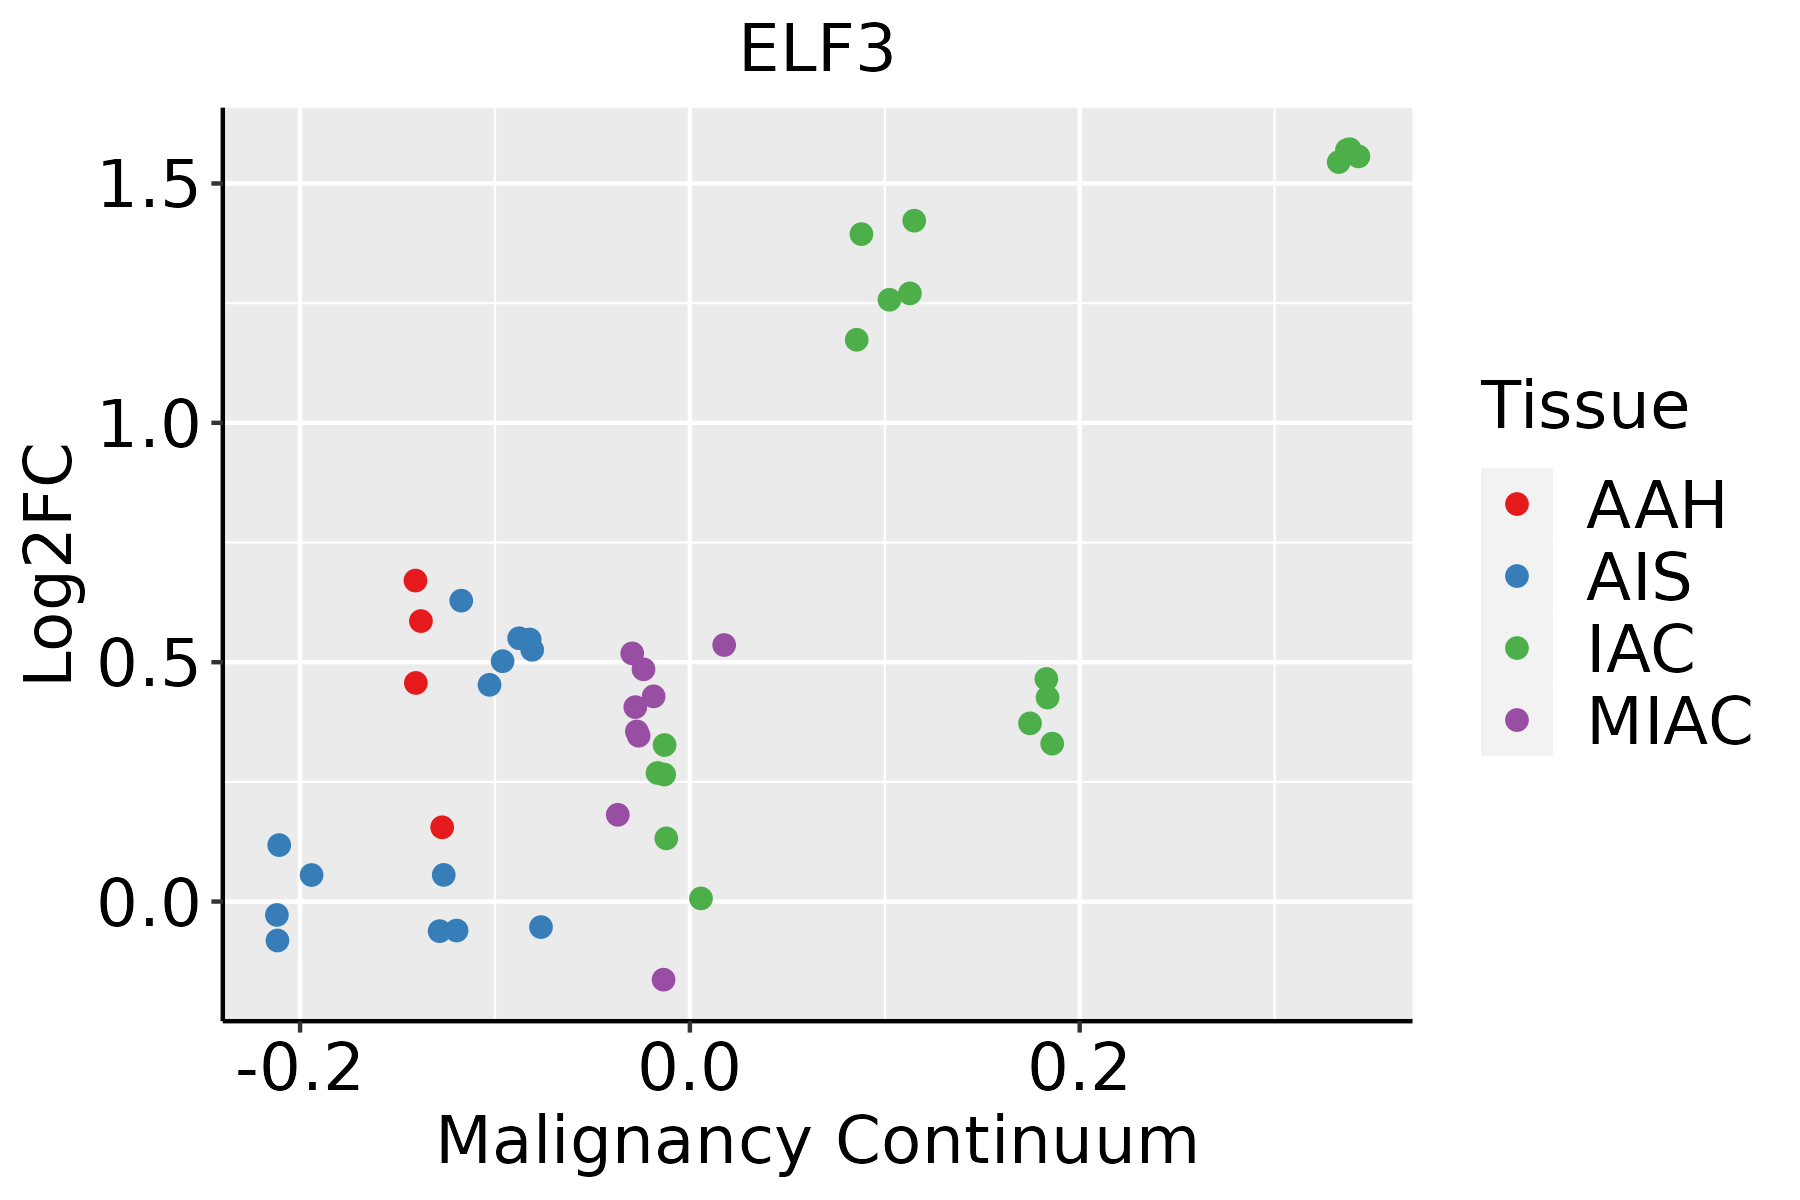 | AAH: Atypical adenomatous hyperplasia |
| AIS: Adenocarcinoma in situ | ||
| IAC: Invasive lung adenocarcinoma | ||
| MIA: Minimally invasive adenocarcinoma | ||
| Oral Cavity |  | EOLP: Erosive Oral lichen planus |
| LP: leukoplakia | ||
| NEOLP: Non-erosive oral lichen planus | ||
| OSCC: Oral squamous cell carcinoma | ||
| Prostate | 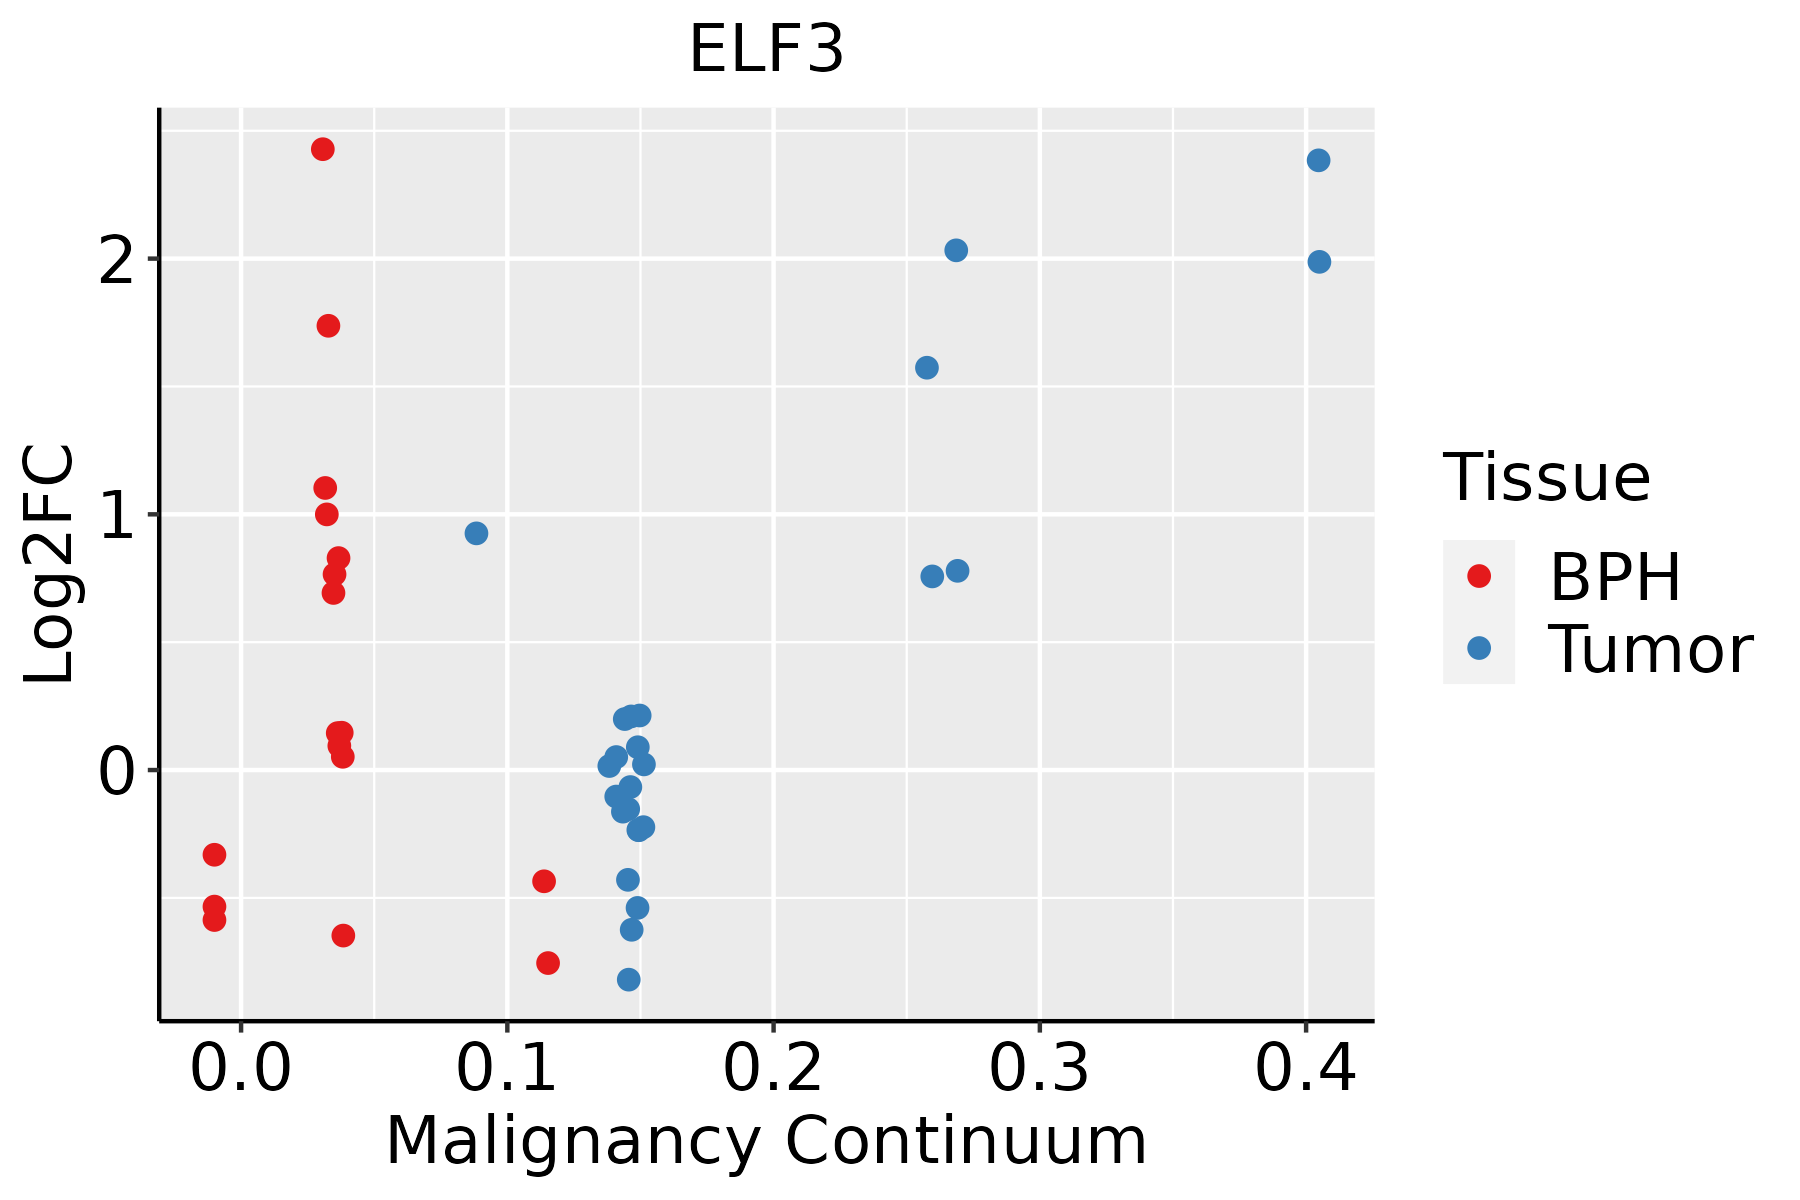 | BPH: Benign Prostatic Hyperplasia |
| Skin | 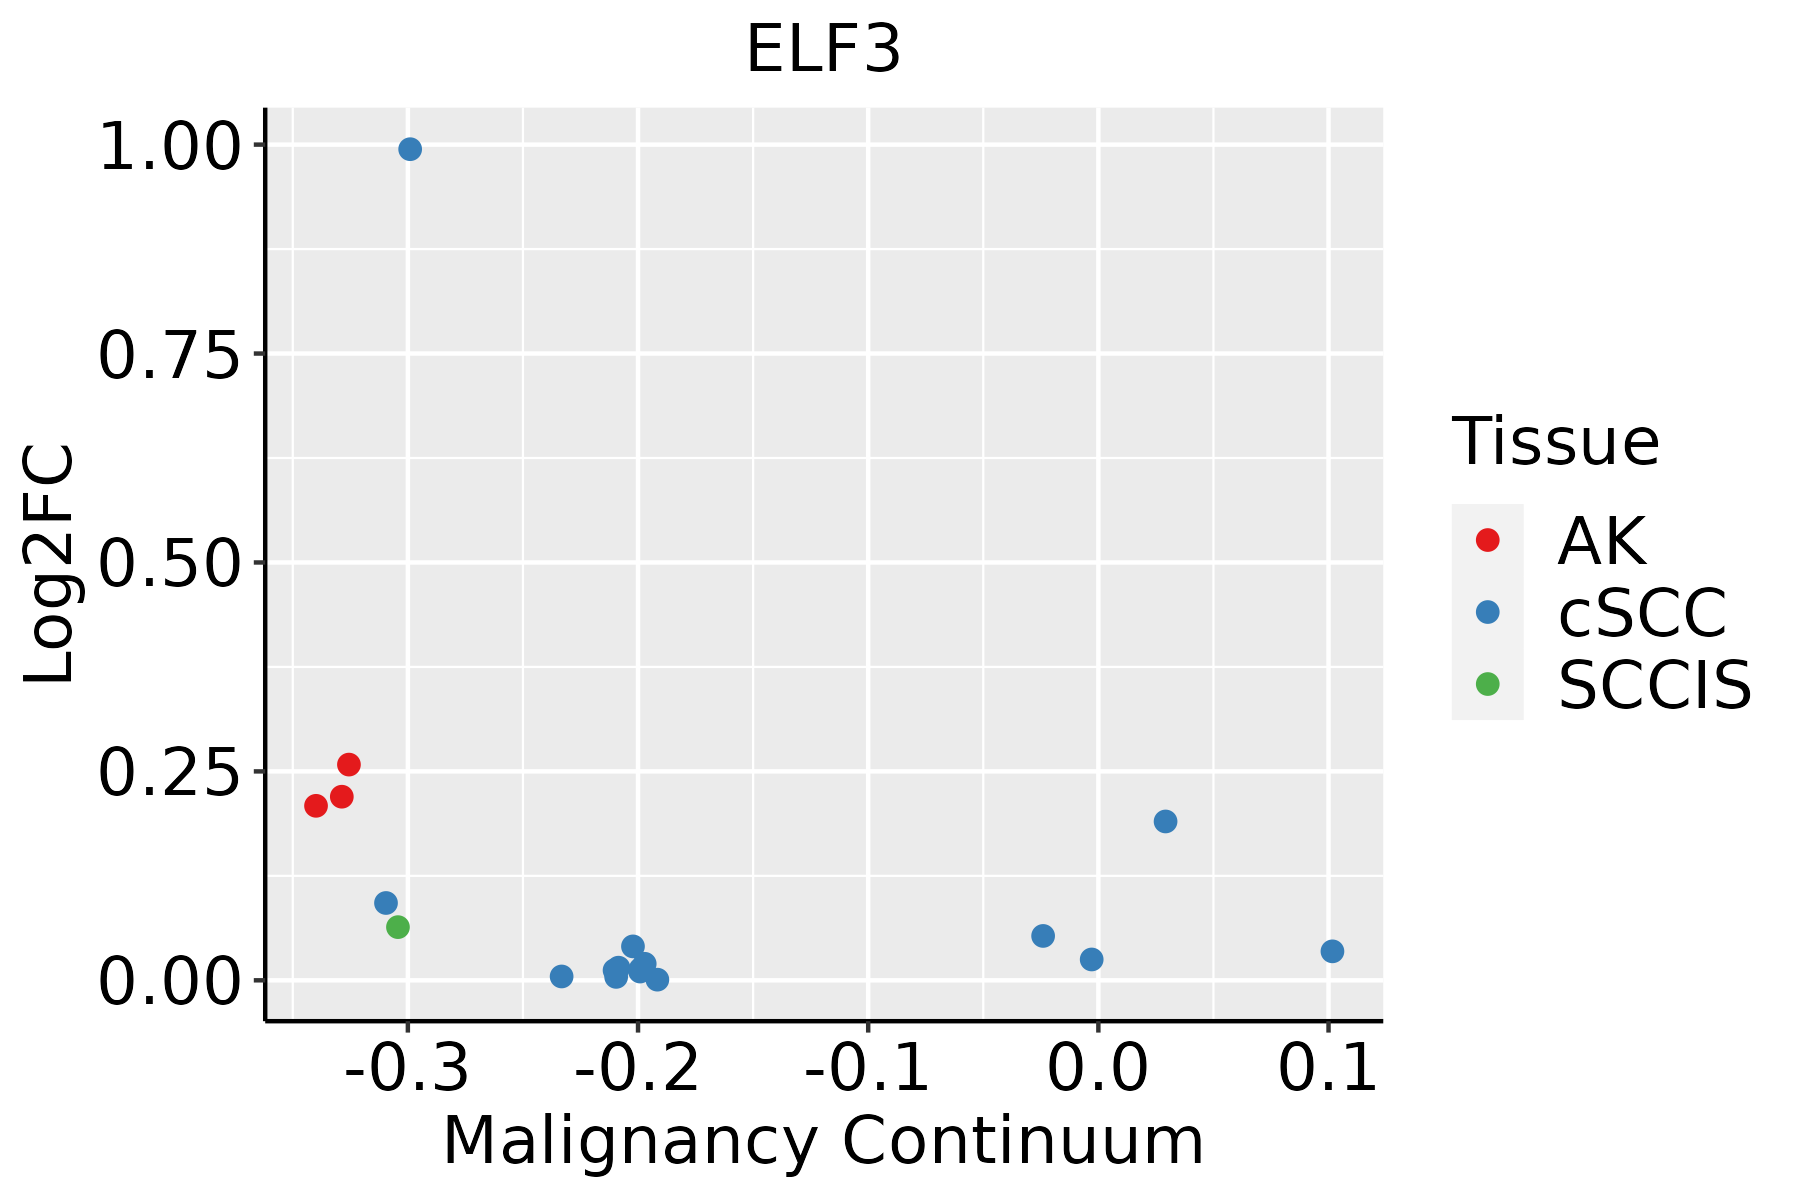 | AK: Actinic keratosis |
| cSCC: Cutaneous squamous cell carcinoma | ||
| SCCIS:squamous cell carcinoma in situ | ||
| Thyroid |  | ATC: Anaplastic thyroid cancer |
| HT: Hashimoto's thyroiditis | ||
| PTC: Papillary thyroid cancer |
| ∗log2FC in expression of this searched gene in stem-like cells from each diseased tissue sample relative to stem-like cells in normal samples in each tissue plotted against the malignancy continuum. Samples are colored based on if they are from different disease stage. |
Top |
Malignant transformation related pathway analysis |
| Find out the enriched GO biological processes and KEGG pathways involved in transition from healthy to precancer to cancer |
| Tissue | Disease Stage | Enriched GO biological Processes |
| Colorectum | AD |  |
| Colorectum | SER |  |
| Colorectum | MSS |  |
| Colorectum | MSI-H |  |
| Colorectum | FAP |  |
| ∗Top 15 enriched GO BP terms are showed in the bar plot of each disease state in each tissue. Each row represents a significant GO biological process which is colored according to the -log10(p.adjust). |
| Page: 1 2 3 4 5 6 7 8 9 |
| GO ID | Tissue | Disease Stage | Description | Gene Ratio | Bg Ratio | pvalue | p.adjust | Count |
| GO:00487329 | Breast | Precancer | gland development | 49/1080 | 436/18723 | 6.11e-06 | 1.73e-04 | 49 |
| GO:00017017 | Breast | Precancer | in utero embryonic development | 35/1080 | 367/18723 | 2.47e-03 | 2.27e-02 | 35 |
| GO:00308796 | Breast | Precancer | mammary gland development | 16/1080 | 137/18723 | 5.59e-03 | 4.07e-02 | 16 |
| GO:004873214 | Breast | IDC | gland development | 64/1434 | 436/18723 | 3.47e-07 | 1.74e-05 | 64 |
| GO:003087911 | Breast | IDC | mammary gland development | 23/1434 | 137/18723 | 2.87e-04 | 4.37e-03 | 23 |
| GO:00226127 | Breast | IDC | gland morphogenesis | 20/1434 | 118/18723 | 6.13e-04 | 7.69e-03 | 20 |
| GO:000170113 | Breast | IDC | in utero embryonic development | 42/1434 | 367/18723 | 5.85e-03 | 4.24e-02 | 42 |
| GO:004873223 | Breast | DCIS | gland development | 60/1390 | 436/18723 | 2.50e-06 | 8.74e-05 | 60 |
| GO:003087921 | Breast | DCIS | mammary gland development | 22/1390 | 137/18723 | 4.74e-04 | 6.24e-03 | 22 |
| GO:002261211 | Breast | DCIS | gland morphogenesis | 18/1390 | 118/18723 | 2.68e-03 | 2.36e-02 | 18 |
| GO:000170122 | Breast | DCIS | in utero embryonic development | 41/1390 | 367/18723 | 5.74e-03 | 4.13e-02 | 41 |
| GO:004873210 | Cervix | CC | gland development | 84/2311 | 436/18723 | 1.93e-05 | 3.54e-04 | 84 |
| GO:00017018 | Cervix | CC | in utero embryonic development | 71/2311 | 367/18723 | 7.21e-05 | 1.00e-03 | 71 |
| GO:00487712 | Cervix | CC | tissue remodeling | 34/2311 | 175/18723 | 4.68e-03 | 2.82e-02 | 34 |
| GO:00308797 | Cervix | CC | mammary gland development | 28/2311 | 137/18723 | 4.74e-03 | 2.83e-02 | 28 |
| GO:0030198 | Cervix | CC | extracellular matrix organization | 52/2311 | 301/18723 | 7.43e-03 | 3.98e-02 | 52 |
| GO:0043062 | Cervix | CC | extracellular structure organization | 52/2311 | 302/18723 | 7.92e-03 | 4.17e-02 | 52 |
| GO:0045229 | Cervix | CC | external encapsulating structure organization | 52/2311 | 304/18723 | 9.00e-03 | 4.57e-02 | 52 |
| GO:00226128 | Cervix | CC | gland morphogenesis | 24/2311 | 118/18723 | 9.01e-03 | 4.57e-02 | 24 |
| GO:004873215 | Cervix | N_HPV | gland development | 25/534 | 436/18723 | 7.93e-04 | 9.90e-03 | 25 |
| Page: 1 2 3 4 5 6 7 8 |
| Pathway ID | Tissue | Disease Stage | Description | Gene Ratio | Bg Ratio | pvalue | p.adjust | qvalue | Count |
| Page: 1 |
Top |
Cell-cell communication analysis |
| Identification of potential cell-cell interactions between two cell types and their ligand-receptor pairs for different disease states |
| Ligand | Receptor | LRpair | Pathway | Tissue | Disease Stage |
| Page: 1 |
Top |
Single-cell gene regulatory network inference analysis |
| Find out the significant the regulons (TFs) and the target genes of each regulon across cell types for different disease states |
| TF | Cell Type | Tissue | Disease Stage | Target Gene | RSS | Regulon Activity |
| ELF3 | MEGA | Liver | Healthy | FXYD2,LGALS4,AC090498.1, etc. | 3.80e-02 |  |
| ∗The dot plots of a searched regulon are shown for all cell subpopulations in each disease state of each tissue based on the regulon specific score inferred using pySCENIC and by calculating the average expression. |
| Page: 1 |
Top |
Somatic mutation of malignant transformation related genes |
| Annotation of somatic variants for genes involved in malignant transformation |
| Hugo Symbol | Variant Class | Variant Classification | dbSNP RS | HGVSc | HGVSp | HGVSp Short | SWISSPROT | BIOTYPE | SIFT | PolyPhen | Tumor Sample Barcode | Tissue | Histology | Sex | Age | Stage | Therapy Types | Drugs | Outcome |
| ELF3 | SNV | Missense_Mutation | c.22N>G | p.Ser8Gly | p.S8G | P78545 | protein_coding | tolerated(0.15) | benign(0.034) | TCGA-E2-A15R-01 | Breast | breast invasive carcinoma | Female | <65 | I/II | Chemotherapy | cyclophosphamide | SD | |
| ELF3 | SNV | Missense_Mutation | rs750329636 | c.281N>A | p.Arg94Gln | p.R94Q | P78545 | protein_coding | tolerated(0.31) | benign(0.013) | TCGA-C5-A1MH-01 | Cervix | cervical & endocervical cancer | Female | >=65 | III/IV | Chemotherapy | cisplatin | PD |
| ELF3 | SNV | Missense_Mutation | c.463G>A | p.Asp155Asn | p.D155N | P78545 | protein_coding | tolerated(0.14) | benign(0.244) | TCGA-C5-A3HE-01 | Cervix | cervical & endocervical cancer | Female | <65 | I/II | Unknown | Unknown | PD | |
| ELF3 | SNV | Missense_Mutation | c.752G>A | p.Arg251Gln | p.R251Q | P78545 | protein_coding | tolerated(0.06) | probably_damaging(0.994) | TCGA-C5-A3HE-01 | Cervix | cervical & endocervical cancer | Female | <65 | I/II | Unknown | Unknown | PD | |
| ELF3 | SNV | Missense_Mutation | rs745722163 | c.203N>T | p.Ser68Leu | p.S68L | P78545 | protein_coding | deleterious(0) | possibly_damaging(0.503) | TCGA-EK-A3GK-01 | Cervix | cervical & endocervical cancer | Female | <65 | I/II | Unknown | Unknown | SD |
| ELF3 | SNV | Missense_Mutation | c.1087N>A | p.Glu363Lys | p.E363K | P78545 | protein_coding | tolerated(0.17) | benign(0.306) | TCGA-IR-A3LA-01 | Cervix | cervical & endocervical cancer | Female | <65 | I/II | Chemotherapy | cisplatin | CR | |
| ELF3 | SNV | Missense_Mutation | c.198C>G | p.Phe66Leu | p.F66L | P78545 | protein_coding | tolerated(0.66) | benign(0) | TCGA-Q1-A73O-01 | Cervix | cervical & endocervical cancer | Female | <65 | I/II | Chemotherapy | cisplatin | CR | |
| ELF3 | SNV | Missense_Mutation | c.163N>A | p.Glu55Lys | p.E55K | P78545 | protein_coding | tolerated(0.25) | benign(0.197) | TCGA-4N-A93T-01 | Colorectum | colon adenocarcinoma | Male | >=65 | III/IV | Chemotherapy | xeloda | SD | |
| ELF3 | SNV | Missense_Mutation | novel | c.473N>G | p.Pro158Arg | p.P158R | P78545 | protein_coding | tolerated(0.07) | benign(0.157) | TCGA-AA-A01K-01 | Colorectum | colon adenocarcinoma | Female | >=65 | III/IV | Chemotherapy | folinic | CR |
| ELF3 | SNV | Missense_Mutation | novel | c.440G>T | p.Gly147Val | p.G147V | P78545 | protein_coding | tolerated(0.41) | benign(0.034) | TCGA-AZ-4315-01 | Colorectum | colon adenocarcinoma | Male | <65 | I/II | Unknown | Unknown | SD |
| Page: 1 2 3 4 5 6 |
Top |
Related drugs of malignant transformation related genes |
| Identification of chemicals and drugs interact with genes involved in malignant transfromation |
| (DGIdb 4.0) |
| Entrez ID | Symbol | Category | Interaction Types | Drug Claim Name | Drug Name | PMIDs |
| Page: 1 |

Copyright 2023-Present -The University of Texas Health Science Center at Houston |