
|
|||||
|
 | |
| |
| |
| |
| |
| |
|
Gene: ELF2 |
Gene summary for ELF2 |
| Gene information | Species | Human | Gene symbol | ELF2 | Gene ID | 1998 |
| Gene name | E74 like ETS transcription factor 2 | |
| Gene Alias | EU32 | |
| Cytomap | 4q31.1 | |
| Gene Type | protein-coding | GO ID | GO:0006139 | UniProtAcc | Q15723 |
Top |
Malignant transformation analysis |
| Identification of the aberrant gene expression in precancerous and cancerous lesions by comparing the gene expression of stem-like cells in diseased tissues with normal stem cells |
| Entrez ID | Symbol | Replicates | Species | Organ | Tissue | Adj P-value | Log2FC | Malignancy |
| 1998 | ELF2 | CA_HPV_3 | Human | Cervix | CC | 4.54e-02 | -3.67e-02 | 0.0414 |
| 1998 | ELF2 | CCI_1 | Human | Cervix | CC | 1.96e-10 | 1.36e+00 | 0.528 |
| 1998 | ELF2 | CCI_2 | Human | Cervix | CC | 5.36e-12 | 1.25e+00 | 0.5249 |
| 1998 | ELF2 | CCI_3 | Human | Cervix | CC | 7.47e-09 | 8.79e-01 | 0.516 |
| 1998 | ELF2 | HTA11_3410_2000001011 | Human | Colorectum | AD | 2.91e-03 | -3.17e-01 | 0.0155 |
| 1998 | ELF2 | HTA11_347_2000001011 | Human | Colorectum | AD | 1.87e-03 | 3.75e-01 | -0.1954 |
| 1998 | ELF2 | HTA11_8622_2000001021 | Human | Colorectum | SER | 2.46e-03 | -4.91e-01 | 0.0528 |
| 1998 | ELF2 | HTA11_99999973899_84307 | Human | Colorectum | MSS | 1.09e-02 | -3.85e-01 | 0.2585 |
| 1998 | ELF2 | HTA11_99999974143_84620 | Human | Colorectum | MSS | 2.06e-09 | -4.13e-01 | 0.3005 |
| 1998 | ELF2 | F007 | Human | Colorectum | FAP | 2.59e-02 | -2.51e-01 | 0.1176 |
| 1998 | ELF2 | A001-C-207 | Human | Colorectum | FAP | 2.13e-04 | -3.24e-01 | 0.1278 |
| 1998 | ELF2 | A015-C-203 | Human | Colorectum | FAP | 5.66e-25 | -3.83e-01 | -0.1294 |
| 1998 | ELF2 | A015-C-204 | Human | Colorectum | FAP | 4.74e-07 | -4.17e-01 | -0.0228 |
| 1998 | ELF2 | A014-C-040 | Human | Colorectum | FAP | 8.30e-06 | -5.89e-01 | -0.1184 |
| 1998 | ELF2 | A002-C-201 | Human | Colorectum | FAP | 7.79e-13 | -4.02e-01 | 0.0324 |
| 1998 | ELF2 | A001-C-119 | Human | Colorectum | FAP | 1.78e-06 | -3.34e-01 | -0.1557 |
| 1998 | ELF2 | A001-C-108 | Human | Colorectum | FAP | 6.60e-14 | -3.62e-01 | -0.0272 |
| 1998 | ELF2 | A002-C-205 | Human | Colorectum | FAP | 3.89e-25 | -4.91e-01 | -0.1236 |
| 1998 | ELF2 | A001-C-104 | Human | Colorectum | FAP | 6.58e-05 | -3.01e-01 | 0.0184 |
| 1998 | ELF2 | A015-C-005 | Human | Colorectum | FAP | 1.81e-04 | -3.17e-01 | -0.0336 |
| Page: 1 2 3 4 5 6 7 8 9 10 |
| Tissue | Expression Dynamics | Abbreviation |
| Cervix |  | CC: Cervix cancer |
| HSIL_HPV: HPV-infected high-grade squamous intraepithelial lesions | ||
| N_HPV: HPV-infected normal cervix | ||
| Colorectum (GSE201348) |  | FAP: Familial adenomatous polyposis |
| CRC: Colorectal cancer | ||
| Colorectum (HTA11) |  | AD: Adenomas |
| SER: Sessile serrated lesions | ||
| MSI-H: Microsatellite-high colorectal cancer | ||
| MSS: Microsatellite stable colorectal cancer | ||
| Endometrium | 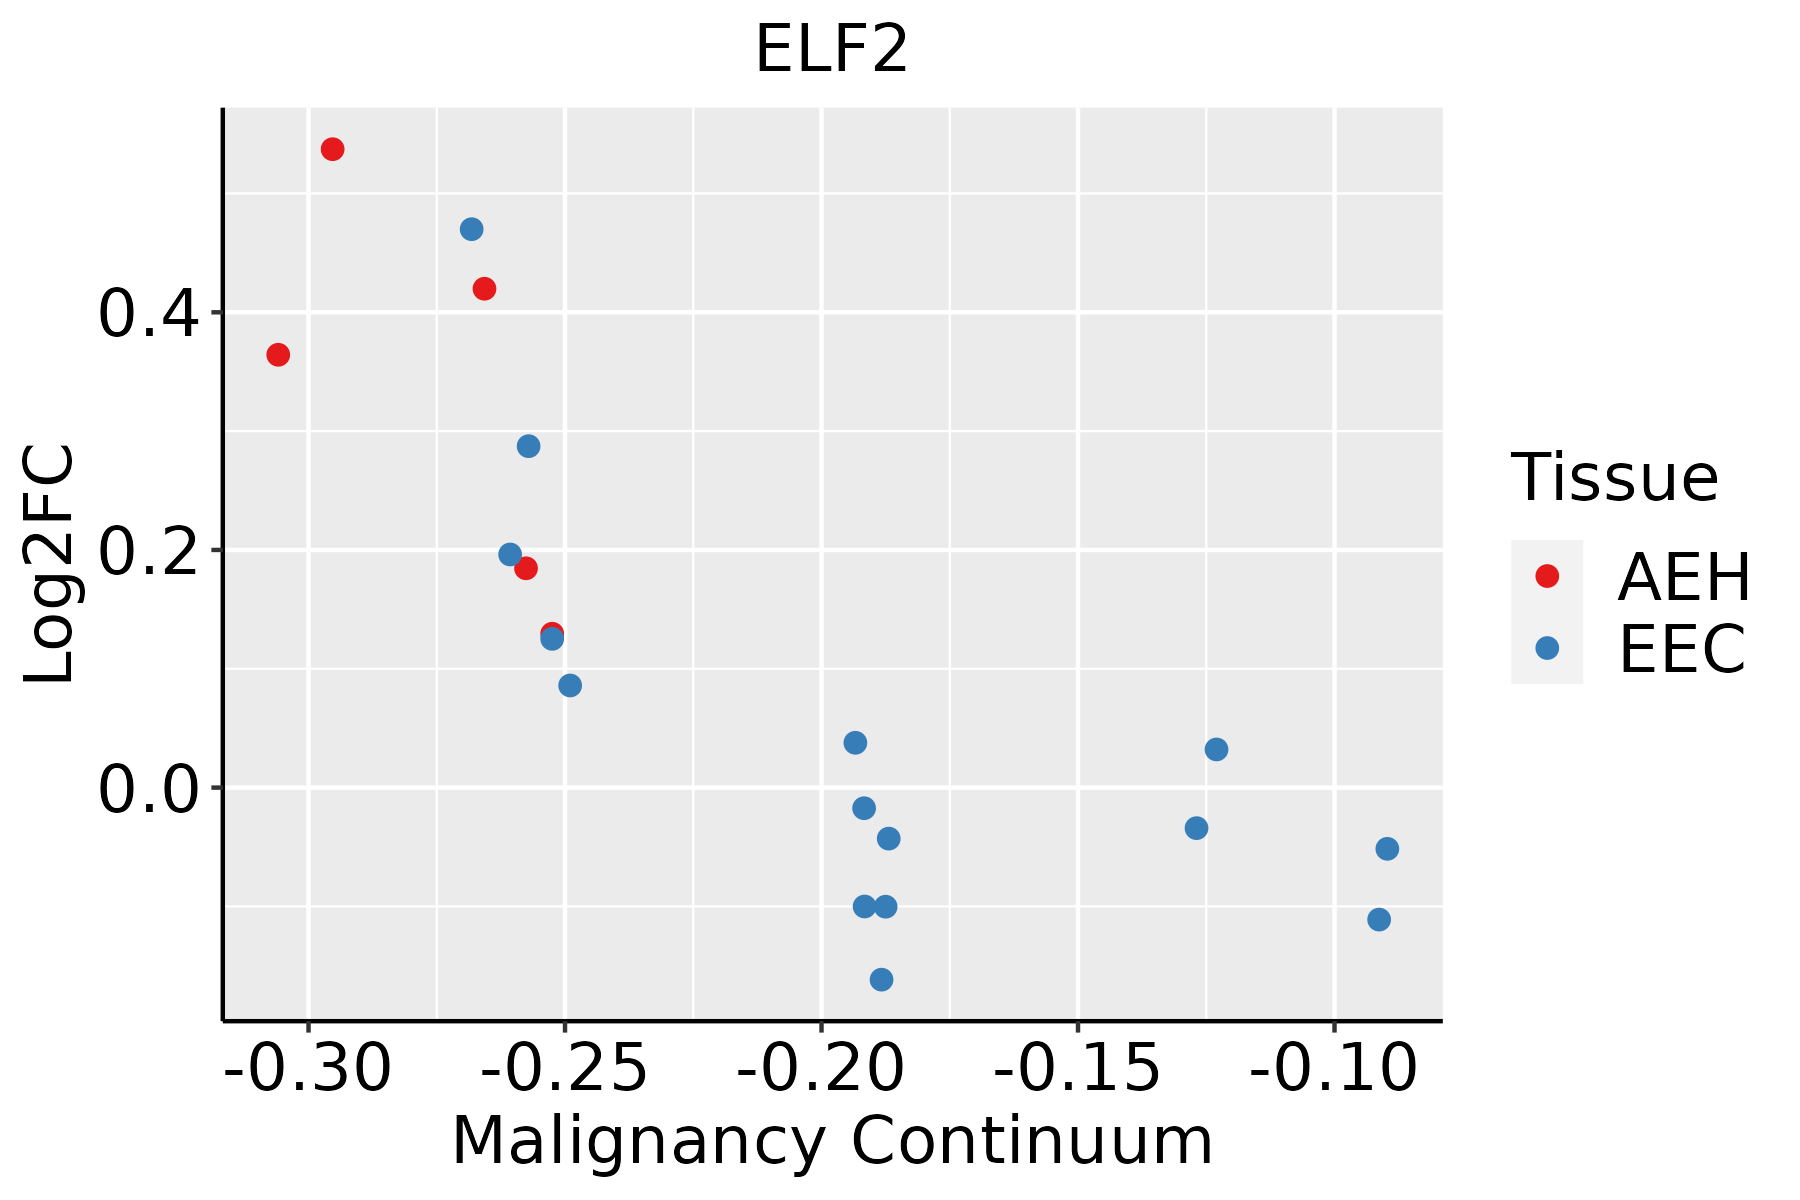 | AEH: Atypical endometrial hyperplasia |
| EEC: Endometrioid Cancer | ||
| Esophagus |  | ESCC: Esophageal squamous cell carcinoma |
| HGIN: High-grade intraepithelial neoplasias | ||
| LGIN: Low-grade intraepithelial neoplasias | ||
| Liver |  | HCC: Hepatocellular carcinoma |
| NAFLD: Non-alcoholic fatty liver disease | ||
| Lung | 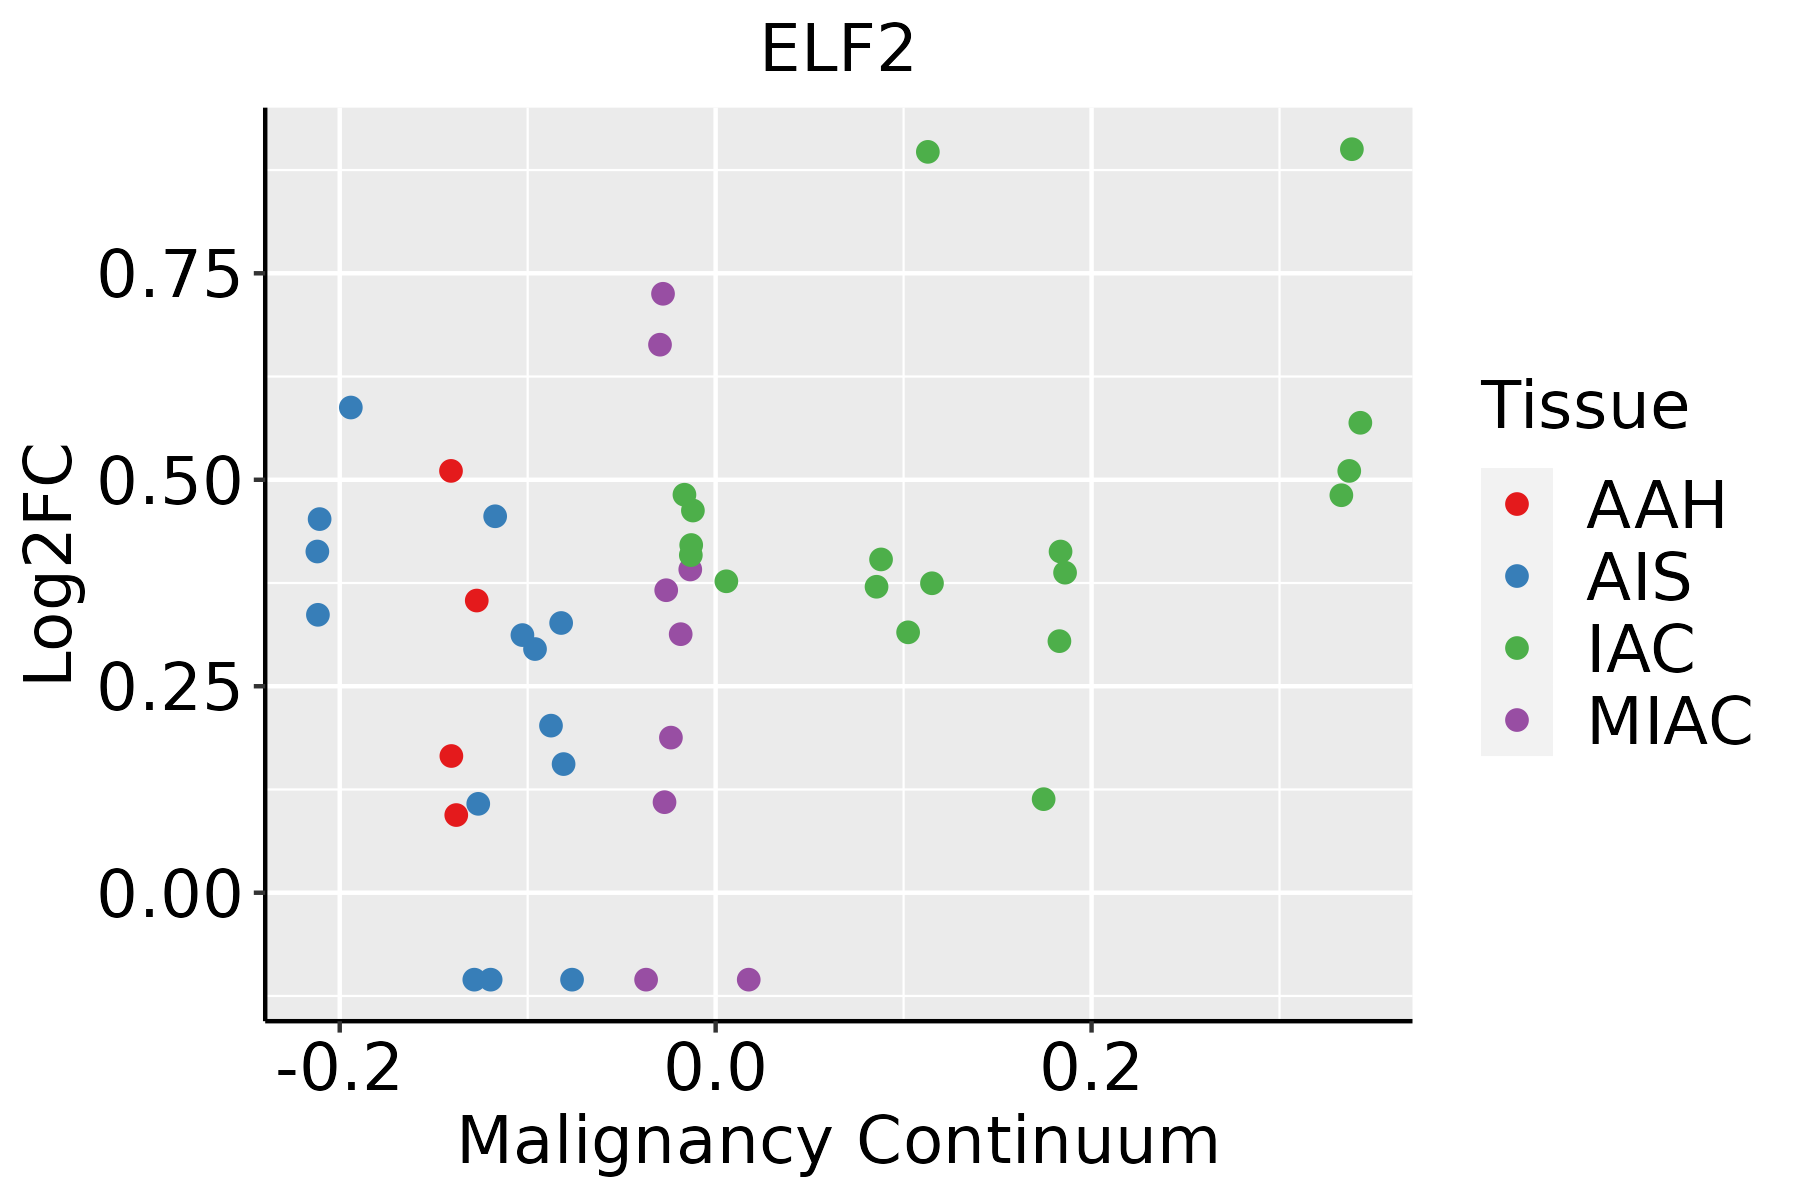 | AAH: Atypical adenomatous hyperplasia |
| AIS: Adenocarcinoma in situ | ||
| IAC: Invasive lung adenocarcinoma | ||
| MIA: Minimally invasive adenocarcinoma | ||
| Prostate | 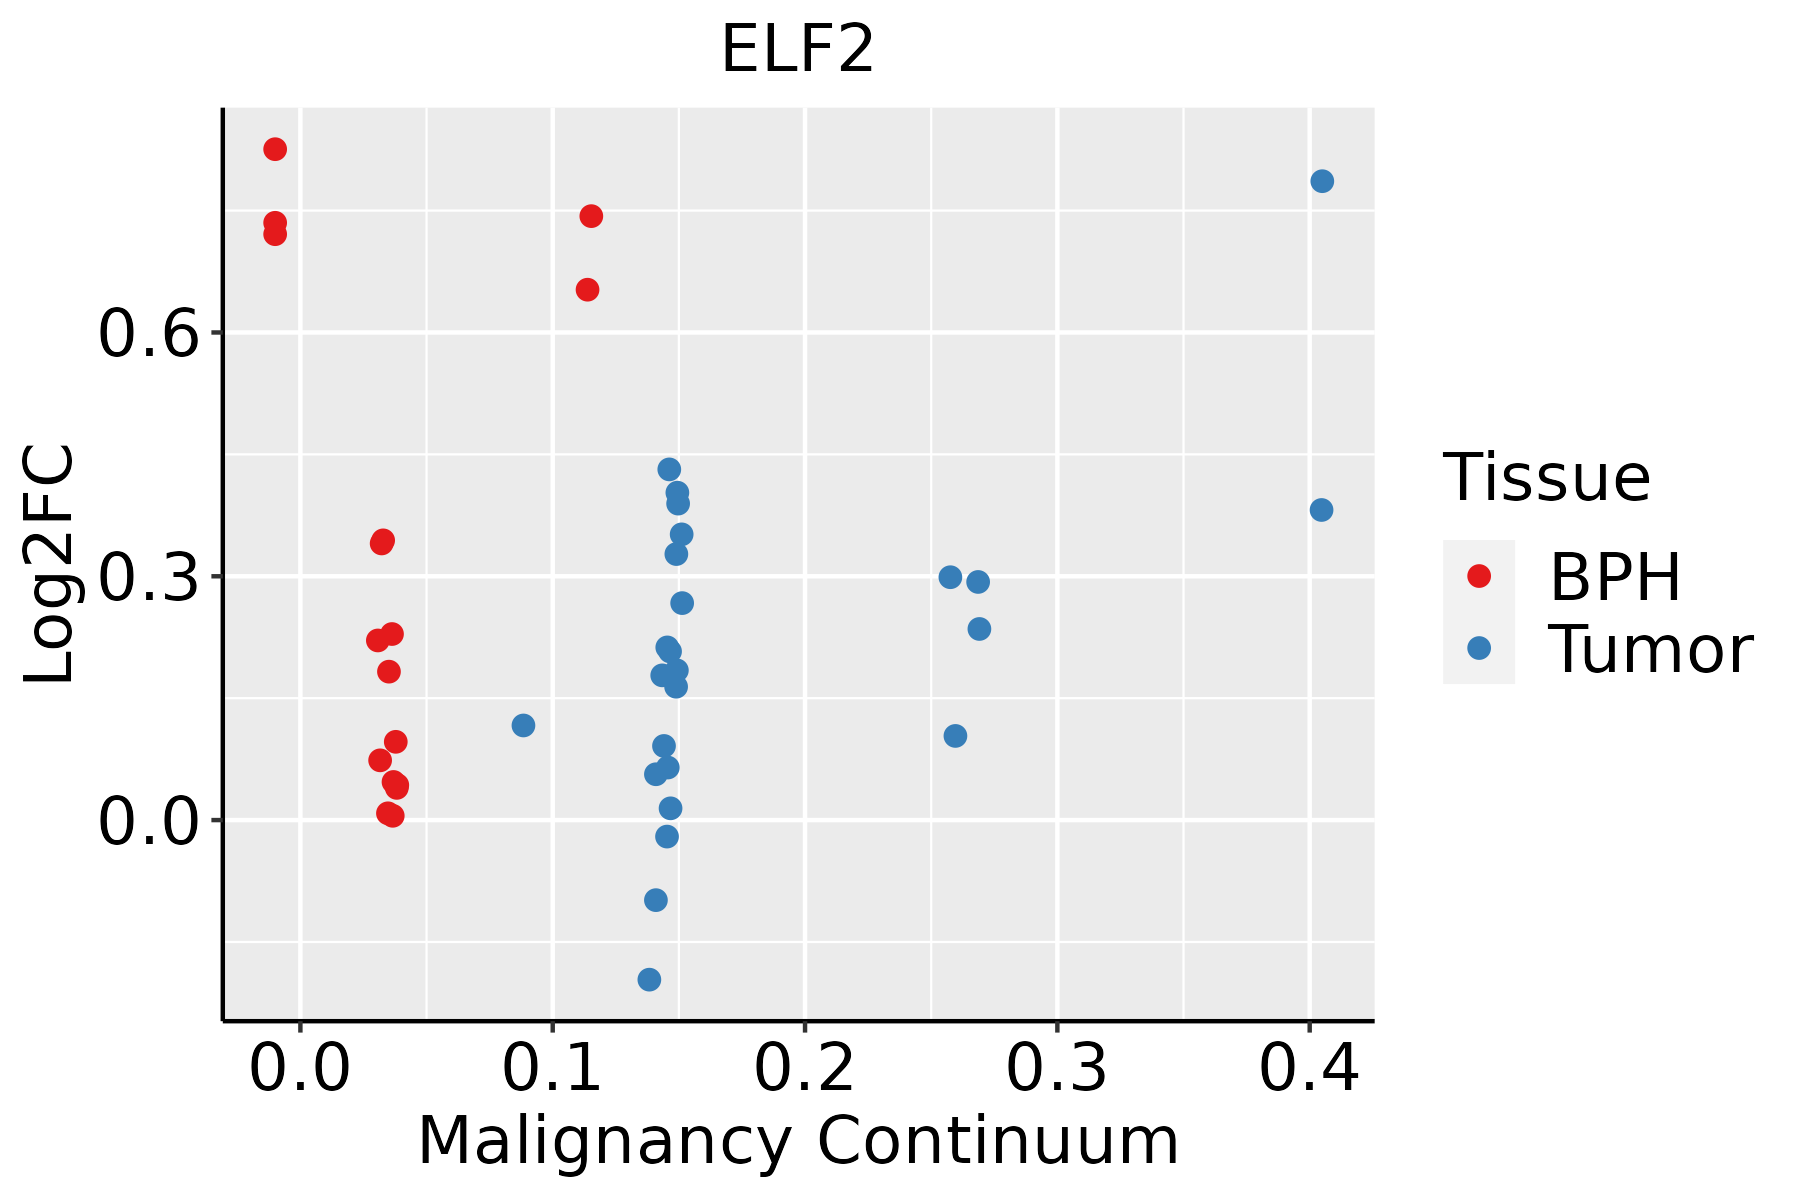 | BPH: Benign Prostatic Hyperplasia |
| Skin |  | AK: Actinic keratosis |
| cSCC: Cutaneous squamous cell carcinoma | ||
| SCCIS:squamous cell carcinoma in situ | ||
| Thyroid | 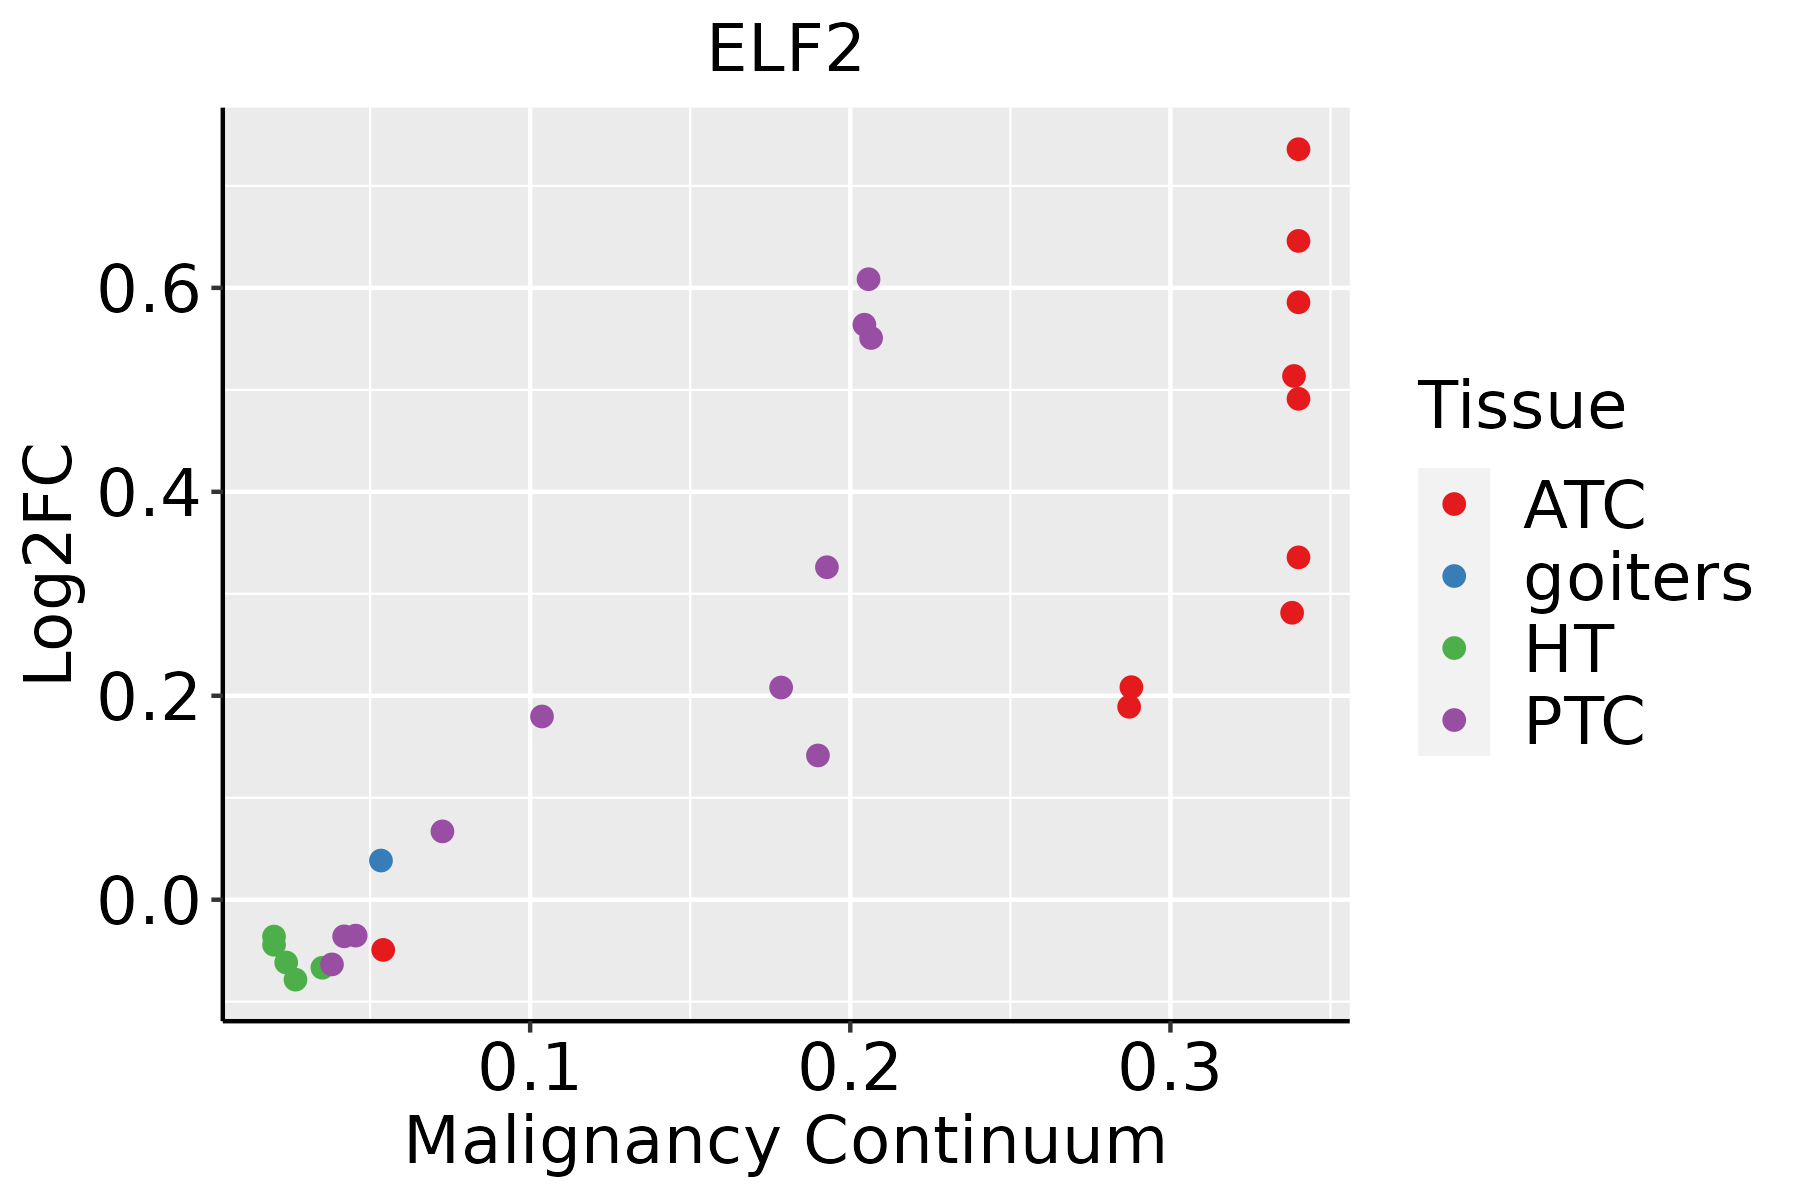 | ATC: Anaplastic thyroid cancer |
| HT: Hashimoto's thyroiditis | ||
| PTC: Papillary thyroid cancer |
| ∗log2FC in expression of this searched gene in stem-like cells from each diseased tissue sample relative to stem-like cells in normal samples in each tissue plotted against the malignancy continuum. Samples are colored based on if they are from different disease stage. |
Top |
Malignant transformation related pathway analysis |
| Find out the enriched GO biological processes and KEGG pathways involved in transition from healthy to precancer to cancer |
| Tissue | Disease Stage | Enriched GO biological Processes |
| Colorectum | AD |  |
| Colorectum | SER |  |
| Colorectum | MSS |  |
| Colorectum | MSI-H |  |
| Colorectum | FAP |  |
| ∗Top 15 enriched GO BP terms are showed in the bar plot of each disease state in each tissue. Each row represents a significant GO biological process which is colored according to the -log10(p.adjust). |
| Page: 1 2 3 4 5 6 7 8 9 |
| GO ID | Tissue | Disease Stage | Description | Gene Ratio | Bg Ratio | pvalue | p.adjust | Count |
| GO:0008380 | Colorectum | AD | RNA splicing | 169/3918 | 434/18723 | 3.59e-18 | 2.04e-15 | 169 |
| GO:0000377 | Colorectum | AD | RNA splicing, via transesterification reactions with bulged adenosine as nucleophile | 130/3918 | 320/18723 | 5.88e-16 | 2.16e-13 | 130 |
| GO:0000398 | Colorectum | AD | mRNA splicing, via spliceosome | 130/3918 | 320/18723 | 5.88e-16 | 2.16e-13 | 130 |
| GO:0000375 | Colorectum | AD | RNA splicing, via transesterification reactions | 131/3918 | 324/18723 | 7.11e-16 | 2.22e-13 | 131 |
| GO:1903311 | Colorectum | AD | regulation of mRNA metabolic process | 117/3918 | 288/18723 | 1.69e-14 | 4.23e-12 | 117 |
| GO:0043484 | Colorectum | AD | regulation of RNA splicing | 70/3918 | 148/18723 | 6.47e-13 | 1.16e-10 | 70 |
| GO:0022618 | Colorectum | AD | ribonucleoprotein complex assembly | 92/3918 | 220/18723 | 1.49e-12 | 2.60e-10 | 92 |
| GO:0071826 | Colorectum | AD | ribonucleoprotein complex subunit organization | 94/3918 | 227/18723 | 1.70e-12 | 2.87e-10 | 94 |
| GO:0048024 | Colorectum | AD | regulation of mRNA splicing, via spliceosome | 50/3918 | 101/18723 | 1.62e-10 | 1.56e-08 | 50 |
| GO:0050684 | Colorectum | AD | regulation of mRNA processing | 61/3918 | 137/18723 | 4.23e-10 | 3.58e-08 | 61 |
| GO:0022613 | Colorectum | AD | ribonucleoprotein complex biogenesis | 151/3918 | 463/18723 | 1.96e-09 | 1.39e-07 | 151 |
| GO:0000380 | Colorectum | AD | alternative mRNA splicing, via spliceosome | 33/3918 | 77/18723 | 1.13e-05 | 2.55e-04 | 33 |
| GO:0000245 | Colorectum | AD | spliceosomal complex assembly | 33/3918 | 79/18723 | 2.15e-05 | 4.33e-04 | 33 |
| GO:0000381 | Colorectum | AD | regulation of alternative mRNA splicing, via spliceosome | 27/3918 | 60/18723 | 2.41e-05 | 4.66e-04 | 27 |
| GO:0006376 | Colorectum | AD | mRNA splice site selection | 18/3918 | 49/18723 | 7.93e-03 | 4.73e-02 | 18 |
| GO:00083801 | Colorectum | SER | RNA splicing | 123/2897 | 434/18723 | 3.84e-12 | 8.41e-10 | 123 |
| GO:00226181 | Colorectum | SER | ribonucleoprotein complex assembly | 69/2897 | 220/18723 | 2.25e-09 | 2.15e-07 | 69 |
| GO:00718261 | Colorectum | SER | ribonucleoprotein complex subunit organization | 70/2897 | 227/18723 | 3.83e-09 | 3.51e-07 | 70 |
| GO:00003751 | Colorectum | SER | RNA splicing, via transesterification reactions | 90/2897 | 324/18723 | 8.68e-09 | 7.50e-07 | 90 |
| GO:00003771 | Colorectum | SER | RNA splicing, via transesterification reactions with bulged adenosine as nucleophile | 89/2897 | 320/18723 | 9.82e-09 | 8.14e-07 | 89 |
| Page: 1 2 3 4 5 6 7 8 9 10 11 |
| Pathway ID | Tissue | Disease Stage | Description | Gene Ratio | Bg Ratio | pvalue | p.adjust | qvalue | Count |
| Page: 1 |
Top |
Cell-cell communication analysis |
| Identification of potential cell-cell interactions between two cell types and their ligand-receptor pairs for different disease states |
| Ligand | Receptor | LRpair | Pathway | Tissue | Disease Stage |
| Page: 1 |
Top |
Single-cell gene regulatory network inference analysis |
| Find out the significant the regulons (TFs) and the target genes of each regulon across cell types for different disease states |
| TF | Cell Type | Tissue | Disease Stage | Target Gene | RSS | Regulon Activity |
| ELF2 | STM | Esophagus | Healthy | F3,DYNC1LI1,RALGDS, etc. | 4.73e-01 |  |
| ELF2 | INMON | Oral cavity | NEOLP | BTRC,COQ8A,TXNDC16, etc. | 3.29e-02 |  |
| ELF2 | BAS | Skin | ADJ | NCOA1,SMC5,ATF2, etc. | 1.97e-01 |  |
| ELF2 | BAS | Skin | cSCC | NCOA1,SMC5,ATF2, etc. | 1.41e-01 |  |
| ELF2 | BAS | Skin | SCCIS | NCOA1,SMC5,ATF2, etc. | 1.82e-01 |  |
| ∗The dot plots of a searched regulon are shown for all cell subpopulations in each disease state of each tissue based on the regulon specific score inferred using pySCENIC and by calculating the average expression. |
| Page: 1 |
Top |
Somatic mutation of malignant transformation related genes |
| Annotation of somatic variants for genes involved in malignant transformation |
| Hugo Symbol | Variant Class | Variant Classification | dbSNP RS | HGVSc | HGVSp | HGVSp Short | SWISSPROT | BIOTYPE | SIFT | PolyPhen | Tumor Sample Barcode | Tissue | Histology | Sex | Age | Stage | Therapy Types | Drugs | Outcome |
| ELF2 | SNV | Missense_Mutation | c.1436N>G | p.Thr479Ser | p.T479S | Q15723 | protein_coding | tolerated(0.8) | benign(0) | TCGA-BH-A0EE-01 | Breast | breast invasive carcinoma | Female | >=65 | I/II | Chemotherapy | docetaxel | SD | |
| ELF2 | SNV | Missense_Mutation | rs772612721 | c.1244N>T | p.Ala415Val | p.A415V | Q15723 | protein_coding | tolerated(0.11) | benign(0.009) | TCGA-EW-A1PB-01 | Breast | breast invasive carcinoma | Female | >=65 | III/IV | Unknown | Unknown | SD |
| ELF2 | SNV | Missense_Mutation | novel | c.878N>A | p.Pro293Gln | p.P293Q | Q15723 | protein_coding | deleterious(0) | probably_damaging(1) | TCGA-EW-A2FR-01 | Breast | breast invasive carcinoma | Female | <65 | III/IV | Chemotherapy | epirubicin | SD |
| ELF2 | SNV | Missense_Mutation | novel | c.791T>G | p.Met264Arg | p.M264R | Q15723 | protein_coding | deleterious(0) | probably_damaging(0.996) | TCGA-5M-AAT6-01 | Colorectum | colon adenocarcinoma | Female | <65 | III/IV | Unknown | Unknown | PD |
| ELF2 | SNV | Missense_Mutation | c.857N>C | p.Val286Ala | p.V286A | Q15723 | protein_coding | tolerated(0.23) | possibly_damaging(0.773) | TCGA-AA-3672-01 | Colorectum | colon adenocarcinoma | Female | >=65 | III/IV | Unknown | Unknown | SD | |
| ELF2 | SNV | Missense_Mutation | novel | c.1309N>G | p.Thr437Ala | p.T437A | Q15723 | protein_coding | tolerated(0.83) | benign(0.007) | TCGA-CA-6717-01 | Colorectum | colon adenocarcinoma | Male | <65 | I/II | Chemotherapy | oxaliplatin | CR |
| ELF2 | SNV | Missense_Mutation | c.1702N>A | p.Val568Ile | p.V568I | Q15723 | protein_coding | tolerated(0.05) | possibly_damaging(0.764) | TCGA-EI-6882-01 | Colorectum | rectum adenocarcinoma | Male | <65 | I/II | Unknown | Unknown | SD | |
| ELF2 | SNV | Missense_Mutation | novel | c.829C>A | p.Leu277Ile | p.L277I | Q15723 | protein_coding | deleterious(0) | probably_damaging(0.98) | TCGA-F5-6814-01 | Colorectum | rectum adenocarcinoma | Male | <65 | I/II | Unknown | Unknown | SD |
| ELF2 | SNV | Missense_Mutation | novel | c.698G>T | p.Arg233Ile | p.R233I | Q15723 | protein_coding | deleterious(0) | probably_damaging(0.944) | TCGA-F5-6814-01 | Colorectum | rectum adenocarcinoma | Male | <65 | I/II | Unknown | Unknown | SD |
| ELF2 | insertion | Nonsense_Mutation | novel | c.1190_1191insCTG | p.Val397_Met398insTer | p.V397_M398ins* | Q15723 | protein_coding | TCGA-AM-5821-01 | Colorectum | colon adenocarcinoma | Female | >=65 | I/II | Unknown | Unknown | SD |
| Page: 1 2 3 4 5 |
Top |
Related drugs of malignant transformation related genes |
| Identification of chemicals and drugs interact with genes involved in malignant transfromation |
| (DGIdb 4.0) |
| Entrez ID | Symbol | Category | Interaction Types | Drug Claim Name | Drug Name | PMIDs |
| Page: 1 |

Copyright 2023-Present -The University of Texas Health Science Center at Houston |