Schematic overview of the cellular and molecular mechanisms involved in the cancer progression, including the proposed cellular and molecular mechanisms in cancer cells trajectory. AT1: alveolar type 1 cells; AT2: alveolar type 2 cells; AAH: atypical adenomatous hyperplasia; AIS: adenocarcinoma in situ; MIA: minimally invasive adenocarcinoma; IA: invasive adenocarcinoma; EMT: epithelial-mesenchymal transition

Home

Download

Statistics

Help

Contact

Center for Computational Systems Medicine
leaf

Gene summary

leaf

Malignant transformation analysis

leaf

Malignant transformation related pathway analysis

leaf

Cell-cell communication analysis

leaf

Single-cell gene regulatory network inference analysis

leaf

Somatic mutation of malignant transformation related genes

leaf

Related drugs of malignant transformation related genes

Gene: ELF1

Gene summary for ELF1

check button Gene summary.

Gene informationSpeciesHuman
Gene symbol

ELF1

Gene ID

1997

Gene nameE74 like ETS transcription factor 1
Gene AliasEFTUD1
Cytomap13q14.11
Gene Typeprotein-coding
GO ID

GO:0006139

UniProtAcc

P32519


Top

Malignant transformation analysis

check button Identification of the aberrant gene expression in precancerous and cancerous lesions by comparing the gene expression of stem-like cells in diseased tissues with normal stem cells
check button Malignant transformation involving gene list.
Entrez IDSymbolReplicatesSpeciesOrganTissueAdj P-valueLog2FCMalignancy
1997ELF1CA_HPV_1HumanCervixCC3.96e-06-9.21e-020.0264
1997ELF1CA_HPV_3HumanCervixCC8.48e-03-4.96e-020.0414
1997ELF1CCI_1HumanCervixCC1.92e-057.78e-010.528
1997ELF1CCI_2HumanCervixCC5.24e-091.49e+000.5249
1997ELF1CCI_3HumanCervixCC9.46e-101.14e+000.516
1997ELF1TumorHumanCervixCC2.36e-08-3.48e-010.1241
1997ELF1sample3HumanCervixCC2.86e-09-3.39e-010.1387
1997ELF1T1HumanCervixCC1.15e-05-4.14e-010.0918
1997ELF1T3HumanCervixCC1.37e-10-3.30e-010.1389
1997ELF1HTA11_3410_2000001011HumanColorectumAD5.32e-27-6.61e-010.0155
1997ELF1HTA11_347_2000001011HumanColorectumAD3.80e-023.39e-01-0.1954
1997ELF1HTA11_3361_2000001011HumanColorectumAD1.50e-03-5.59e-01-0.1207
1997ELF1HTA11_5212_2000001011HumanColorectumAD1.64e-02-3.04e-01-0.2061
1997ELF1HTA11_7862_2000001011HumanColorectumAD1.44e-03-3.77e-01-0.0179
1997ELF1HTA11_866_3004761011HumanColorectumAD3.44e-09-5.56e-010.096
1997ELF1HTA11_7696_3000711011HumanColorectumAD1.19e-02-3.08e-010.0674
1997ELF1HTA11_6818_2000001021HumanColorectumAD2.32e-03-4.75e-010.0588
1997ELF1HTA11_99999965104_69814HumanColorectumMSS6.66e-149.84e-010.281
1997ELF1HTA11_99999974143_84620HumanColorectumMSS4.11e-13-5.18e-010.3005
1997ELF1A001-C-207HumanColorectumFAP1.39e-04-3.67e-010.1278
Page: 1 2 3 4 5 6 7 8 9 10 11 12 13 

check button Transcriptomic changes along malignancy continuum.
TissueExpression DynamicsAbbreviation
CervixThe image shows the transcriptomic changes along malignancy continuum.log2FC in expression of this searched gene in stem-like cells from each diseased tissue sample relative to stem-like cells in normal samples in each tissue plotted against the malignancy continuum. Samples are colored based on if they are from different disease stage.CC: Cervix cancer
HSIL_HPV: HPV-infected high-grade squamous intraepithelial lesions
N_HPV: HPV-infected normal cervix
Colorectum (GSE201348)The image shows the transcriptomic changes along malignancy continuum.log2FC in expression of this searched gene in stem-like cells from each diseased tissue sample relative to stem-like cells in normal samples in each tissue plotted against the malignancy continuum. Samples are colored based on if they are from different disease stage.FAP: Familial adenomatous polyposis
CRC: Colorectal cancer
Colorectum (HTA11)The image shows the transcriptomic changes along malignancy continuum.log2FC in expression of this searched gene in stem-like cells from each diseased tissue sample relative to stem-like cells in normal samples in each tissue plotted against the malignancy continuum. Samples are colored based on if they are from different disease stage.AD: Adenomas
SER: Sessile serrated lesions
MSI-H: Microsatellite-high colorectal cancer
MSS: Microsatellite stable colorectal cancer
EndometriumThe image shows the transcriptomic changes along malignancy continuum.log2FC in expression of this searched gene in stem-like cells from each diseased tissue sample relative to stem-like cells in normal samples in each tissue plotted against the malignancy continuum. Samples are colored based on if they are from different disease stage.
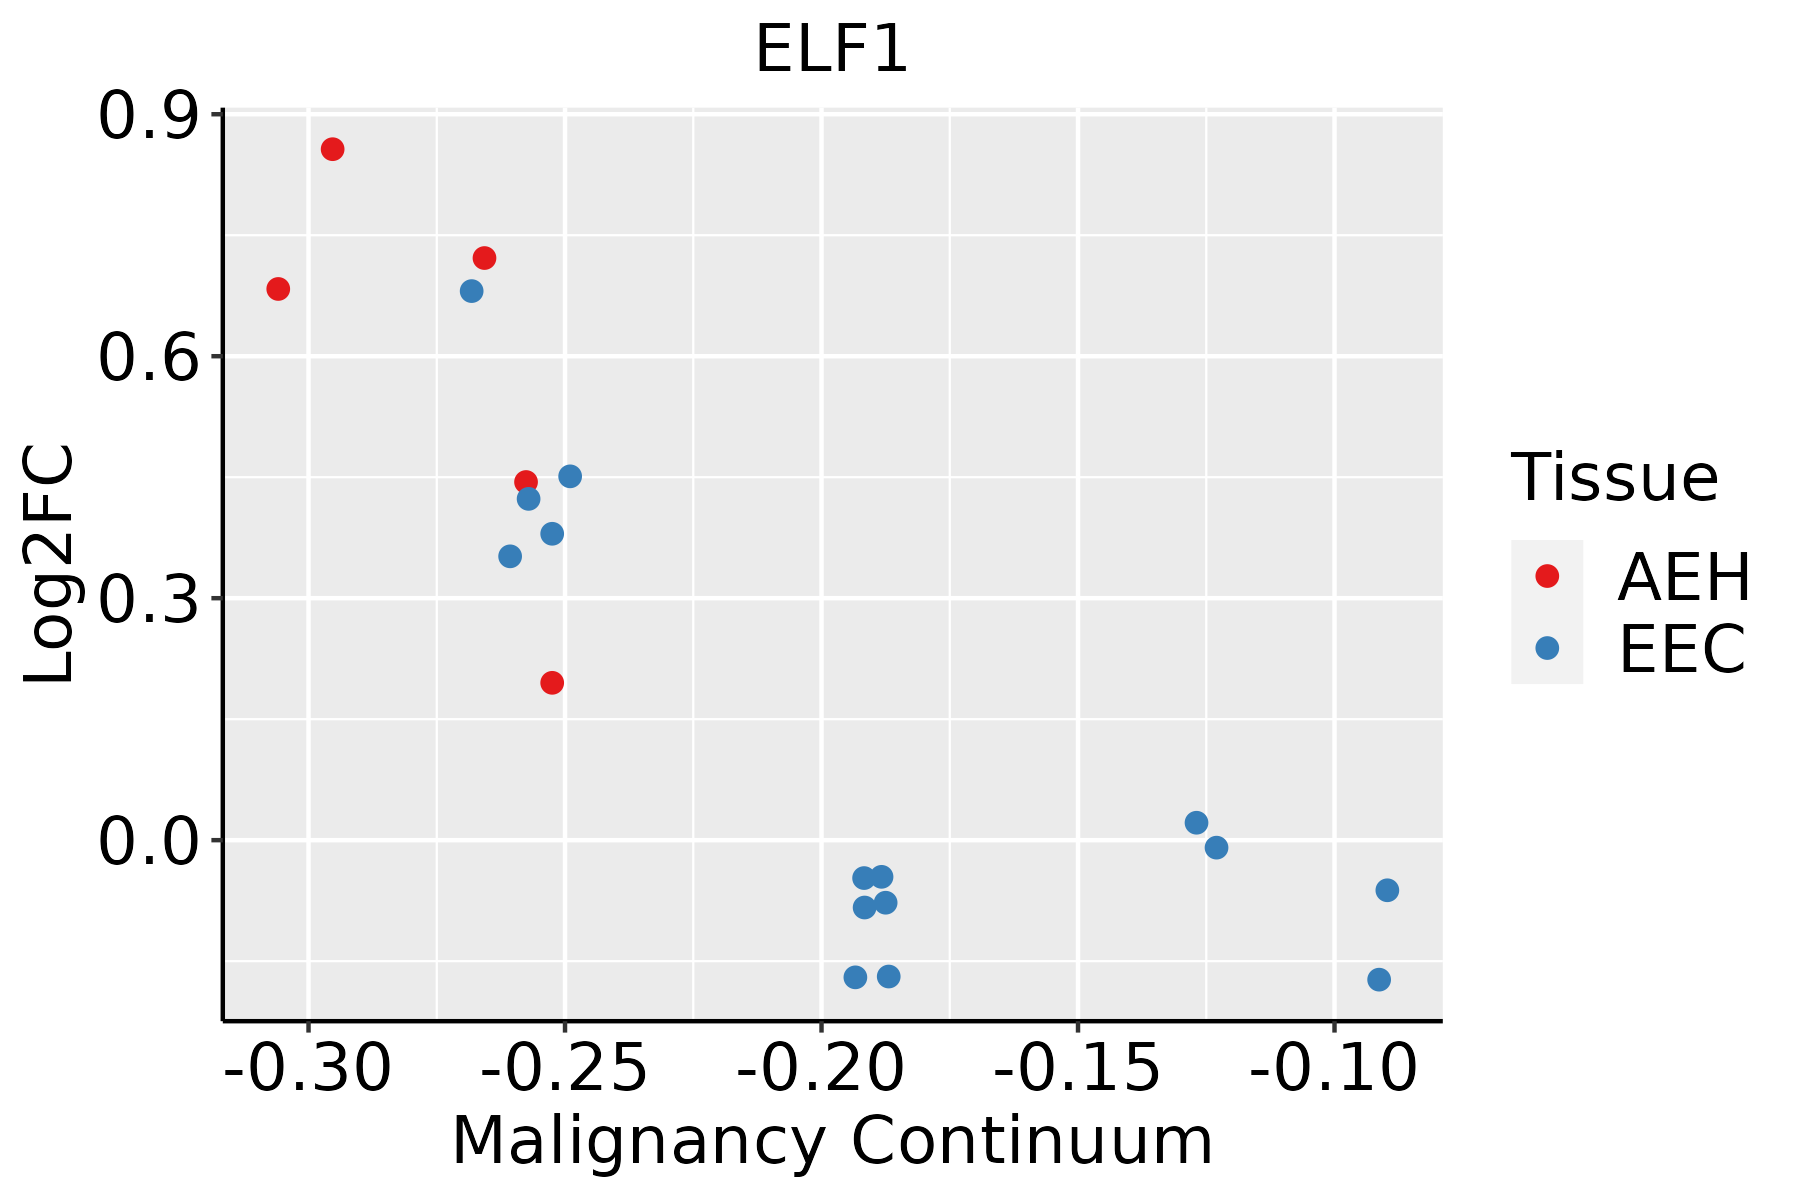
AEH: Atypical endometrial hyperplasia
EEC: Endometrioid Cancer
EsophagusThe image shows the transcriptomic changes along malignancy continuum.log2FC in expression of this searched gene in stem-like cells from each diseased tissue sample relative to stem-like cells in normal samples in each tissue plotted against the malignancy continuum. Samples are colored based on if they are from different disease stage.
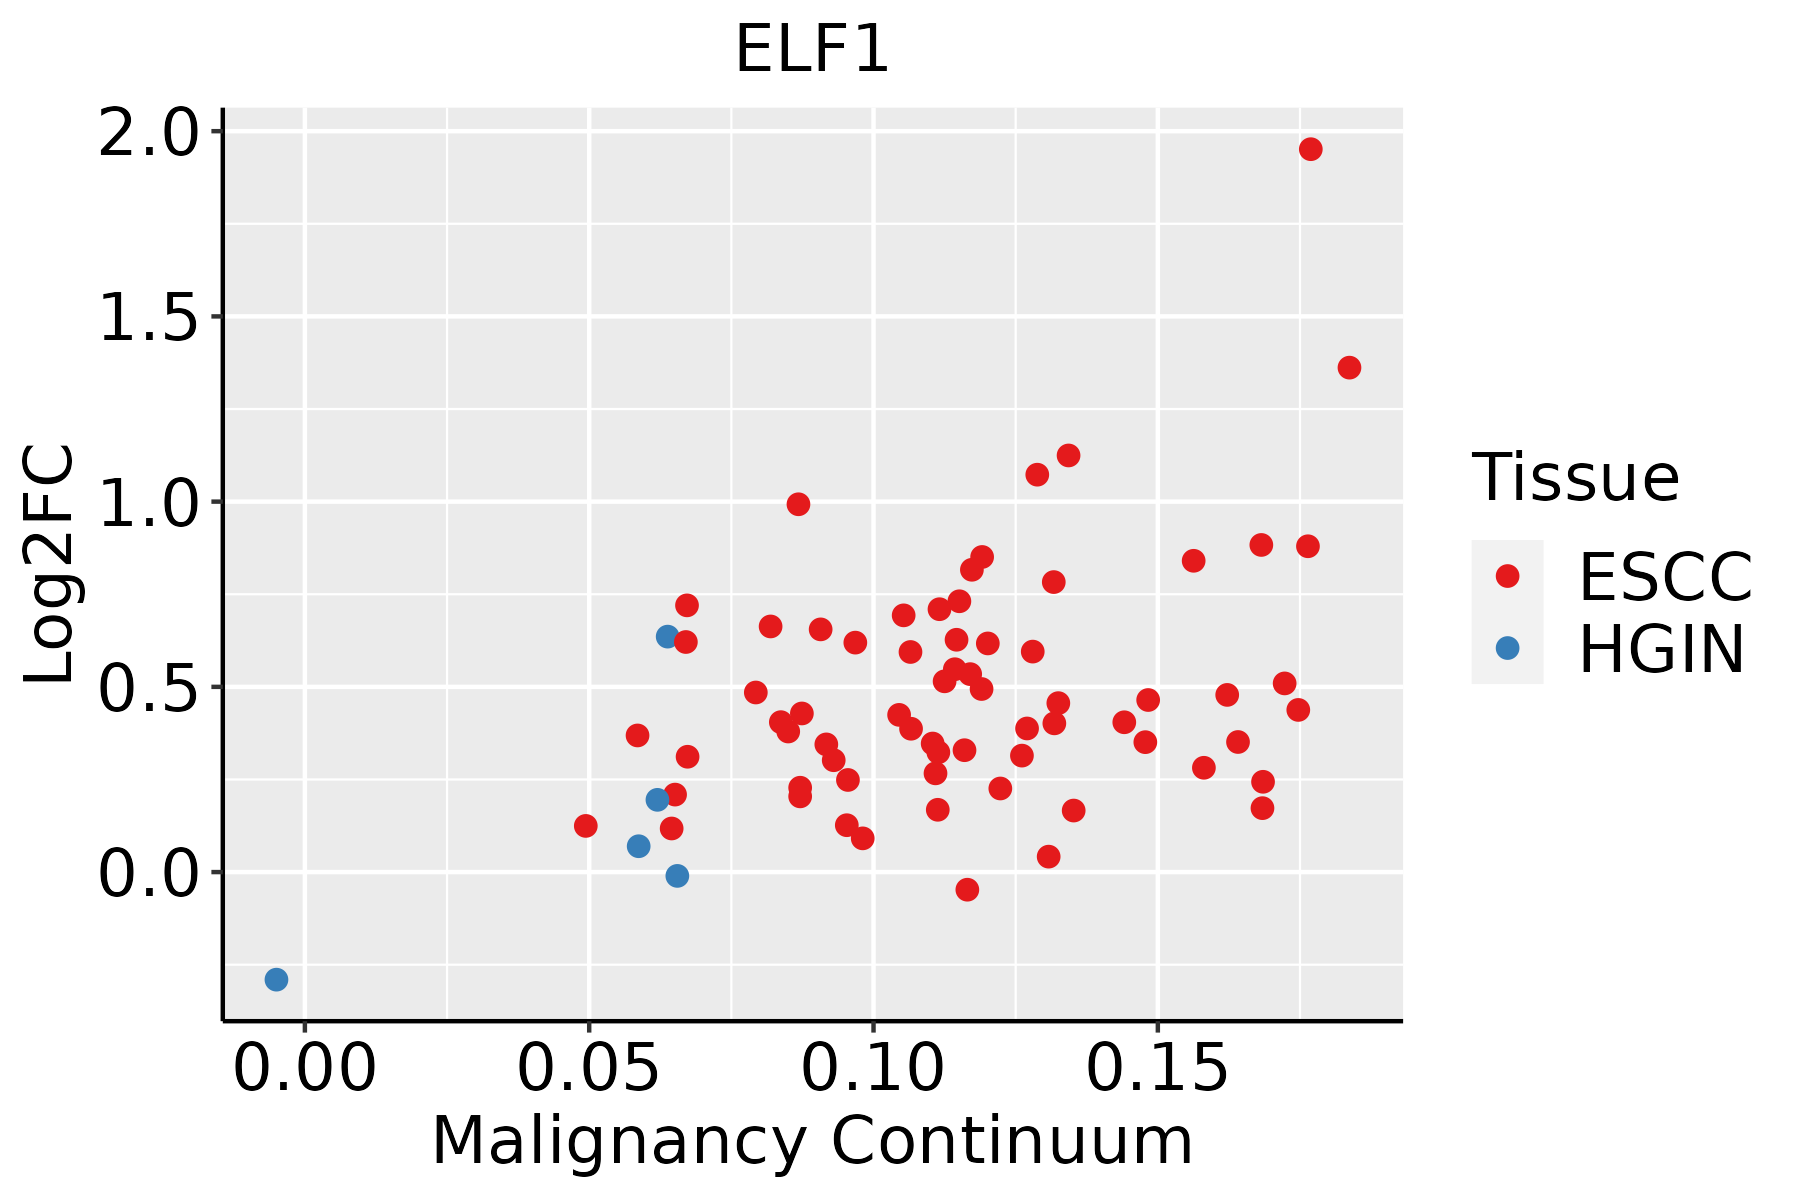
ESCC: Esophageal squamous cell carcinoma
HGIN: High-grade intraepithelial neoplasias
LGIN: Low-grade intraepithelial neoplasias
LiverThe image shows the transcriptomic changes along malignancy continuum.log2FC in expression of this searched gene in stem-like cells from each diseased tissue sample relative to stem-like cells in normal samples in each tissue plotted against the malignancy continuum. Samples are colored based on if they are from different disease stage.
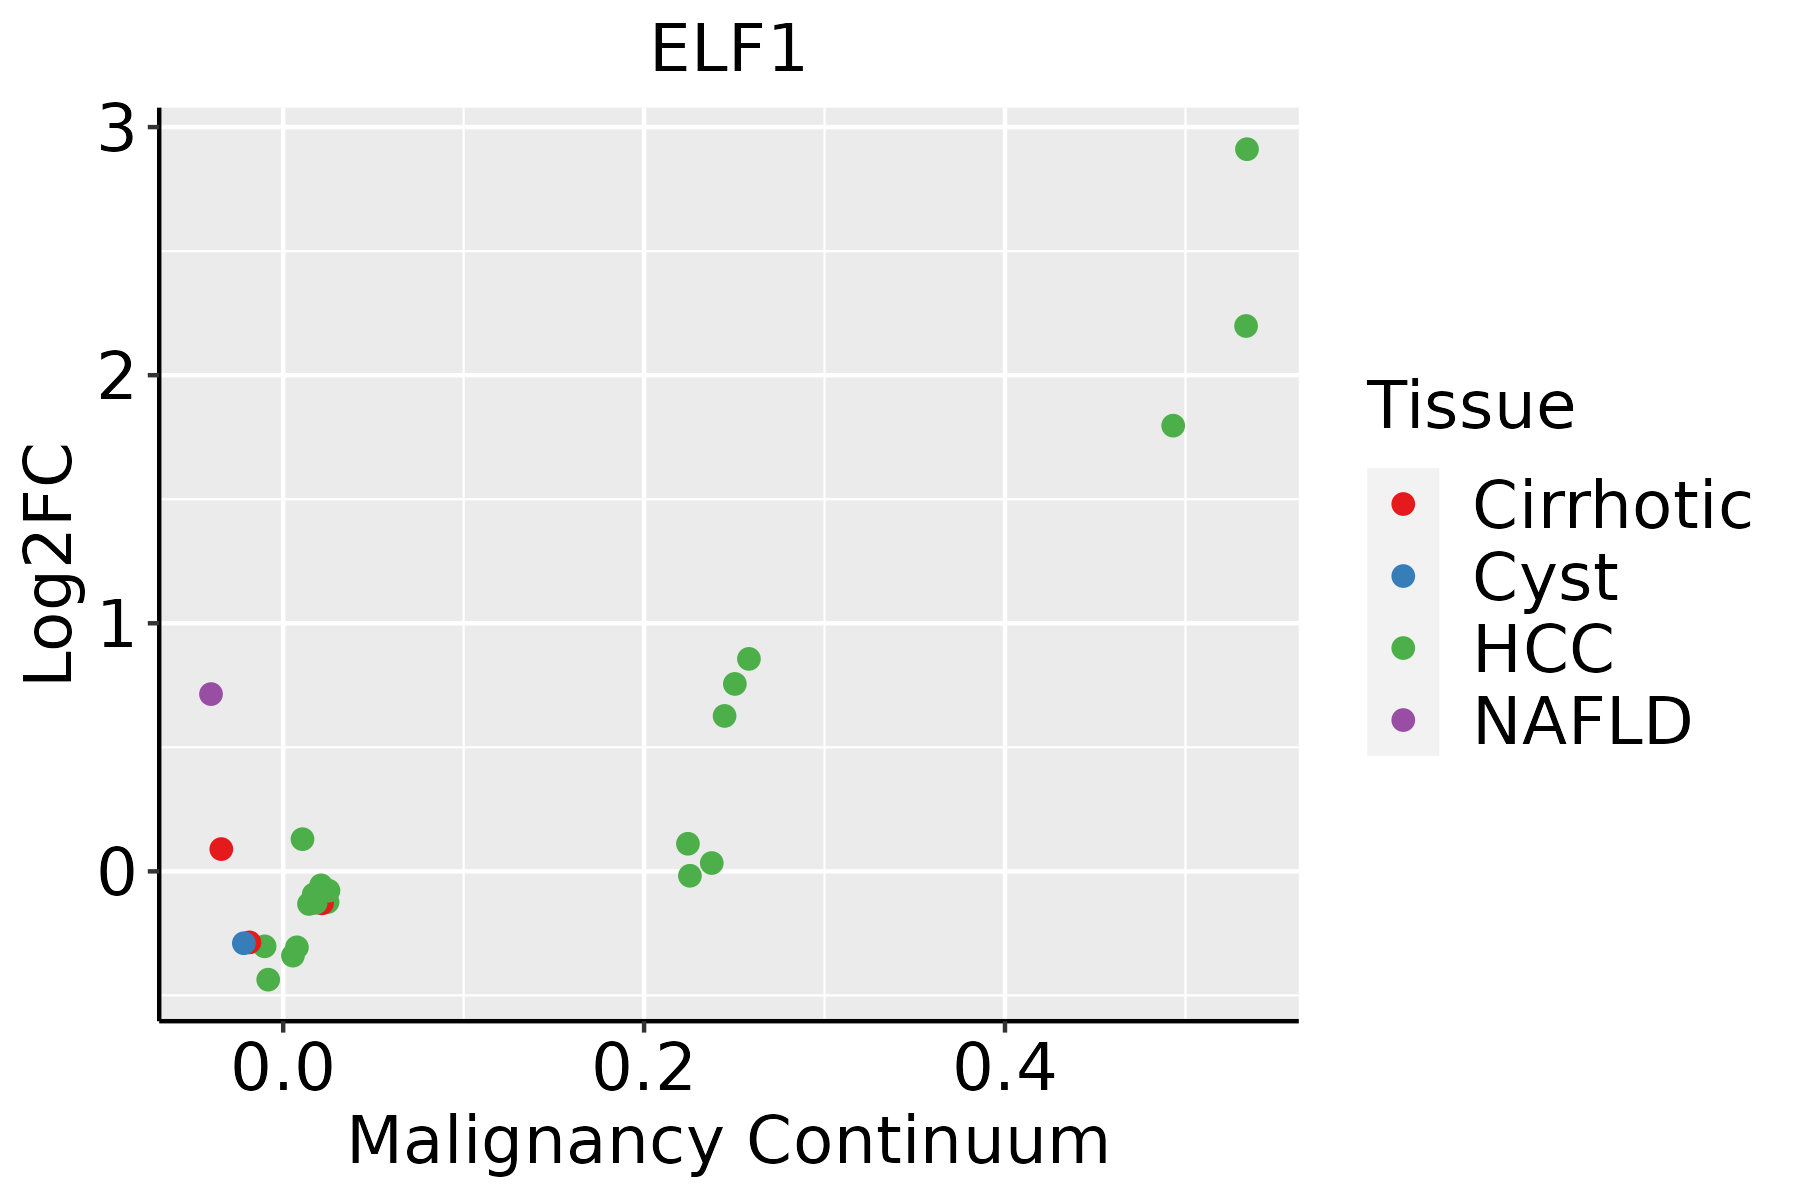
HCC: Hepatocellular carcinoma
NAFLD: Non-alcoholic fatty liver disease
LungThe image shows the transcriptomic changes along malignancy continuum.log2FC in expression of this searched gene in stem-like cells from each diseased tissue sample relative to stem-like cells in normal samples in each tissue plotted against the malignancy continuum. Samples are colored based on if they are from different disease stage.
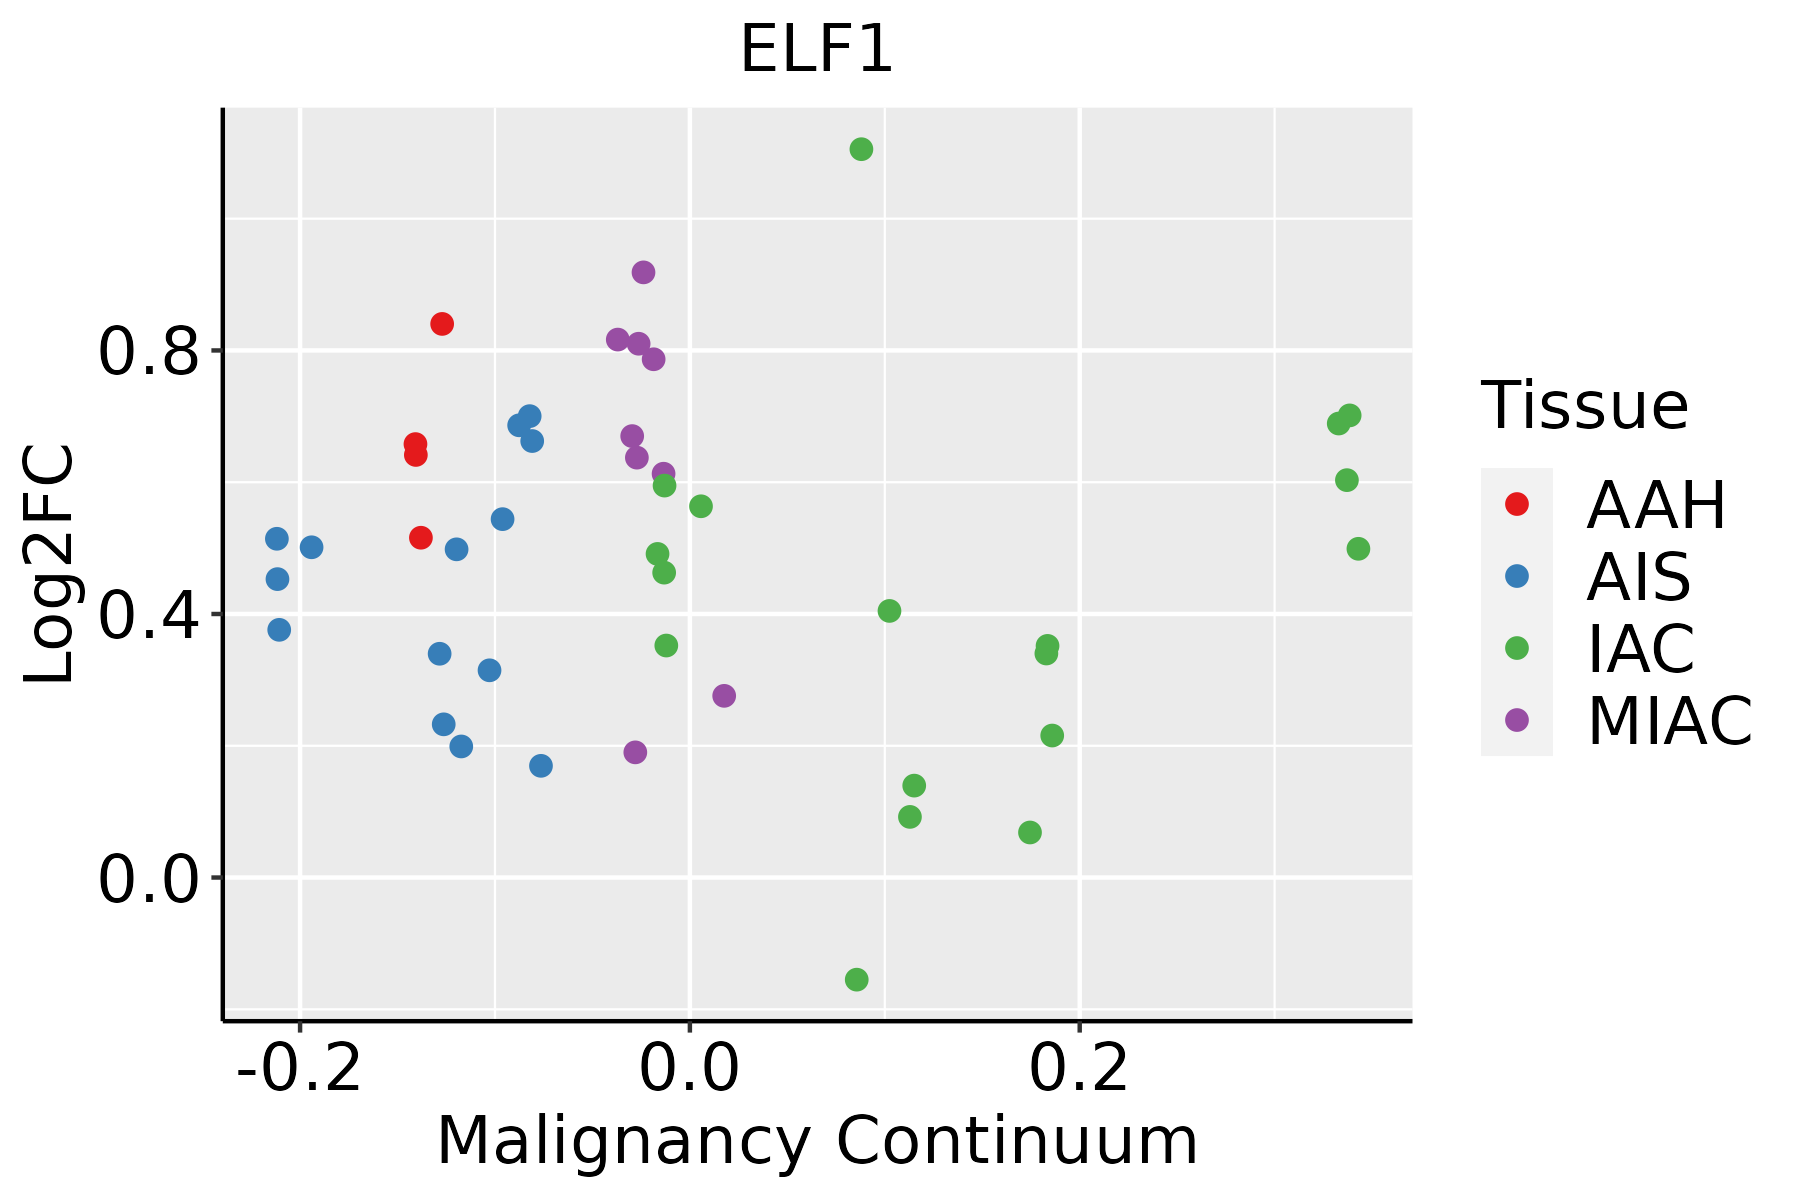
AAH: Atypical adenomatous hyperplasia
AIS: Adenocarcinoma in situ
IAC: Invasive lung adenocarcinoma
MIA: Minimally invasive adenocarcinoma
Oral CavityThe image shows the transcriptomic changes along malignancy continuum.log2FC in expression of this searched gene in stem-like cells from each diseased tissue sample relative to stem-like cells in normal samples in each tissue plotted against the malignancy continuum. Samples are colored based on if they are from different disease stage.
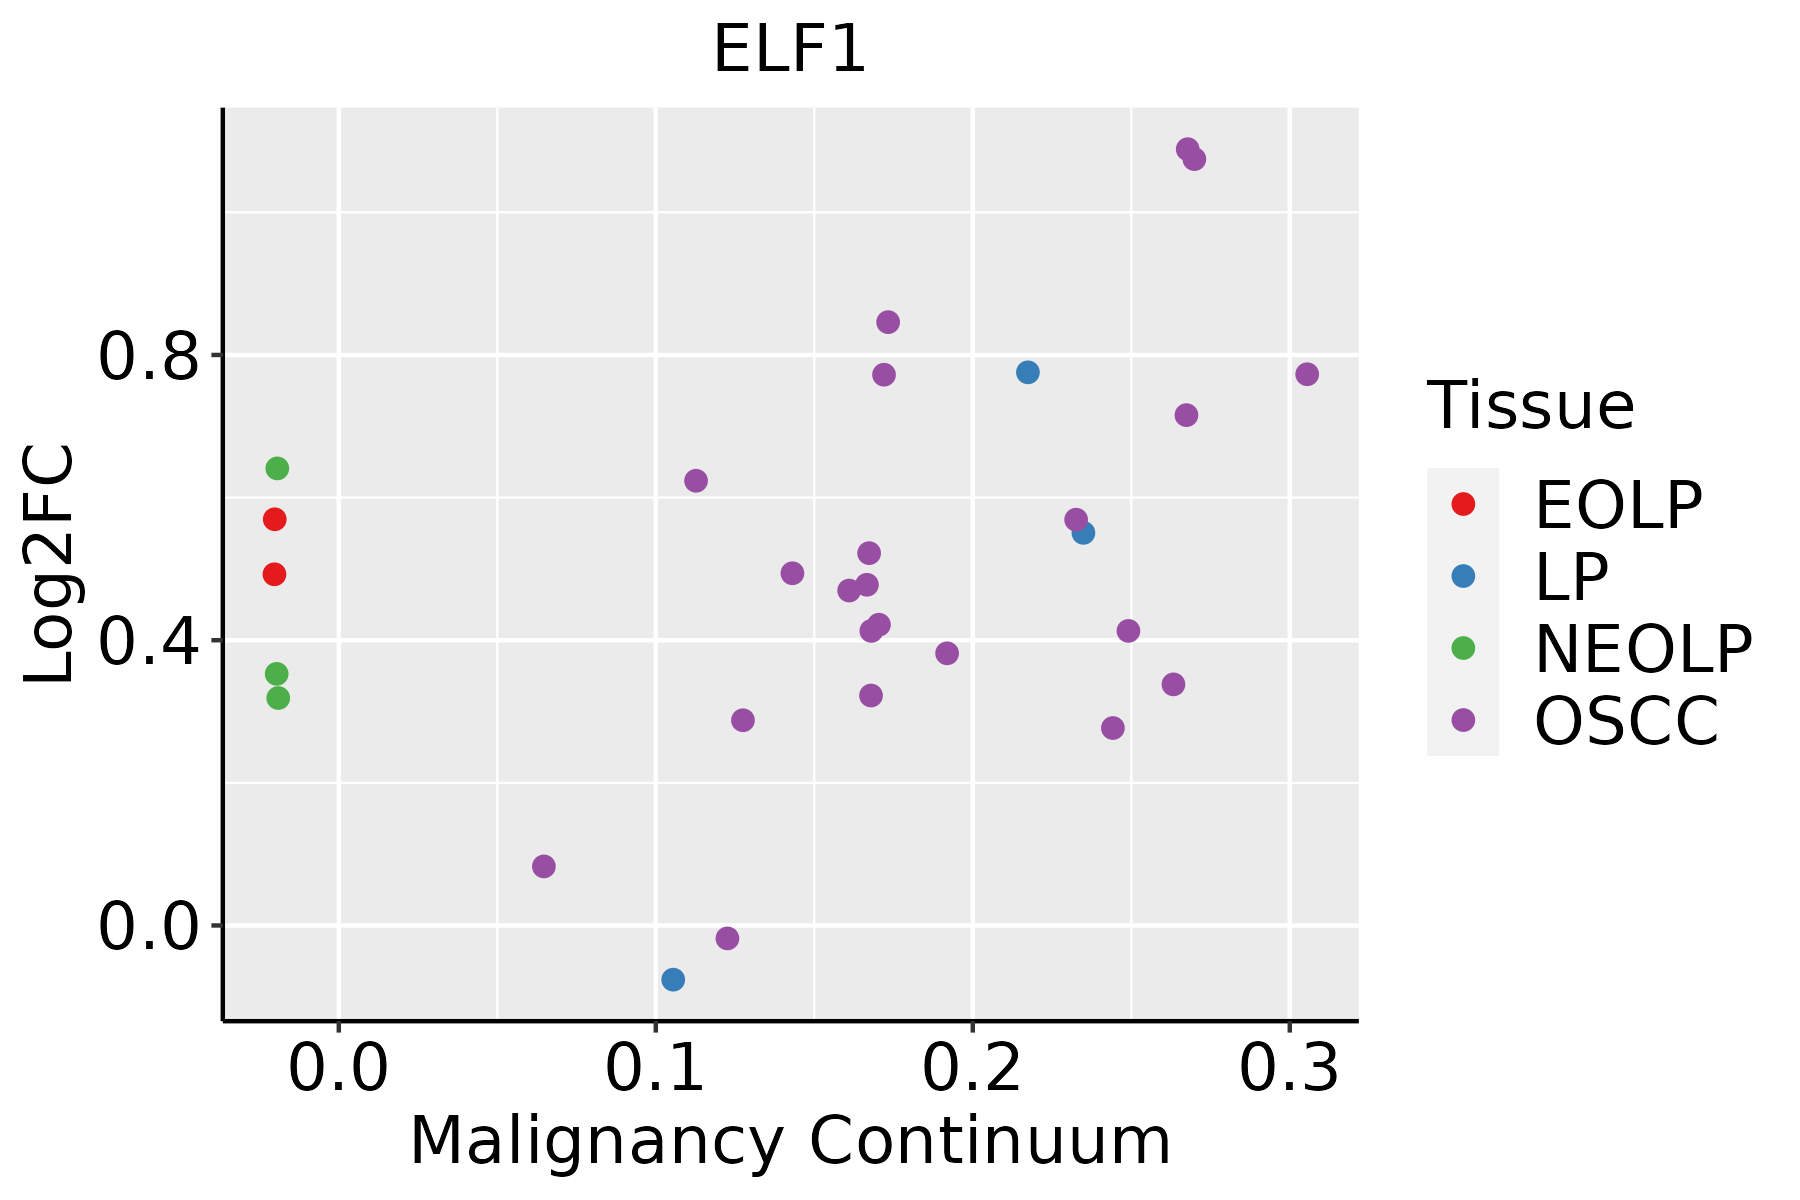
EOLP: Erosive Oral lichen planus
LP: leukoplakia
NEOLP: Non-erosive oral lichen planus
OSCC: Oral squamous cell carcinoma
ProstateThe image shows the transcriptomic changes along malignancy continuum.log2FC in expression of this searched gene in stem-like cells from each diseased tissue sample relative to stem-like cells in normal samples in each tissue plotted against the malignancy continuum. Samples are colored based on if they are from different disease stage.BPH: Benign Prostatic Hyperplasia
SkinThe image shows the transcriptomic changes along malignancy continuum.log2FC in expression of this searched gene in stem-like cells from each diseased tissue sample relative to stem-like cells in normal samples in each tissue plotted against the malignancy continuum. Samples are colored based on if they are from different disease stage.
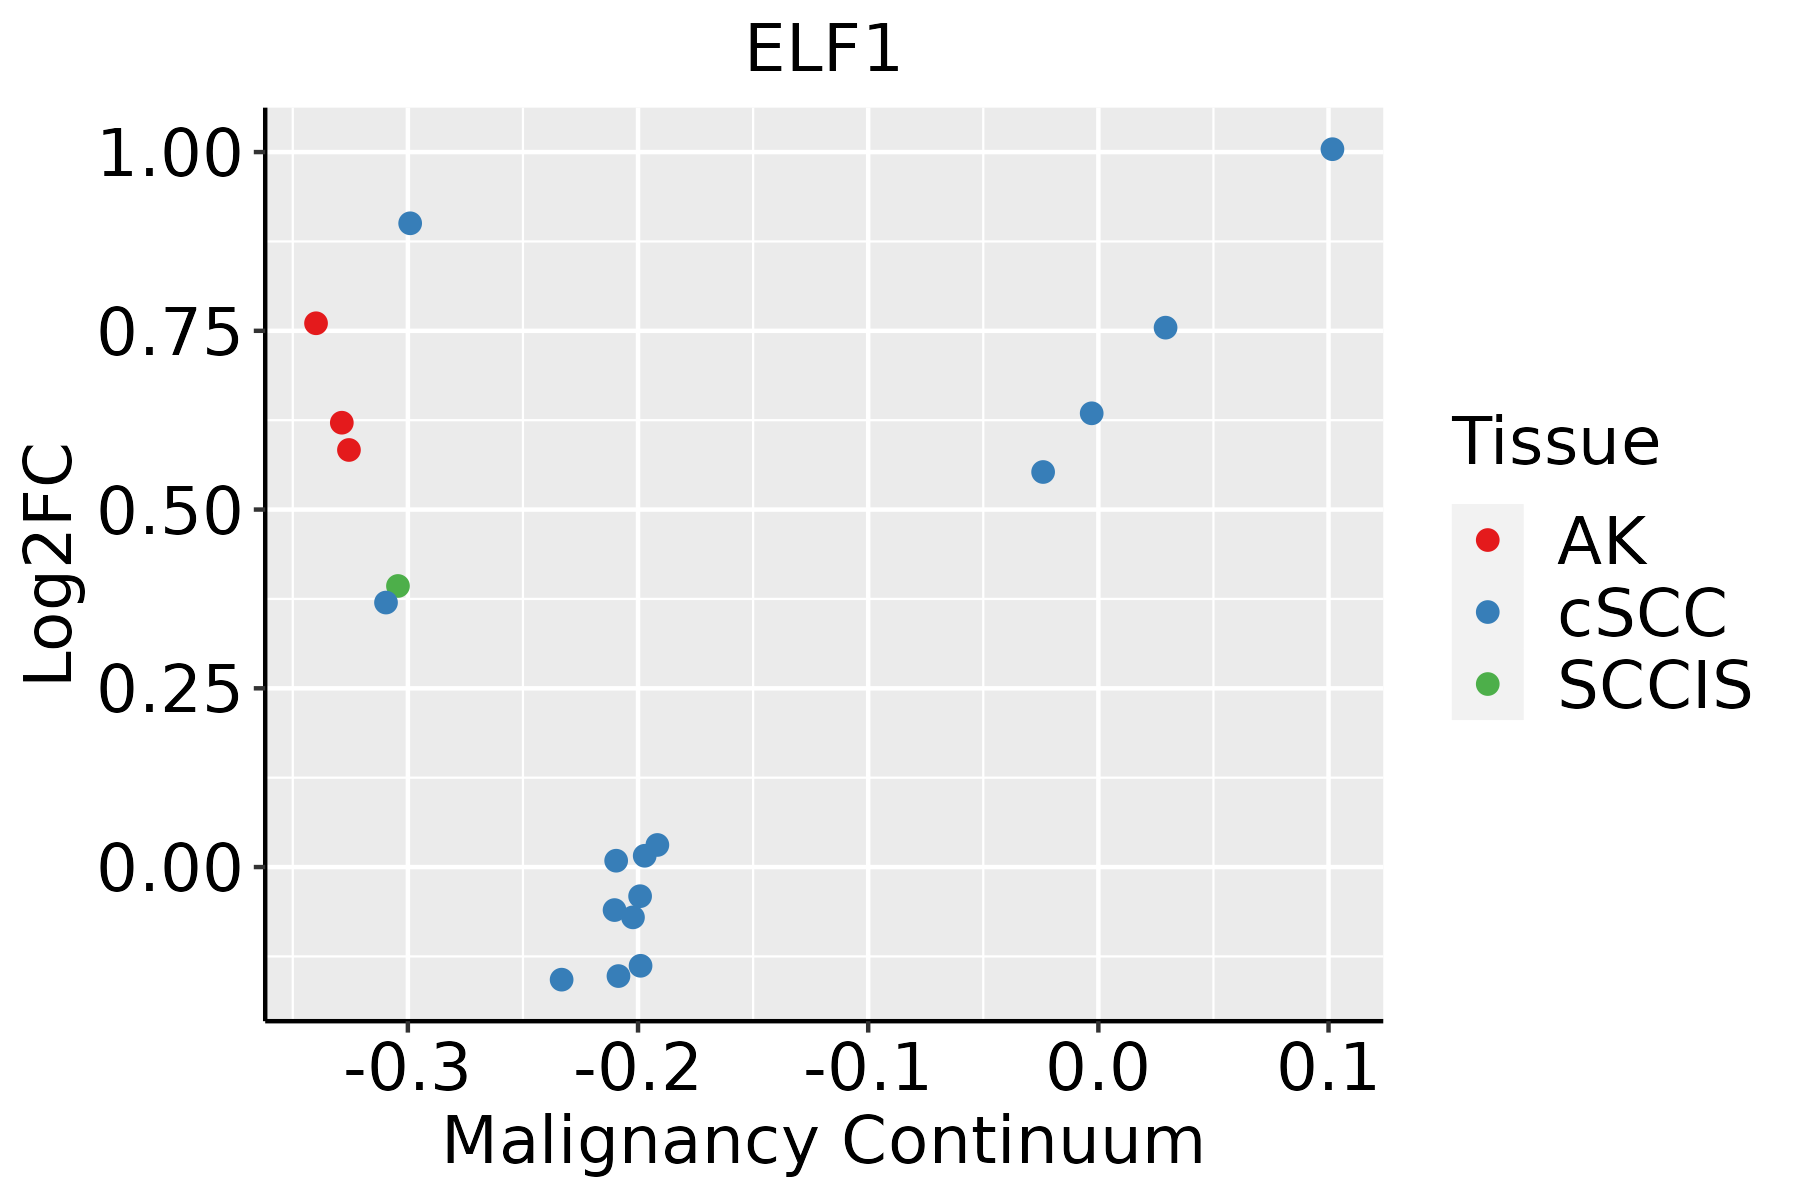
AK: Actinic keratosis
cSCC: Cutaneous squamous cell carcinoma
SCCIS:squamous cell carcinoma in situ
ThyroidThe image shows the transcriptomic changes along malignancy continuum.log2FC in expression of this searched gene in stem-like cells from each diseased tissue sample relative to stem-like cells in normal samples in each tissue plotted against the malignancy continuum. Samples are colored based on if they are from different disease stage.
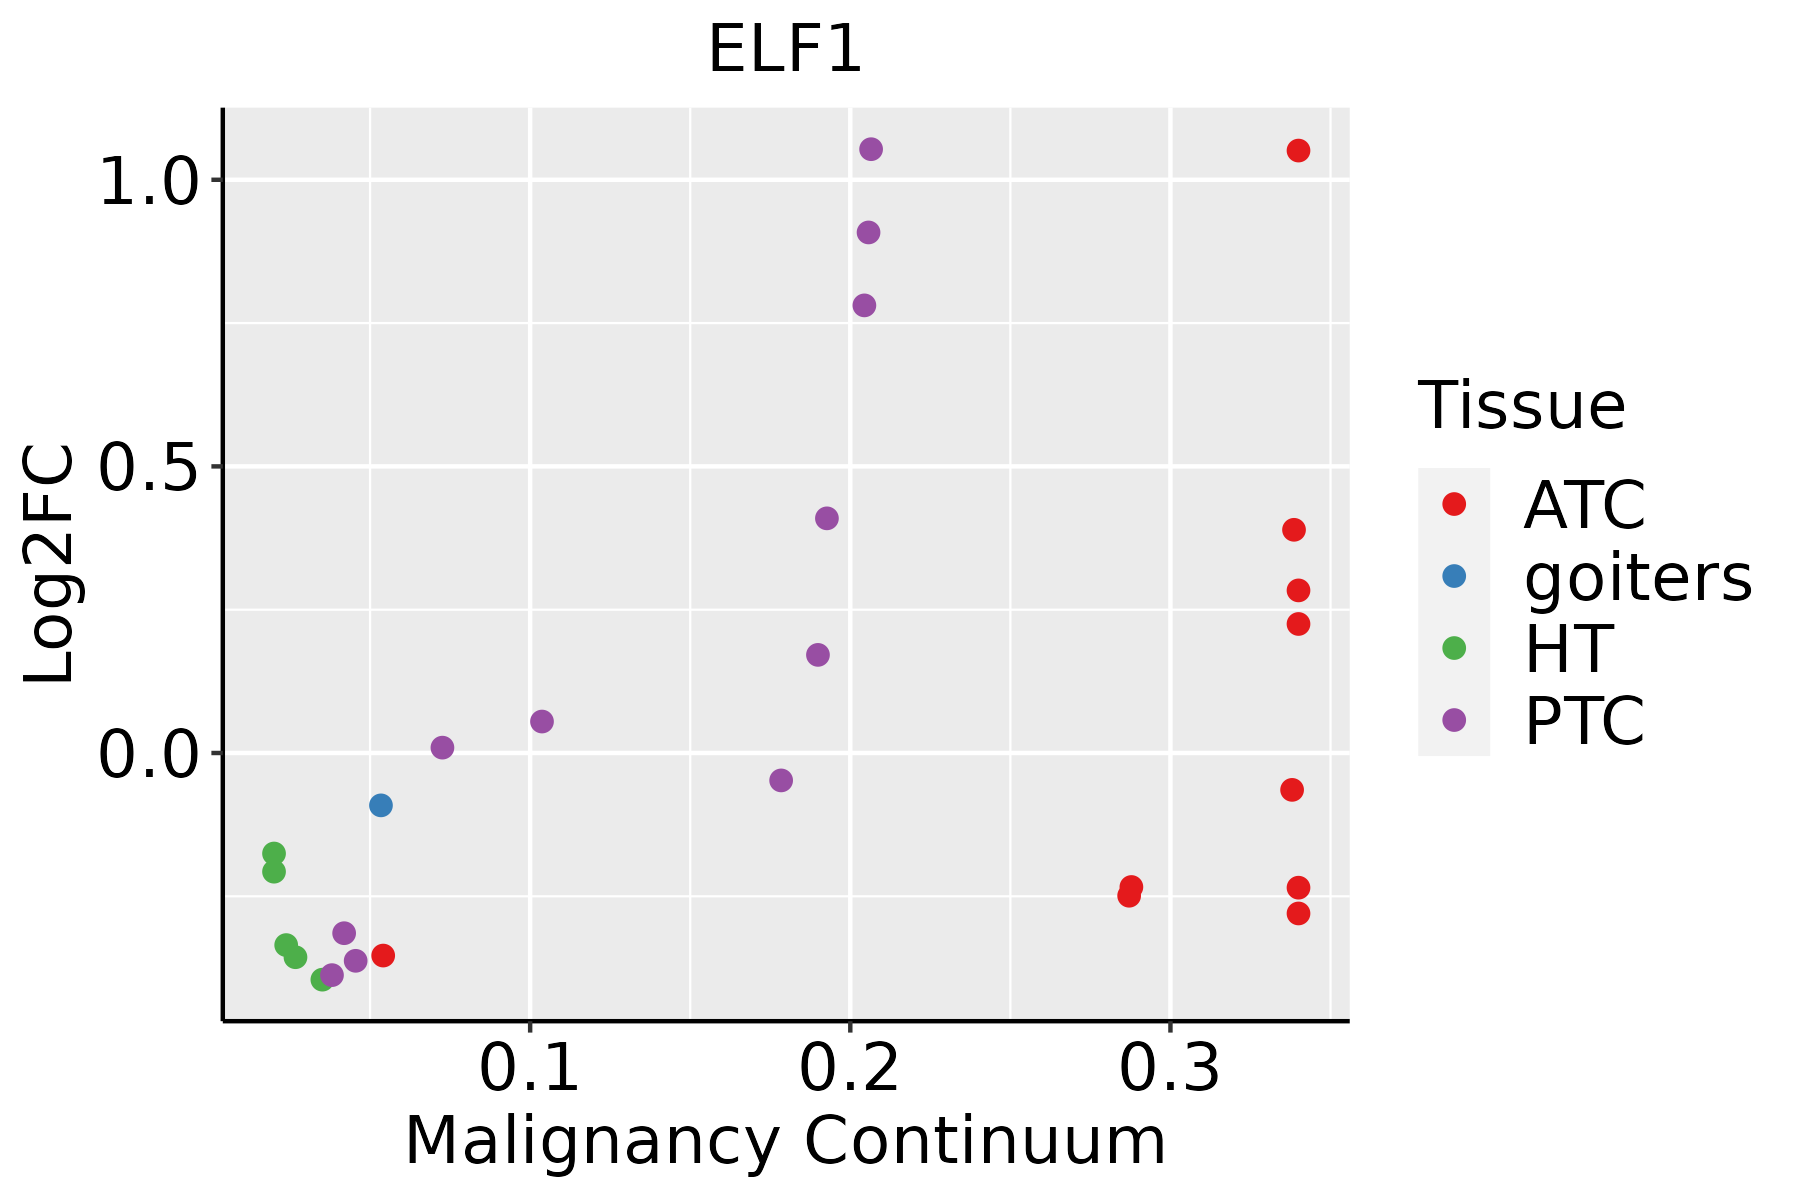
ATC: Anaplastic thyroid cancer
HT: Hashimoto's thyroiditis
PTC: Papillary thyroid cancer
∗log2FC in expression of this searched gene in stem-like cells from each diseased tissue sample relative to stem-like cells in normal samples in each tissue plotted against the malignancy continuum. Samples are colored based on if they are from different disease stage.

Top

Malignant transformation related pathway analysis

check buttonFind out the enriched GO biological processes and KEGG pathways involved in transition from healthy to precancer to cancer
check button Figure of enriched GO biological processes.
TissueDisease StageEnriched GO biological Processes
ColorectumADGO analysis - Figure of enriched GO biological processes: Top 15 enriched GO BP terms are showed in the bar plot of each disease state in each tissue. Each row represents a significant GO biological process which is colored according to the -log10(p.adjust).
ColorectumSERGO analysis - Figure of enriched GO biological processes: Top 15 enriched GO BP terms are showed in the bar plot of each disease state in each tissue. Each row represents a significant GO biological process which is colored according to the -log10(p.adjust).
ColorectumMSSGO analysis - Figure of enriched GO biological processes: Top 15 enriched GO BP terms are showed in the bar plot of each disease state in each tissue. Each row represents a significant GO biological process which is colored according to the -log10(p.adjust).
ColorectumMSI-HGO analysis - Figure of enriched GO biological processes: Top 15 enriched GO BP terms are showed in the bar plot of each disease state in each tissue. Each row represents a significant GO biological process which is colored according to the -log10(p.adjust).
ColorectumFAPGO analysis - Figure of enriched GO biological processes: Top 15 enriched GO BP terms are showed in the bar plot of each disease state in each tissue. Each row represents a significant GO biological process which is colored according to the -log10(p.adjust).
∗Top 15 enriched GO BP terms are showed in the bar plot of each disease state in each tissue. Each row represents a significant GO biological process which is colored according to the -log10(p.adjust).
Page: 1 2 3 4 5 6 7 8 9 

check button Enriched GO biological processes.
GO IDTissueDisease StageDescriptionGene RatioBg Ratiopvaluep.adjustCount
GO:000989610CervixCCpositive regulation of catabolic process109/2311492/187235.26e-106.99e-08109
GO:003133110CervixCCpositive regulation of cellular catabolic process91/2311427/187239.64e-085.25e-0691
GO:004348410CervixCCregulation of RNA splicing42/2311148/187231.25e-076.24e-0642
GO:00064029CervixCCmRNA catabolic process56/2311232/187234.81e-071.83e-0556
GO:19033119CervixCCregulation of mRNA metabolic process64/2311288/187231.71e-065.64e-0564
GO:00064019CervixCCRNA catabolic process62/2311278/187232.18e-066.56e-0562
GO:000641710CervixCCregulation of translation89/2311468/187231.86e-053.46e-0489
GO:002261310CervixCCribonucleoprotein complex biogenesis88/2311463/187232.11e-053.82e-0488
GO:004802410CervixCCregulation of mRNA splicing, via spliceosome28/2311101/187232.41e-054.19e-0428
GO:002261810CervixCCribonucleoprotein complex assembly49/2311220/187232.52e-054.29e-0449
GO:00507273CervixCCregulation of inflammatory response75/2311386/187233.95e-056.18e-0475
GO:007182610CervixCCribonucleoprotein complex subunit organization49/2311227/187235.91e-058.54e-0449
GO:00506849CervixCCregulation of mRNA processing33/2311137/187231.06e-041.35e-0333
GO:00610139CervixCCregulation of mRNA catabolic process38/2311166/187231.07e-041.36e-0338
GO:00459277CervixCCpositive regulation of growth53/2311259/187231.33e-041.64e-0353
GO:19033136CervixCCpositive regulation of mRNA metabolic process29/2311118/187231.86e-042.18e-0329
GO:00467008CervixCCheterocycle catabolic process80/2311445/187233.23e-043.42e-0380
GO:00346559CervixCCnucleobase-containing compound catabolic process74/2311407/187233.77e-043.88e-0374
GO:00434889CervixCCregulation of mRNA stability35/2311158/187233.80e-043.89e-0335
GO:00611576CervixCCmRNA destabilization22/231184/187234.18e-044.23e-0322
Page: 1 2 3 4 5 6 7 8 9 10 11 12 13 14 15 16 17 18 19 20 21 22 23 24 25 26 27 28 29 30 31 32 33 34 35 36 37 

check button Enriched KEGG pathways.
Pathway IDTissueDisease StageDescriptionGene RatioBg Ratiopvaluep.adjustqvalueCount
Page: 1 

Top

Cell-cell communication analysis

check buttonIdentification of potential cell-cell interactions between two cell types and their ligand-receptor pairs for different disease states
LigandReceptorLRpairPathwayTissueDisease Stage
Page: 1 

Top

Single-cell gene regulatory network inference analysis

check buttonFind out the significant the regulons (TFs) and the target genes of each regulon across cell types for different disease states
TFCell TypeTissueDisease StageTarget GeneRSSRegulon Activity
∗The dot plots of a searched regulon are shown for all cell subpopulations in each disease state of each tissue based on the regulon specific score inferred using pySCENIC and by calculating the average expression.
Page: 1 

Top

Somatic mutation of malignant transformation related genes

check buttonAnnotation of somatic variants for genes involved in malignant transformation
Hugo SymbolVariant ClassVariant ClassificationdbSNP RSHGVScHGVSpHGVSp ShortSWISSPROTBIOTYPESIFTPolyPhenTumor Sample BarcodeTissueHistologySexAgeStageTherapy TypesDrugsOutcome
ELF1SNVMissense_Mutationc.151N>Gp.Leu51Valp.L51VP32519protein_codingdeleterious(0)probably_damaging(0.998)TCGA-BH-A0B4-01Breastbreast invasive carcinomaMale>=65III/IVHormone TherapytamoxiphenSD
ELF1SNVMissense_Mutationc.1248N>Cp.Gln416Hisp.Q416HP32519protein_codingtolerated(0.36)possibly_damaging(0.759)TCGA-BH-A0DZ-01Breastbreast invasive carcinomaFemale<65I/IIChemotherapydocetaxelSD
ELF1SNVMissense_Mutationc.133N>Gp.Leu45Valp.L45VP32519protein_codingdeleterious(0.02)possibly_damaging(0.678)TCGA-BH-A0H5-01Breastbreast invasive carcinomaFemale<65I/IIChemotherapycytoxanCR
ELF1SNVMissense_Mutationnovelc.740N>Tp.Ser247Phep.S247FP32519protein_codingdeleterious(0)probably_damaging(0.999)TCGA-BH-A2L8-01Breastbreast invasive carcinomaFemale<65I/IIChemotherapycytoxanCR
ELF1SNVMissense_Mutationc.1685N>Gp.Thr562Argp.T562RP32519protein_codingdeleterious(0.04)benign(0.136)TCGA-D8-A1XQ-01Breastbreast invasive carcinomaFemale>=65I/IIUnknownUnknownSD
ELF1insertionFrame_Shift_Insnovelc.101_102insTp.Ile35AsnfsTer9p.I35Nfs*9P32519protein_codingTCGA-A8-A08L-01Breastbreast invasive carcinomaFemale>=65III/IVUnknownUnknownSD
ELF1SNVMissense_Mutationrs766946264c.1472C>Tp.Ala491Valp.A491VP32519protein_codingtolerated(0.34)benign(0.011)TCGA-2W-A8YY-01Cervixcervical & endocervical cancerFemale<65I/IIChemotherapycisplatinCR
ELF1SNVMissense_Mutationrs747465409c.371T>Cp.Ile124Thrp.I124TP32519protein_codingtolerated(0.05)benign(0.165)TCGA-2W-A8YY-01Cervixcervical & endocervical cancerFemale<65I/IIChemotherapycisplatinCR
ELF1SNVMissense_Mutationc.1397N>Gp.Phe466Cysp.F466CP32519protein_codingdeleterious(0)probably_damaging(0.998)TCGA-FU-A3HZ-01Cervixcervical & endocervical cancerFemale<65I/IIChemotherapycisplatinCR
ELF1SNVMissense_Mutationnovelc.700G>Ap.Glu234Lysp.E234KP32519protein_codingdeleterious(0)probably_damaging(0.962)TCGA-HM-A4S6-01Cervixcervical & endocervical cancerFemale<65III/IVChemotherapycisplatinCR
Page: 1 2 3 4 5 6 7 8 

Top

Related drugs of malignant transformation related genes

check buttonIdentification of chemicals and drugs interact with genes involved in malignant transfromation
(DGIdb 4.0)
Entrez IDSymbolCategoryInteraction TypesDrug Claim NameDrug NamePMIDs
Page: 1