
|
|||||
|
 | |
| |
| |
| |
| |
| |
|
Gene: ELAVL1 |
Gene summary for ELAVL1 |
| Gene information | Species | Human | Gene symbol | ELAVL1 | Gene ID | 1994 |
| Gene name | ELAV like RNA binding protein 1 | |
| Gene Alias | ELAV1 | |
| Cytomap | 19p13.2 | |
| Gene Type | protein-coding | GO ID | GO:0006139 | UniProtAcc | Q15717 |
Top |
Malignant transformation analysis |
| Identification of the aberrant gene expression in precancerous and cancerous lesions by comparing the gene expression of stem-like cells in diseased tissues with normal stem cells |
| Entrez ID | Symbol | Replicates | Species | Organ | Tissue | Adj P-value | Log2FC | Malignancy |
| 1994 | ELAVL1 | HTA11_1938_2000001011 | Human | Colorectum | AD | 7.39e-05 | 5.30e-01 | -0.0811 |
| 1994 | ELAVL1 | HTA11_347_2000001011 | Human | Colorectum | AD | 2.41e-02 | 3.25e-01 | -0.1954 |
| 1994 | ELAVL1 | HTA11_1391_2000001011 | Human | Colorectum | AD | 3.43e-04 | 4.69e-01 | -0.059 |
| 1994 | ELAVL1 | HTA11_6801_2000001011 | Human | Colorectum | SER | 2.91e-07 | 9.43e-01 | 0.0171 |
| 1994 | ELAVL1 | HTA11_7696_3000711011 | Human | Colorectum | AD | 1.39e-08 | 5.32e-01 | 0.0674 |
| 1994 | ELAVL1 | HTA11_99999970781_79442 | Human | Colorectum | MSS | 3.03e-06 | 5.38e-01 | 0.294 |
| 1994 | ELAVL1 | HTA11_99999971662_82457 | Human | Colorectum | MSS | 9.91e-07 | 5.78e-01 | 0.3859 |
| 1994 | ELAVL1 | A015-C-203 | Human | Colorectum | FAP | 4.24e-05 | -1.33e-01 | -0.1294 |
| 1994 | ELAVL1 | A001-C-108 | Human | Colorectum | FAP | 2.28e-03 | -1.34e-01 | -0.0272 |
| 1994 | ELAVL1 | A002-C-205 | Human | Colorectum | FAP | 9.94e-05 | -1.28e-01 | -0.1236 |
| 1994 | ELAVL1 | A015-C-006 | Human | Colorectum | FAP | 1.90e-02 | -1.40e-01 | -0.0994 |
| 1994 | ELAVL1 | A002-C-114 | Human | Colorectum | FAP | 2.76e-03 | -1.49e-01 | -0.1561 |
| 1994 | ELAVL1 | A015-C-104 | Human | Colorectum | FAP | 6.43e-06 | -1.43e-01 | -0.1899 |
| 1994 | ELAVL1 | A001-C-014 | Human | Colorectum | FAP | 9.15e-03 | -1.12e-01 | 0.0135 |
| 1994 | ELAVL1 | A002-C-016 | Human | Colorectum | FAP | 9.55e-03 | -9.73e-02 | 0.0521 |
| 1994 | ELAVL1 | A002-C-116 | Human | Colorectum | FAP | 7.72e-08 | -1.89e-01 | -0.0452 |
| 1994 | ELAVL1 | A018-E-020 | Human | Colorectum | FAP | 1.89e-04 | -1.69e-01 | -0.2034 |
| 1994 | ELAVL1 | F034 | Human | Colorectum | FAP | 2.38e-02 | -1.32e-01 | -0.0665 |
| 1994 | ELAVL1 | LZE4T | Human | Esophagus | ESCC | 2.25e-03 | 4.28e-02 | 0.0811 |
| 1994 | ELAVL1 | LZE5T | Human | Esophagus | ESCC | 1.90e-04 | 2.65e-01 | 0.0514 |
| Page: 1 2 3 4 5 6 7 |
| Tissue | Expression Dynamics | Abbreviation |
| Colorectum (GSE201348) |  | FAP: Familial adenomatous polyposis |
| CRC: Colorectal cancer | ||
| Colorectum (HTA11) |  | AD: Adenomas |
| SER: Sessile serrated lesions | ||
| MSI-H: Microsatellite-high colorectal cancer | ||
| MSS: Microsatellite stable colorectal cancer | ||
| Esophagus | 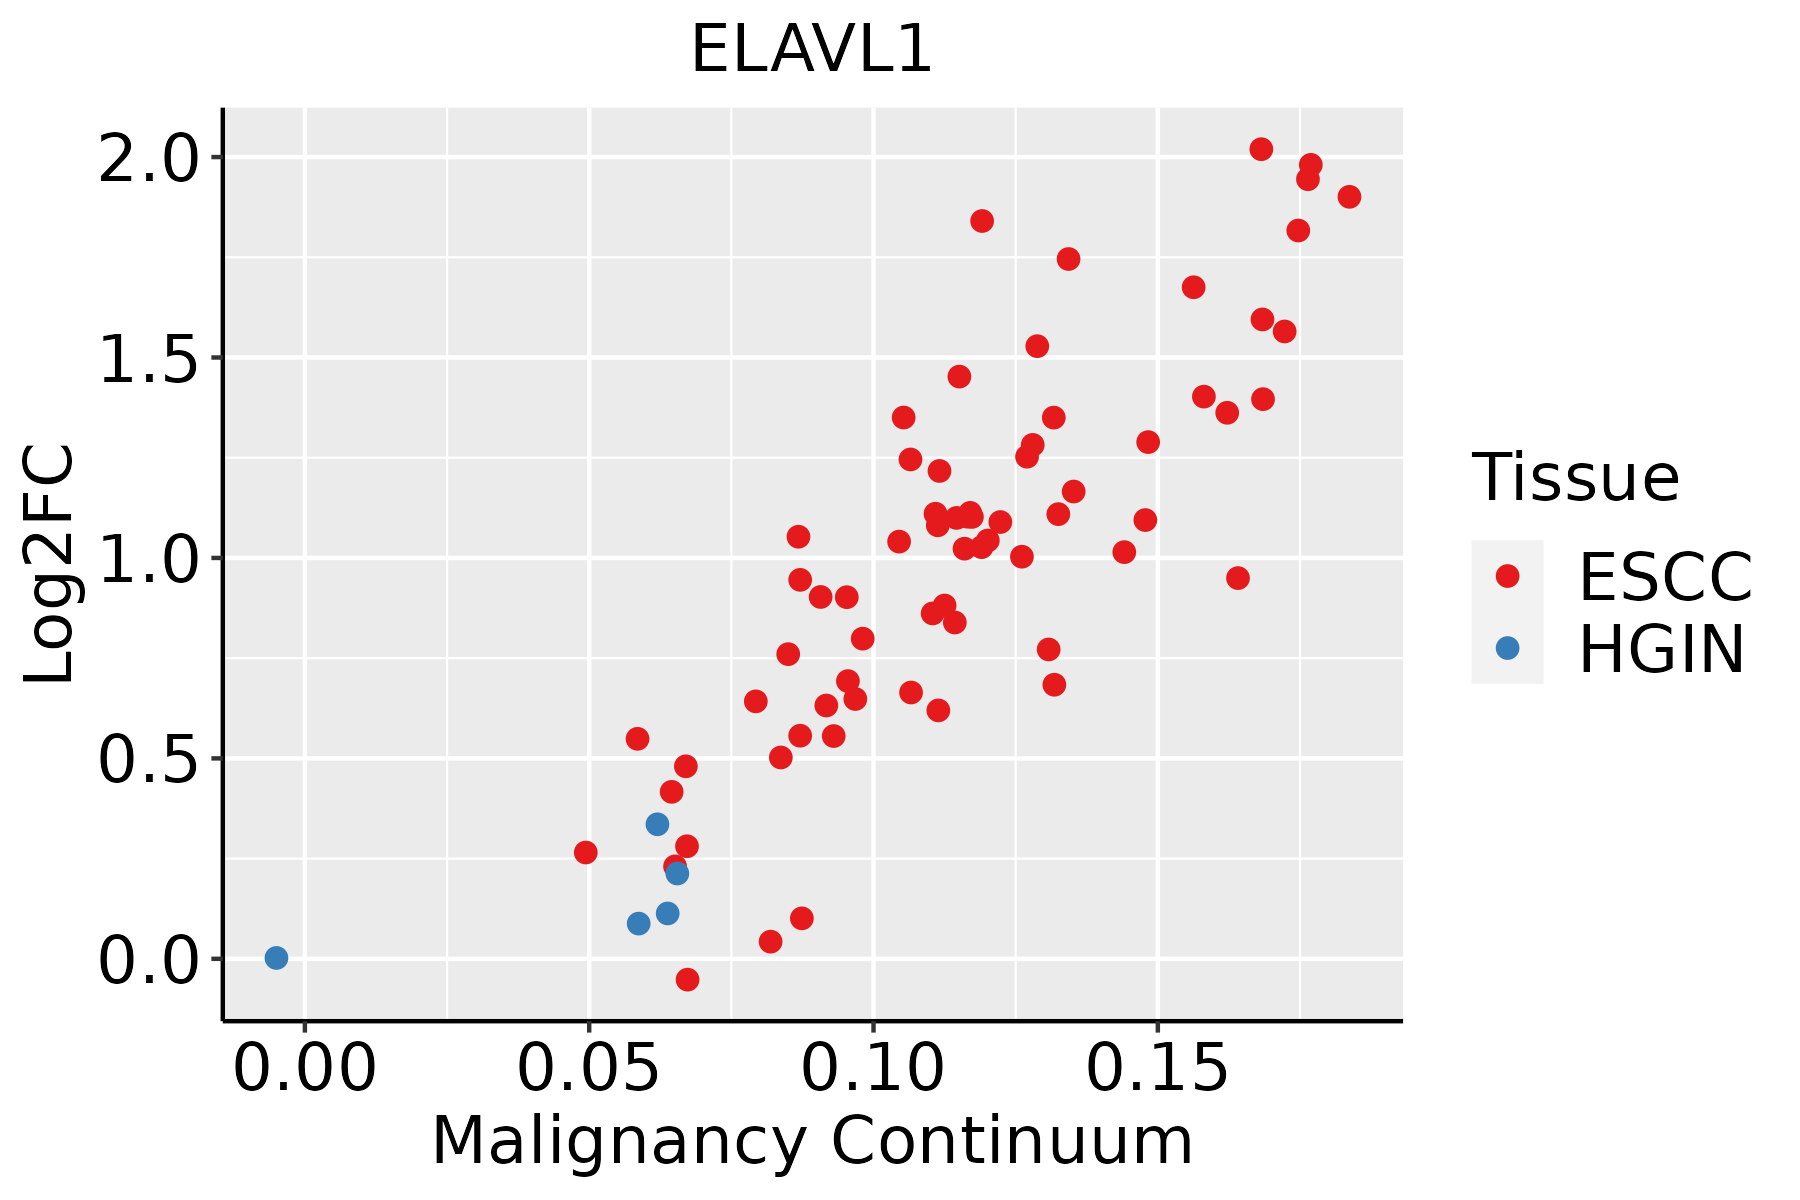 | ESCC: Esophageal squamous cell carcinoma |
| HGIN: High-grade intraepithelial neoplasias | ||
| LGIN: Low-grade intraepithelial neoplasias | ||
| Liver |  | HCC: Hepatocellular carcinoma |
| NAFLD: Non-alcoholic fatty liver disease | ||
| Oral Cavity |  | EOLP: Erosive Oral lichen planus |
| LP: leukoplakia | ||
| NEOLP: Non-erosive oral lichen planus | ||
| OSCC: Oral squamous cell carcinoma | ||
| Skin | 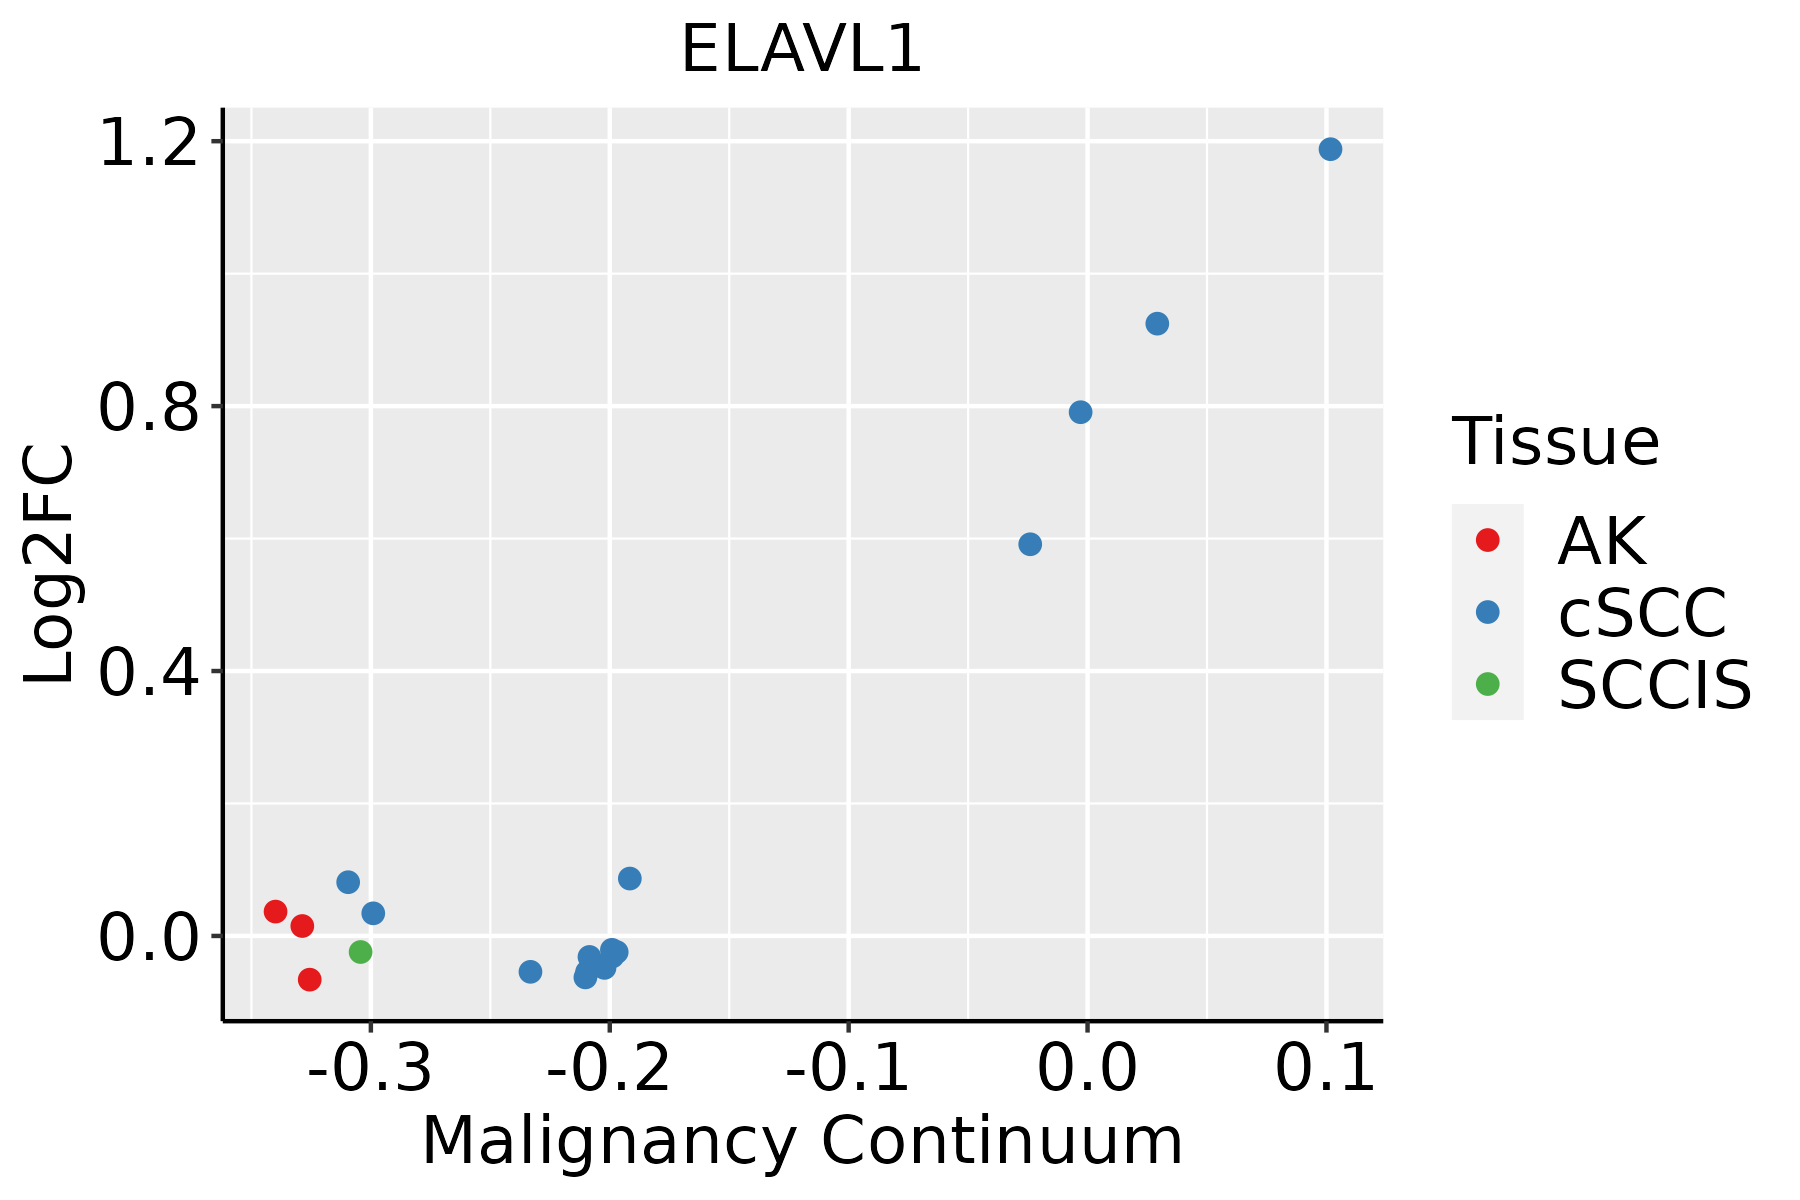 | AK: Actinic keratosis |
| cSCC: Cutaneous squamous cell carcinoma | ||
| SCCIS:squamous cell carcinoma in situ | ||
| Thyroid |  | ATC: Anaplastic thyroid cancer |
| HT: Hashimoto's thyroiditis | ||
| PTC: Papillary thyroid cancer |
| ∗log2FC in expression of this searched gene in stem-like cells from each diseased tissue sample relative to stem-like cells in normal samples in each tissue plotted against the malignancy continuum. Samples are colored based on if they are from different disease stage. |
Top |
Malignant transformation related pathway analysis |
| Find out the enriched GO biological processes and KEGG pathways involved in transition from healthy to precancer to cancer |
| Tissue | Disease Stage | Enriched GO biological Processes |
| Colorectum | AD |  |
| Colorectum | SER |  |
| Colorectum | MSS |  |
| Colorectum | MSI-H |  |
| Colorectum | FAP |  |
| ∗Top 15 enriched GO BP terms are showed in the bar plot of each disease state in each tissue. Each row represents a significant GO biological process which is colored according to the -log10(p.adjust). |
| Page: 1 2 3 4 5 6 7 8 9 |
| GO ID | Tissue | Disease Stage | Description | Gene Ratio | Bg Ratio | pvalue | p.adjust | Count |
| GO:1903311 | Colorectum | AD | regulation of mRNA metabolic process | 117/3918 | 288/18723 | 1.69e-14 | 4.23e-12 | 117 |
| GO:0009895 | Colorectum | AD | negative regulation of catabolic process | 124/3918 | 320/18723 | 1.66e-13 | 3.35e-11 | 124 |
| GO:0031330 | Colorectum | AD | negative regulation of cellular catabolic process | 104/3918 | 262/18723 | 2.66e-12 | 3.96e-10 | 104 |
| GO:0072594 | Colorectum | AD | establishment of protein localization to organelle | 148/3918 | 422/18723 | 7.95e-12 | 1.04e-09 | 148 |
| GO:0006401 | Colorectum | AD | RNA catabolic process | 102/3918 | 278/18723 | 8.64e-10 | 6.76e-08 | 102 |
| GO:0044270 | Colorectum | AD | cellular nitrogen compound catabolic process | 147/3918 | 451/18723 | 3.35e-09 | 2.23e-07 | 147 |
| GO:0046700 | Colorectum | AD | heterocycle catabolic process | 145/3918 | 445/18723 | 4.37e-09 | 2.84e-07 | 145 |
| GO:0006402 | Colorectum | AD | mRNA catabolic process | 87/3918 | 232/18723 | 4.40e-09 | 2.84e-07 | 87 |
| GO:0034655 | Colorectum | AD | nucleobase-containing compound catabolic process | 133/3918 | 407/18723 | 1.56e-08 | 9.12e-07 | 133 |
| GO:0019439 | Colorectum | AD | aromatic compound catabolic process | 146/3918 | 467/18723 | 7.48e-08 | 3.84e-06 | 146 |
| GO:1901361 | Colorectum | AD | organic cyclic compound catabolic process | 153/3918 | 495/18723 | 8.23e-08 | 4.18e-06 | 153 |
| GO:0006913 | Colorectum | AD | nucleocytoplasmic transport | 102/3918 | 301/18723 | 1.00e-07 | 4.85e-06 | 102 |
| GO:0051169 | Colorectum | AD | nuclear transport | 102/3918 | 301/18723 | 1.00e-07 | 4.85e-06 | 102 |
| GO:0061013 | Colorectum | AD | regulation of mRNA catabolic process | 64/3918 | 166/18723 | 1.44e-07 | 6.59e-06 | 64 |
| GO:0043487 | Colorectum | AD | regulation of RNA stability | 63/3918 | 170/18723 | 9.17e-07 | 3.12e-05 | 63 |
| GO:0006417 | Colorectum | AD | regulation of translation | 141/3918 | 468/18723 | 1.32e-06 | 4.22e-05 | 141 |
| GO:0043488 | Colorectum | AD | regulation of mRNA stability | 59/3918 | 158/18723 | 1.50e-06 | 4.66e-05 | 59 |
| GO:0034504 | Colorectum | AD | protein localization to nucleus | 94/3918 | 290/18723 | 2.83e-06 | 8.09e-05 | 94 |
| GO:1903312 | Colorectum | AD | negative regulation of mRNA metabolic process | 37/3918 | 92/18723 | 1.95e-05 | 4.01e-04 | 37 |
| GO:0017038 | Colorectum | AD | protein import | 67/3918 | 206/18723 | 6.34e-05 | 1.05e-03 | 67 |
| Page: 1 2 3 4 5 6 7 8 9 10 11 12 13 14 15 16 17 18 19 |
| Pathway ID | Tissue | Disease Stage | Description | Gene Ratio | Bg Ratio | pvalue | p.adjust | qvalue | Count |
| hsa04152 | Colorectum | AD | AMPK signaling pathway | 47/2092 | 121/8465 | 3.74e-04 | 2.82e-03 | 1.80e-03 | 47 |
| hsa041521 | Colorectum | AD | AMPK signaling pathway | 47/2092 | 121/8465 | 3.74e-04 | 2.82e-03 | 1.80e-03 | 47 |
| hsa041522 | Colorectum | MSS | AMPK signaling pathway | 41/1875 | 121/8465 | 1.91e-03 | 9.83e-03 | 6.03e-03 | 41 |
| hsa041523 | Colorectum | MSS | AMPK signaling pathway | 41/1875 | 121/8465 | 1.91e-03 | 9.83e-03 | 6.03e-03 | 41 |
| hsa041524 | Colorectum | FAP | AMPK signaling pathway | 37/1404 | 121/8465 | 8.97e-05 | 8.56e-04 | 5.21e-04 | 37 |
| hsa041525 | Colorectum | FAP | AMPK signaling pathway | 37/1404 | 121/8465 | 8.97e-05 | 8.56e-04 | 5.21e-04 | 37 |
| hsa0465727 | Esophagus | ESCC | IL-17 signaling pathway | 66/4205 | 94/8465 | 3.93e-05 | 1.75e-04 | 8.99e-05 | 66 |
| hsa0415210 | Esophagus | ESCC | AMPK signaling pathway | 80/4205 | 121/8465 | 1.73e-04 | 6.67e-04 | 3.42e-04 | 80 |
| hsa0465734 | Esophagus | ESCC | IL-17 signaling pathway | 66/4205 | 94/8465 | 3.93e-05 | 1.75e-04 | 8.99e-05 | 66 |
| hsa0415213 | Esophagus | ESCC | AMPK signaling pathway | 80/4205 | 121/8465 | 1.73e-04 | 6.67e-04 | 3.42e-04 | 80 |
| hsa0415221 | Liver | Cirrhotic | AMPK signaling pathway | 49/2530 | 121/8465 | 7.90e-03 | 2.74e-02 | 1.69e-02 | 49 |
| hsa0415231 | Liver | Cirrhotic | AMPK signaling pathway | 49/2530 | 121/8465 | 7.90e-03 | 2.74e-02 | 1.69e-02 | 49 |
| hsa0415241 | Liver | HCC | AMPK signaling pathway | 77/4020 | 121/8465 | 2.32e-04 | 1.11e-03 | 6.18e-04 | 77 |
| hsa0415251 | Liver | HCC | AMPK signaling pathway | 77/4020 | 121/8465 | 2.32e-04 | 1.11e-03 | 6.18e-04 | 77 |
| hsa0465724 | Oral cavity | OSCC | IL-17 signaling pathway | 64/3704 | 94/8465 | 1.48e-06 | 7.87e-06 | 4.01e-06 | 64 |
| hsa041529 | Oral cavity | OSCC | AMPK signaling pathway | 71/3704 | 121/8465 | 6.29e-04 | 1.86e-03 | 9.49e-04 | 71 |
| hsa04657112 | Oral cavity | OSCC | IL-17 signaling pathway | 64/3704 | 94/8465 | 1.48e-06 | 7.87e-06 | 4.01e-06 | 64 |
| hsa0415212 | Oral cavity | OSCC | AMPK signaling pathway | 71/3704 | 121/8465 | 6.29e-04 | 1.86e-03 | 9.49e-04 | 71 |
| hsa0465725 | Oral cavity | LP | IL-17 signaling pathway | 47/2418 | 94/8465 | 8.45e-06 | 6.25e-05 | 4.03e-05 | 47 |
| hsa0465733 | Oral cavity | LP | IL-17 signaling pathway | 47/2418 | 94/8465 | 8.45e-06 | 6.25e-05 | 4.03e-05 | 47 |
| Page: 1 |
Top |
Cell-cell communication analysis |
| Identification of potential cell-cell interactions between two cell types and their ligand-receptor pairs for different disease states |
| Ligand | Receptor | LRpair | Pathway | Tissue | Disease Stage |
| Page: 1 |
Top |
Single-cell gene regulatory network inference analysis |
| Find out the significant the regulons (TFs) and the target genes of each regulon across cell types for different disease states |
| TF | Cell Type | Tissue | Disease Stage | Target Gene | RSS | Regulon Activity |
| ∗The dot plots of a searched regulon are shown for all cell subpopulations in each disease state of each tissue based on the regulon specific score inferred using pySCENIC and by calculating the average expression. |
| Page: 1 |
Top |
Somatic mutation of malignant transformation related genes |
| Annotation of somatic variants for genes involved in malignant transformation |
| Hugo Symbol | Variant Class | Variant Classification | dbSNP RS | HGVSc | HGVSp | HGVSp Short | SWISSPROT | BIOTYPE | SIFT | PolyPhen | Tumor Sample Barcode | Tissue | Histology | Sex | Age | Stage | Therapy Types | Drugs | Outcome |
| ELAVL1 | SNV | Missense_Mutation | novel | c.367G>C | p.Glu123Gln | p.E123Q | Q15717 | protein_coding | tolerated(0.11) | possibly_damaging(0.69) | TCGA-A2-A0EP-01 | Breast | breast invasive carcinoma | Female | <65 | I/II | Chemotherapy | cyclophosphamide | CR |
| ELAVL1 | SNV | Missense_Mutation | c.227N>C | p.Arg76Thr | p.R76T | Q15717 | protein_coding | deleterious(0) | possibly_damaging(0.491) | TCGA-AC-A23H-01 | Breast | breast invasive carcinoma | Female | >=65 | I/II | Unknown | Unknown | PD | |
| ELAVL1 | SNV | Missense_Mutation | novel | c.64N>G | p.Leu22Val | p.L22V | Q15717 | protein_coding | deleterious(0) | probably_damaging(0.996) | TCGA-AN-A046-01 | Breast | breast invasive carcinoma | Female | >=65 | I/II | Unknown | Unknown | SD |
| ELAVL1 | SNV | Missense_Mutation | rs756868982 | c.644C>T | p.Ala215Val | p.A215V | Q15717 | protein_coding | tolerated(0.19) | benign(0.009) | TCGA-AN-A0FK-01 | Breast | breast invasive carcinoma | Female | >=65 | III/IV | Unknown | Unknown | SD |
| ELAVL1 | SNV | Missense_Mutation | rs368659692 | c.31G>A | p.Glu11Lys | p.E11K | Q15717 | protein_coding | tolerated(0.38) | benign(0.014) | TCGA-BH-A0HW-01 | Breast | breast invasive carcinoma | Female | <65 | I/II | Chemotherapy | doxorubicin | SD |
| ELAVL1 | insertion | Nonsense_Mutation | novel | c.720_721insAATTTTCACAAGTGTTTGTCTTTGTCTGAATGAGAAGTGAGAAG | p.Ser241AsnfsTer11 | p.S241Nfs*11 | Q15717 | protein_coding | TCGA-B6-A0RE-01 | Breast | breast invasive carcinoma | Female | <65 | I/II | Unknown | Unknown | SD | ||
| ELAVL1 | SNV | Missense_Mutation | novel | c.118N>C | p.Phe40Leu | p.F40L | Q15717 | protein_coding | deleterious(0.01) | probably_damaging(0.997) | TCGA-2W-A8YY-01 | Cervix | cervical & endocervical cancer | Female | <65 | I/II | Chemotherapy | cisplatin | CR |
| ELAVL1 | SNV | Missense_Mutation | c.803G>C | p.Gly268Ala | p.G268A | Q15717 | protein_coding | deleterious(0.02) | possibly_damaging(0.873) | TCGA-Q1-A73O-01 | Cervix | cervical & endocervical cancer | Female | <65 | I/II | Chemotherapy | cisplatin | CR | |
| ELAVL1 | SNV | Missense_Mutation | c.427N>G | p.Thr143Ala | p.T143A | Q15717 | protein_coding | tolerated(0.05) | benign(0.127) | TCGA-A6-2686-01 | Colorectum | colon adenocarcinoma | Female | >=65 | I/II | Unknown | Unknown | SD | |
| ELAVL1 | SNV | Missense_Mutation | c.230N>T | p.Ala77Val | p.A77V | Q15717 | protein_coding | deleterious(0) | possibly_damaging(0.499) | TCGA-AA-3715-01 | Colorectum | colon adenocarcinoma | Male | >=65 | I/II | Unknown | Unknown | PD |
| Page: 1 2 3 4 5 6 7 |
Top |
Related drugs of malignant transformation related genes |
| Identification of chemicals and drugs interact with genes involved in malignant transfromation |
| (DGIdb 4.0) |
| Entrez ID | Symbol | Category | Interaction Types | Drug Claim Name | Drug Name | PMIDs |
| 1994 | ELAVL1 | DRUGGABLE GENOME | DEHYDROMUTACTIN | DEHYDROMUTACTIN | 17632515 | |
| 1994 | ELAVL1 | DRUGGABLE GENOME | DHT | ANDROSTANOLONE | 11356683 |
| Page: 1 |

Copyright 2023-Present -The University of Texas Health Science Center at Houston |