Schematic overview of the cellular and molecular mechanisms involved in the cancer progression, including the proposed cellular and molecular mechanisms in cancer cells trajectory. AT1: alveolar type 1 cells; AT2: alveolar type 2 cells; AAH: atypical adenomatous hyperplasia; AIS: adenocarcinoma in situ; MIA: minimally invasive adenocarcinoma; IA: invasive adenocarcinoma; EMT: epithelial-mesenchymal transition

Home

Download

Statistics

Help

Contact

Center for Computational Systems Medicine
leaf

Gene summary

leaf

Malignant transformation analysis

leaf

Malignant transformation related pathway analysis

leaf

Cell-cell communication analysis

leaf

Single-cell gene regulatory network inference analysis

leaf

Somatic mutation of malignant transformation related genes

leaf

Related drugs of malignant transformation related genes

Gene: ELAC2

Gene summary for ELAC2

check button Gene summary.

Gene informationSpeciesHuman
Gene symbol

ELAC2

Gene ID

60528

Gene nameelaC ribonuclease Z 2
Gene AliasCOXPD17
Cytomap17p12
Gene Typeprotein-coding
GO ID

GO:0000959

UniProtAcc

Q9BQ52


Top

Malignant transformation analysis

check button Identification of the aberrant gene expression in precancerous and cancerous lesions by comparing the gene expression of stem-like cells in diseased tissues with normal stem cells
check button Malignant transformation involving gene list.
Entrez IDSymbolReplicatesSpeciesOrganTissueAdj P-valueLog2FCMalignancy
60528ELAC2LZE7THumanEsophagusESCC9.63e-145.20e-010.0667
60528ELAC2LZE22THumanEsophagusESCC1.88e-032.77e-010.068
60528ELAC2LZE24THumanEsophagusESCC3.52e-163.70e-010.0596
60528ELAC2P2T-EHumanEsophagusESCC2.35e-193.14e-010.1177
60528ELAC2P4T-EHumanEsophagusESCC1.55e-164.79e-010.1323
60528ELAC2P5T-EHumanEsophagusESCC1.49e-129.59e-020.1327
60528ELAC2P8T-EHumanEsophagusESCC3.35e-173.54e-010.0889
60528ELAC2P9T-EHumanEsophagusESCC6.45e-061.68e-010.1131
60528ELAC2P10T-EHumanEsophagusESCC2.26e-232.86e-010.116
60528ELAC2P11T-EHumanEsophagusESCC2.61e-052.77e-010.1426
60528ELAC2P12T-EHumanEsophagusESCC1.26e-244.28e-010.1122
60528ELAC2P15T-EHumanEsophagusESCC1.83e-131.61e-010.1149
60528ELAC2P16T-EHumanEsophagusESCC1.69e-223.73e-010.1153
60528ELAC2P17T-EHumanEsophagusESCC2.24e-073.57e-010.1278
60528ELAC2P19T-EHumanEsophagusESCC1.72e-058.14e-010.1662
60528ELAC2P20T-EHumanEsophagusESCC2.33e-102.50e-010.1124
60528ELAC2P21T-EHumanEsophagusESCC1.52e-275.56e-010.1617
60528ELAC2P22T-EHumanEsophagusESCC2.94e-173.32e-010.1236
60528ELAC2P23T-EHumanEsophagusESCC2.01e-245.93e-010.108
60528ELAC2P24T-EHumanEsophagusESCC1.33e-325.52e-010.1287
Page: 1 2 3 4 5 

check button Transcriptomic changes along malignancy continuum.
TissueExpression DynamicsAbbreviation
EsophagusThe image shows the transcriptomic changes along malignancy continuum.log2FC in expression of this searched gene in stem-like cells from each diseased tissue sample relative to stem-like cells in normal samples in each tissue plotted against the malignancy continuum. Samples are colored based on if they are from different disease stage.
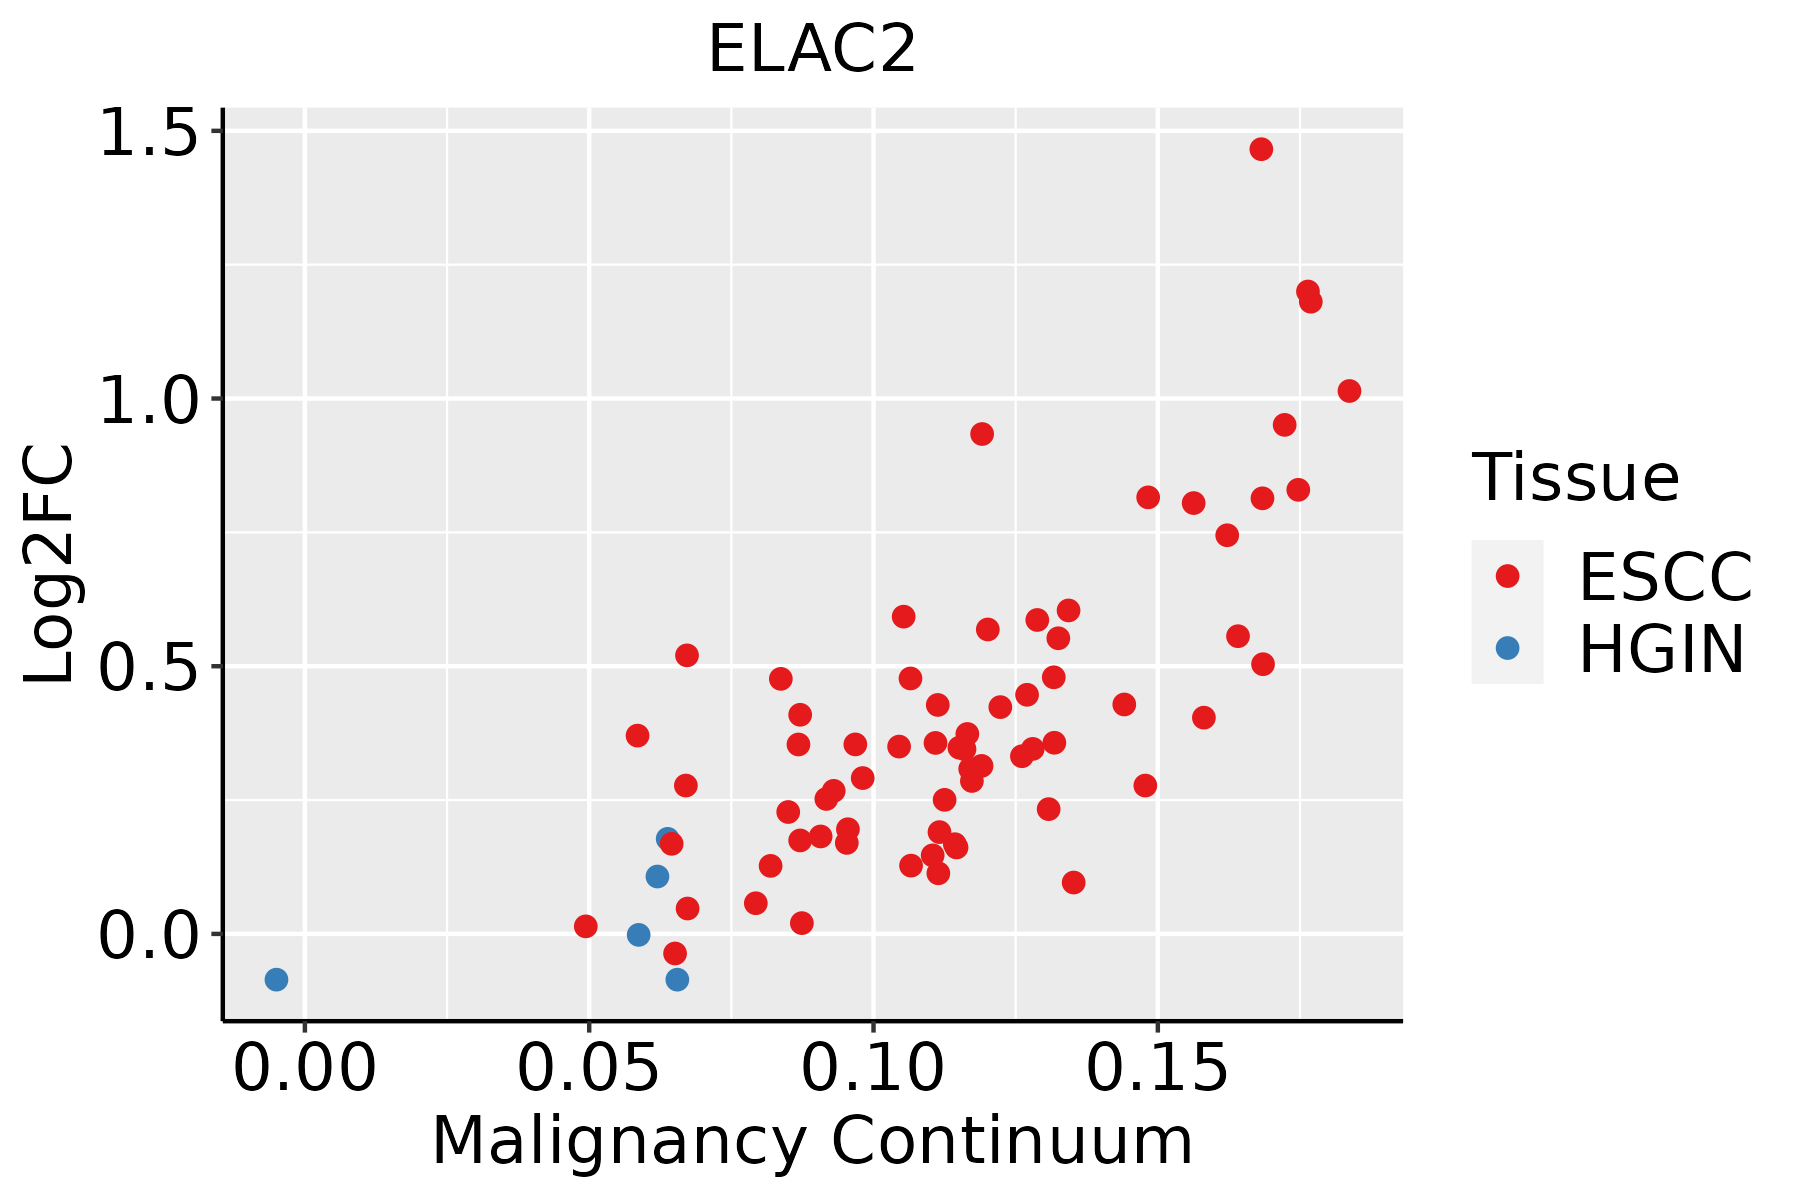
ESCC: Esophageal squamous cell carcinoma
HGIN: High-grade intraepithelial neoplasias
LGIN: Low-grade intraepithelial neoplasias
LiverThe image shows the transcriptomic changes along malignancy continuum.log2FC in expression of this searched gene in stem-like cells from each diseased tissue sample relative to stem-like cells in normal samples in each tissue plotted against the malignancy continuum. Samples are colored based on if they are from different disease stage.HCC: Hepatocellular carcinoma
NAFLD: Non-alcoholic fatty liver disease
Oral CavityThe image shows the transcriptomic changes along malignancy continuum.log2FC in expression of this searched gene in stem-like cells from each diseased tissue sample relative to stem-like cells in normal samples in each tissue plotted against the malignancy continuum. Samples are colored based on if they are from different disease stage.
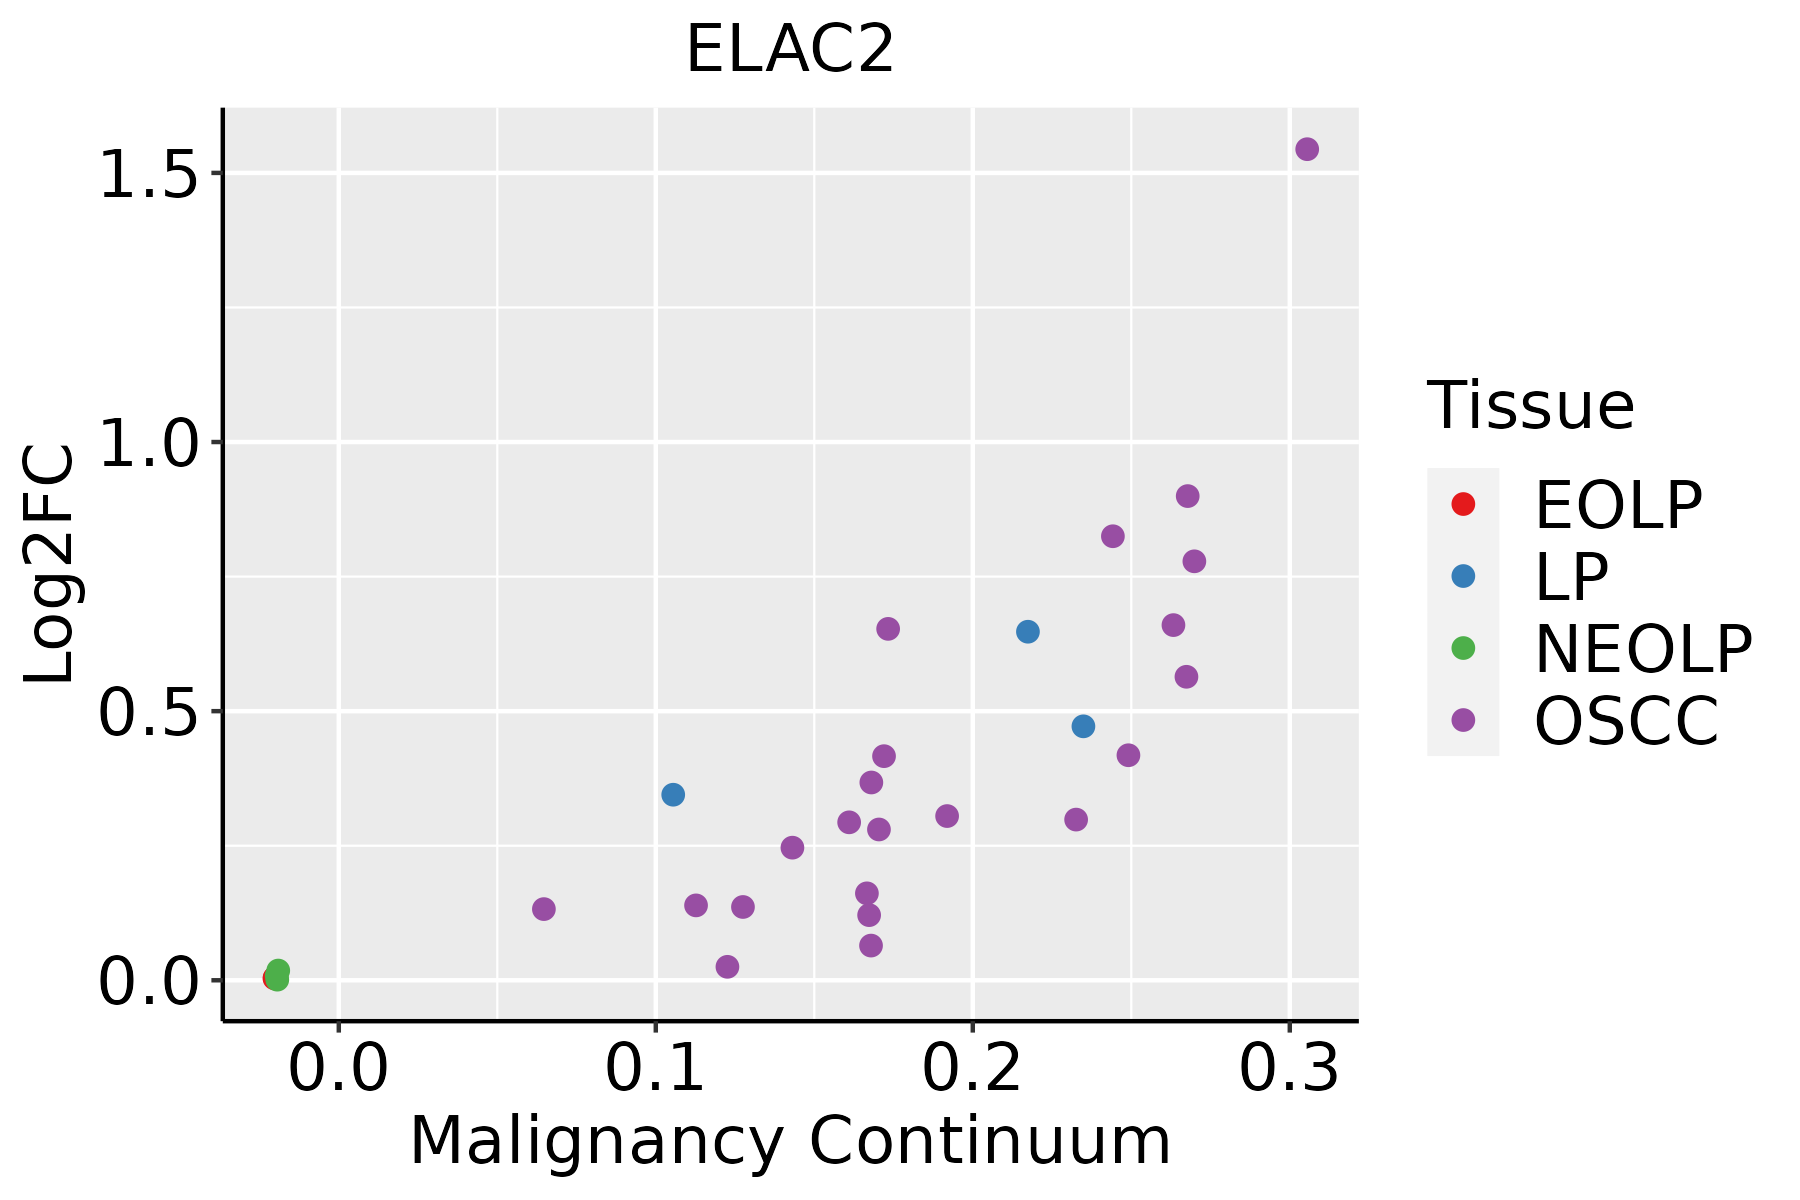
EOLP: Erosive Oral lichen planus
LP: leukoplakia
NEOLP: Non-erosive oral lichen planus
OSCC: Oral squamous cell carcinoma
SkinThe image shows the transcriptomic changes along malignancy continuum.log2FC in expression of this searched gene in stem-like cells from each diseased tissue sample relative to stem-like cells in normal samples in each tissue plotted against the malignancy continuum. Samples are colored based on if they are from different disease stage.
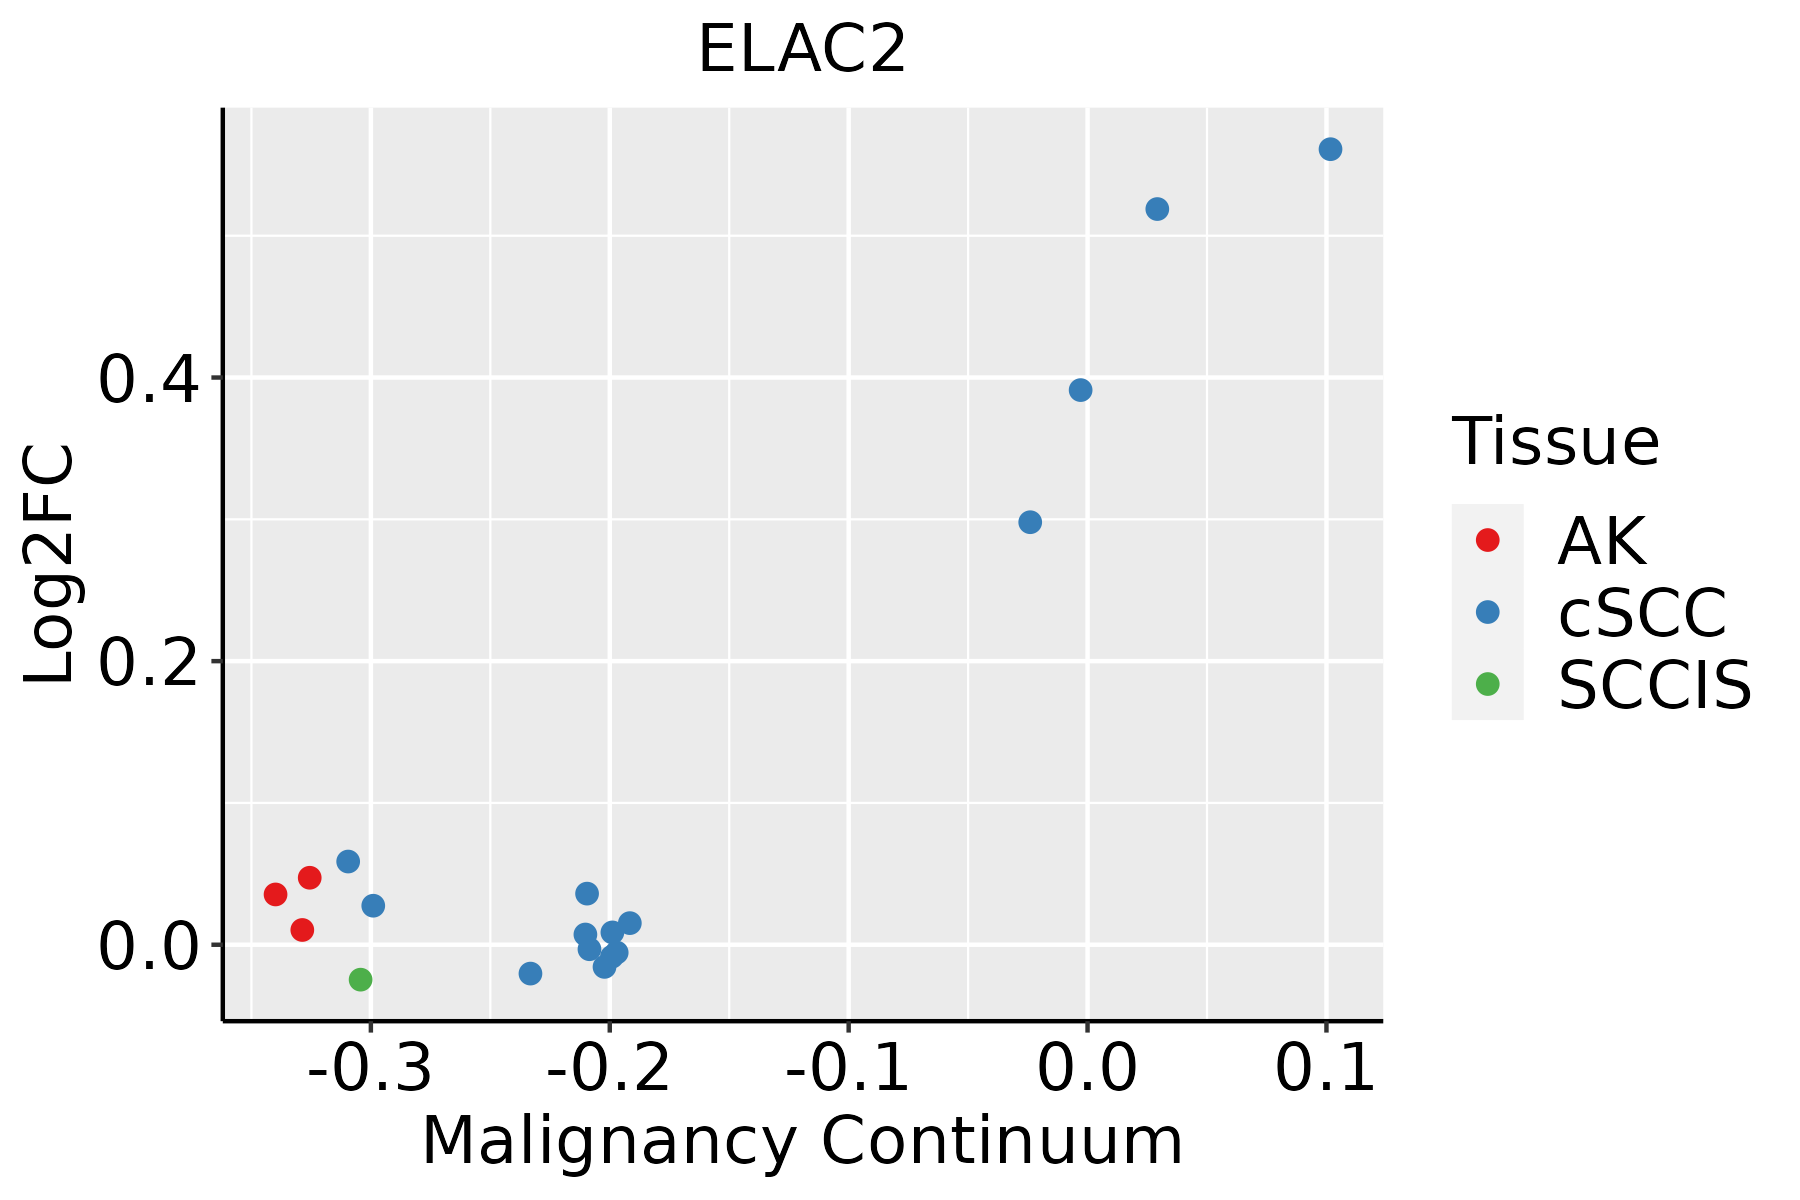
AK: Actinic keratosis
cSCC: Cutaneous squamous cell carcinoma
SCCIS:squamous cell carcinoma in situ
∗log2FC in expression of this searched gene in stem-like cells from each diseased tissue sample relative to stem-like cells in normal samples in each tissue plotted against the malignancy continuum. Samples are colored based on if they are from different disease stage.

Top

Malignant transformation related pathway analysis

check buttonFind out the enriched GO biological processes and KEGG pathways involved in transition from healthy to precancer to cancer
check button Figure of enriched GO biological processes.
TissueDisease StageEnriched GO biological Processes
ColorectumADGO analysis - Figure of enriched GO biological processes: Top 15 enriched GO BP terms are showed in the bar plot of each disease state in each tissue. Each row represents a significant GO biological process which is colored according to the -log10(p.adjust).
ColorectumSERGO analysis - Figure of enriched GO biological processes: Top 15 enriched GO BP terms are showed in the bar plot of each disease state in each tissue. Each row represents a significant GO biological process which is colored according to the -log10(p.adjust).
ColorectumMSSGO analysis - Figure of enriched GO biological processes: Top 15 enriched GO BP terms are showed in the bar plot of each disease state in each tissue. Each row represents a significant GO biological process which is colored according to the -log10(p.adjust).
ColorectumMSI-HGO analysis - Figure of enriched GO biological processes: Top 15 enriched GO BP terms are showed in the bar plot of each disease state in each tissue. Each row represents a significant GO biological process which is colored according to the -log10(p.adjust).
ColorectumFAPGO analysis - Figure of enriched GO biological processes: Top 15 enriched GO BP terms are showed in the bar plot of each disease state in each tissue. Each row represents a significant GO biological process which is colored according to the -log10(p.adjust).
∗Top 15 enriched GO BP terms are showed in the bar plot of each disease state in each tissue. Each row represents a significant GO biological process which is colored according to the -log10(p.adjust).
Page: 1 2 3 4 5 6 7 8 9 

check button Enriched GO biological processes.
GO IDTissueDisease StageDescriptionGene RatioBg Ratiopvaluep.adjustCount
GO:003447015EsophagusESCCncRNA processing300/8552395/187233.09e-353.26e-32300
GO:003466012EsophagusESCCncRNA metabolic process346/8552485/187234.35e-312.51e-28346
GO:0006401110EsophagusESCCRNA catabolic process204/8552278/187233.39e-215.66e-19204
GO:014005313EsophagusESCCmitochondrial gene expression93/8552108/187231.96e-182.03e-1693
GO:0034655110EsophagusESCCnucleobase-containing compound catabolic process272/8552407/187232.92e-182.90e-16272
GO:004670018EsophagusESCCheterocycle catabolic process286/8552445/187231.12e-157.47e-14286
GO:004427019EsophagusESCCcellular nitrogen compound catabolic process288/8552451/187233.03e-151.79e-13288
GO:001943918EsophagusESCCaromatic compound catabolic process295/8552467/187231.09e-145.98e-13295
GO:190136118EsophagusESCCorganic cyclic compound catabolic process307/8552495/187239.99e-144.80e-12307
GO:00905013EsophagusESCCRNA phosphodiester bond hydrolysis110/8552152/187231.95e-116.81e-10110
GO:00080333EsophagusESCCtRNA processing92/8552127/187237.83e-101.93e-0892
GO:00063992EsophagusESCCtRNA metabolic process122/8552179/187239.03e-102.19e-08122
GO:00903053EsophagusESCCnucleic acid phosphodiester bond hydrolysis163/8552261/187233.07e-085.73e-07163
GO:00009592EsophagusESCCmitochondrial RNA metabolic process39/855249/187231.20e-061.49e-0539
GO:00009631EsophagusESCCmitochondrial RNA processing19/855220/187233.83e-064.14e-0519
GO:00311233EsophagusESCCRNA 3'-end processing76/8552116/187231.25e-051.15e-0476
GO:00346613EsophagusESCCncRNA catabolic process33/855243/187233.25e-052.69e-0433
GO:00905023EsophagusESCCRNA phosphodiester bond hydrolysis, endonucleolytic55/855282/187237.34e-055.51e-0455
GO:0090646EsophagusESCCmitochondrial tRNA processing11/855212/187231.26e-036.06e-0311
GO:00160782EsophagusESCCtRNA catabolic process11/855213/187234.76e-031.85e-0211
Page: 1 2 3 4 5 

check button Enriched KEGG pathways.
Pathway IDTissueDisease StageDescriptionGene RatioBg Ratiopvaluep.adjustqvalueCount
Page: 1 

Top

Cell-cell communication analysis

check buttonIdentification of potential cell-cell interactions between two cell types and their ligand-receptor pairs for different disease states
LigandReceptorLRpairPathwayTissueDisease Stage
Page: 1 

Top

Single-cell gene regulatory network inference analysis

check buttonFind out the significant the regulons (TFs) and the target genes of each regulon across cell types for different disease states
TFCell TypeTissueDisease StageTarget GeneRSSRegulon Activity
∗The dot plots of a searched regulon are shown for all cell subpopulations in each disease state of each tissue based on the regulon specific score inferred using pySCENIC and by calculating the average expression.
Page: 1 

Top

Somatic mutation of malignant transformation related genes

check buttonAnnotation of somatic variants for genes involved in malignant transformation
Hugo SymbolVariant ClassVariant ClassificationdbSNP RSHGVScHGVSpHGVSp ShortSWISSPROTBIOTYPESIFTPolyPhenTumor Sample BarcodeTissueHistologySexAgeStageTherapy TypesDrugsOutcome
ELAC2SNVMissense_Mutationrs756803645c.1142N>Cp.Arg381Prop.R381PQ9BQ52protein_codingdeleterious(0.01)probably_damaging(0.997)TCGA-A8-A06R-01Breastbreast invasive carcinomaFemale>=65I/IIChemotherapy5-fluorouracilCR
ELAC2SNVMissense_Mutationnovelc.701N>Cp.Val234Alap.V234AQ9BQ52protein_codingtolerated(0.85)benign(0)TCGA-AO-A128-01Breastbreast invasive carcinomaFemale<65I/IIChemotherapydoxorubicinSD
ELAC2SNVMissense_Mutationrs749460308c.1400C>Tp.Ala467Valp.A467VQ9BQ52protein_codingtolerated(1)benign(0)TCGA-AR-A1AK-01Breastbreast invasive carcinomaFemale>=65I/IIHormone TherapyanastrozoleSD
ELAC2SNVMissense_Mutationrs759606875c.2326G>Cp.Glu776Glnp.E776QQ9BQ52protein_codingtolerated(0.05)possibly_damaging(0.867)TCGA-BH-A5IZ-01Breastbreast invasive carcinomaFemale<65I/IIChemotherapyadriamycinCR
ELAC2SNVMissense_Mutationrs756803645c.1142N>Cp.Arg381Prop.R381PQ9BQ52protein_codingdeleterious(0.01)probably_damaging(0.997)TCGA-C8-A12X-01Breastbreast invasive carcinomaFemale<65I/IIUnknownUnknownSD
ELAC2insertionIn_Frame_Insnovelc.1409_1410insGCACAGGCTTTGGAAp.Gly470_Pro471insHisArgLeuTrpAsnp.G470_P471insHRLWNQ9BQ52protein_codingTCGA-A2-A0CT-01Breastbreast invasive carcinomaFemale>=65I/IIChemotherapycytoxanSD
ELAC2insertionFrame_Shift_Insnovelc.767_768insAAGTGATAAAATGGCCTCTTTTATCTGTGTTTGTCCCGCATGTCp.Leu257SerfsTer68p.L257Sfs*68Q9BQ52protein_codingTCGA-A7-A0CE-01Breastbreast invasive carcinomaFemale<65I/IIChemotherapyadriamycinSD
ELAC2insertionFrame_Shift_Insnovelc.886_887insCTTGGTGGTTCACATGp.Leu296ProfsTer24p.L296Pfs*24Q9BQ52protein_codingTCGA-AO-A0JM-01Breastbreast invasive carcinomaFemale<65I/IIChemotherapydoxorubicinSD
ELAC2insertionFrame_Shift_Insnovelc.884_885insCCAAGGAAAGGCAGATGCCCCCGTGp.Glu295AspfsTer28p.E295Dfs*28Q9BQ52protein_codingTCGA-AO-A0JM-01Breastbreast invasive carcinomaFemale<65I/IIChemotherapydoxorubicinSD
ELAC2insertionFrame_Shift_Insnovelc.632_633insGATTGp.Ser212IlefsTer32p.S212Ifs*32Q9BQ52protein_codingTCGA-B6-A0RE-01Breastbreast invasive carcinomaFemale<65I/IIUnknownUnknownSD
Page: 1 2 3 4 5 6 7 8 

Top

Related drugs of malignant transformation related genes

check buttonIdentification of chemicals and drugs interact with genes involved in malignant transfromation
(DGIdb 4.0)
Entrez IDSymbolCategoryInteraction TypesDrug Claim NameDrug NamePMIDs
Page: 1