
|
|||||
|
 | |
| |
| |
| |
| |
| |
|
Gene: EIPR1 |
Gene summary for EIPR1 |
| Gene information | Species | Human | Gene symbol | EIPR1 | Gene ID | 7260 |
| Gene name | EARP complex and GARP complex interacting protein 1 | |
| Gene Alias | EIPR-1 | |
| Cytomap | 2p25.3 | |
| Gene Type | protein-coding | GO ID | GO:0002790 | UniProtAcc | A8MUM1 |
Top |
Malignant transformation analysis |
| Identification of the aberrant gene expression in precancerous and cancerous lesions by comparing the gene expression of stem-like cells in diseased tissues with normal stem cells |
| Entrez ID | Symbol | Replicates | Species | Organ | Tissue | Adj P-value | Log2FC | Malignancy |
| 7260 | EIPR1 | LZE4T | Human | Esophagus | ESCC | 5.68e-07 | 2.32e-01 | 0.0811 |
| 7260 | EIPR1 | LZE7T | Human | Esophagus | ESCC | 9.32e-08 | 3.01e-01 | 0.0667 |
| 7260 | EIPR1 | LZE8T | Human | Esophagus | ESCC | 3.19e-08 | 2.55e-01 | 0.067 |
| 7260 | EIPR1 | LZE20T | Human | Esophagus | ESCC | 1.26e-02 | 1.53e-01 | 0.0662 |
| 7260 | EIPR1 | LZE22T | Human | Esophagus | ESCC | 1.40e-06 | 3.63e-01 | 0.068 |
| 7260 | EIPR1 | LZE24T | Human | Esophagus | ESCC | 8.18e-15 | 3.48e-01 | 0.0596 |
| 7260 | EIPR1 | LZE22D3 | Human | Esophagus | HGIN | 4.92e-04 | 5.15e-01 | 0.0653 |
| 7260 | EIPR1 | LZE21T | Human | Esophagus | ESCC | 2.38e-13 | 5.66e-01 | 0.0655 |
| 7260 | EIPR1 | LZE6T | Human | Esophagus | ESCC | 5.35e-04 | 2.51e-01 | 0.0845 |
| 7260 | EIPR1 | S014 | Human | Liver | HCC | 1.31e-09 | 4.49e-01 | 0.2254 |
| 7260 | EIPR1 | S015 | Human | Liver | HCC | 2.36e-15 | 7.48e-01 | 0.2375 |
| 7260 | EIPR1 | S016 | Human | Liver | HCC | 2.23e-15 | 5.66e-01 | 0.2243 |
| 7260 | EIPR1 | S028 | Human | Liver | HCC | 1.30e-09 | 4.31e-01 | 0.2503 |
| 7260 | EIPR1 | S029 | Human | Liver | HCC | 4.33e-05 | 3.58e-01 | 0.2581 |
| Page: 1 |
| Tissue | Expression Dynamics | Abbreviation |
| Esophagus | 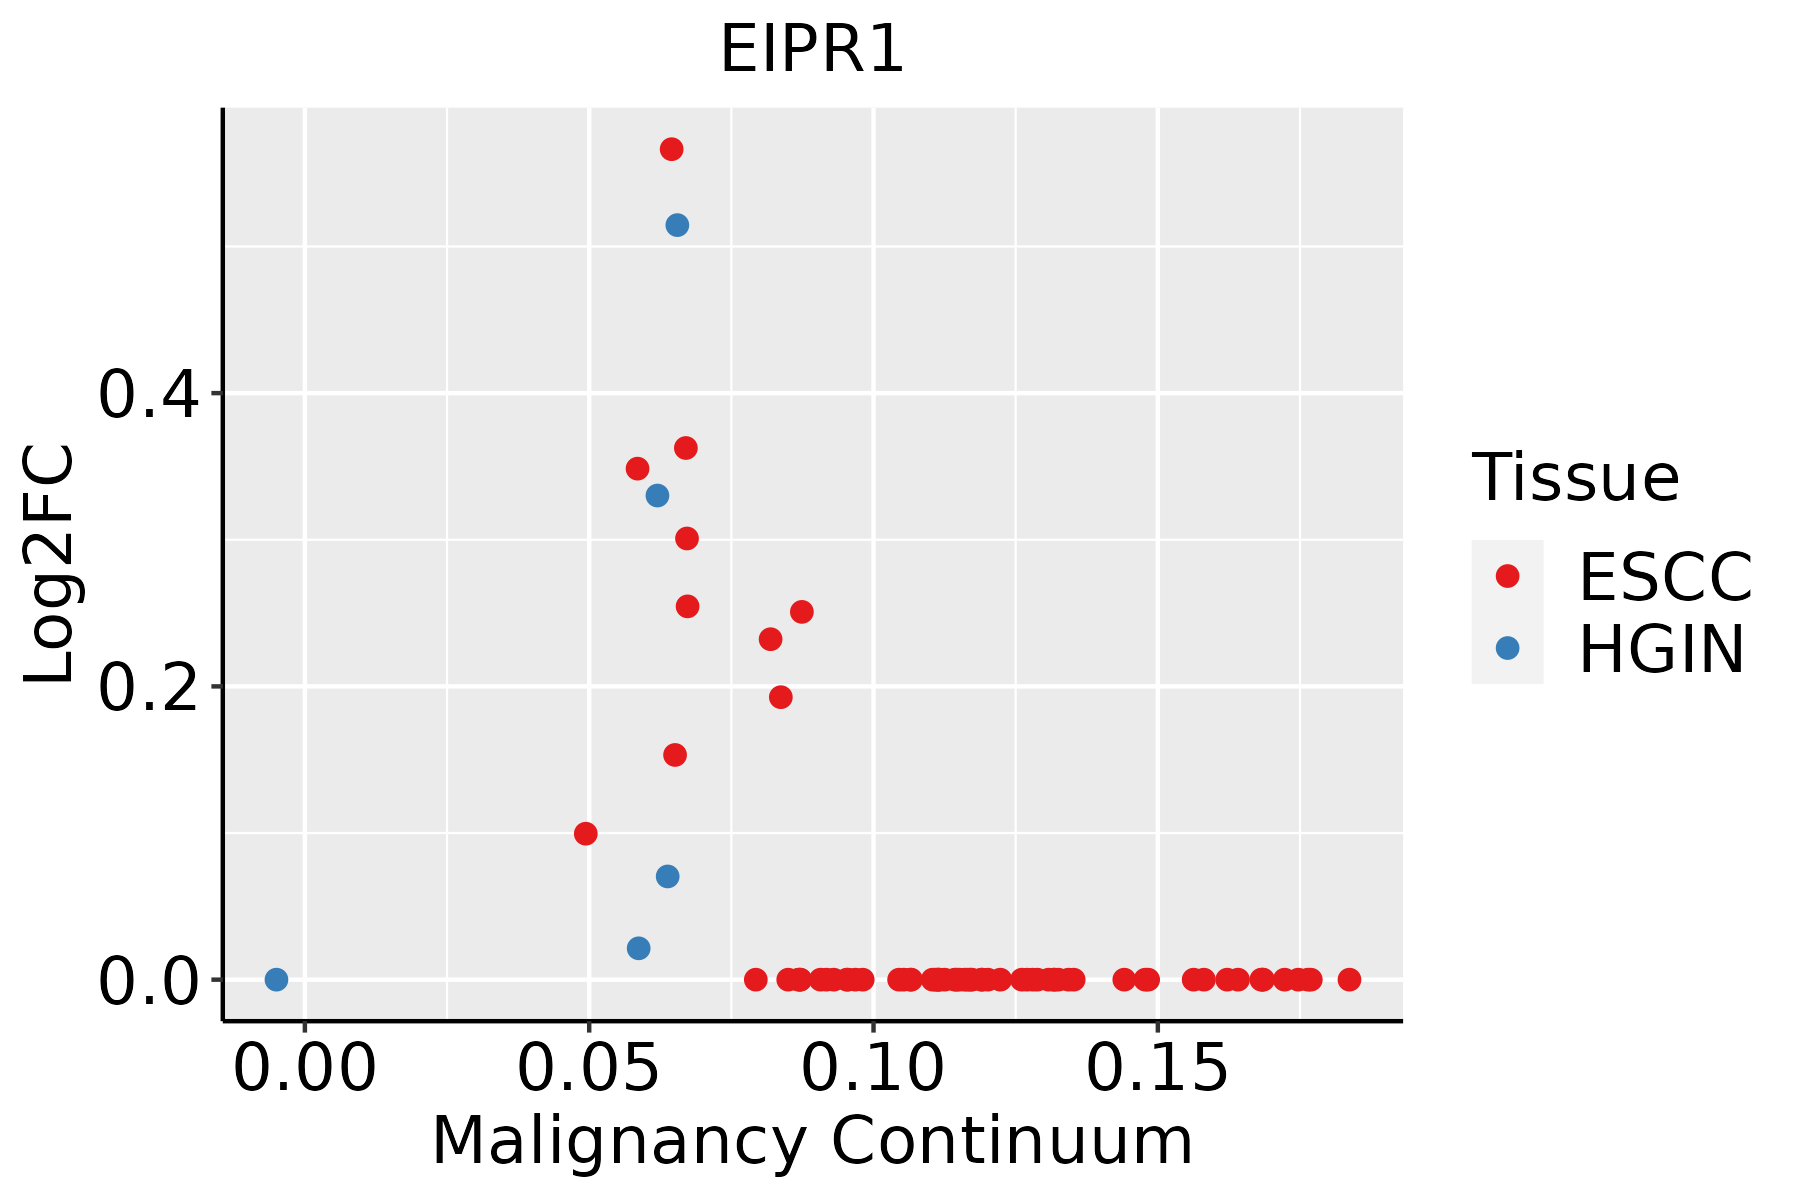 | ESCC: Esophageal squamous cell carcinoma |
| HGIN: High-grade intraepithelial neoplasias | ||
| LGIN: Low-grade intraepithelial neoplasias | ||
| Liver | 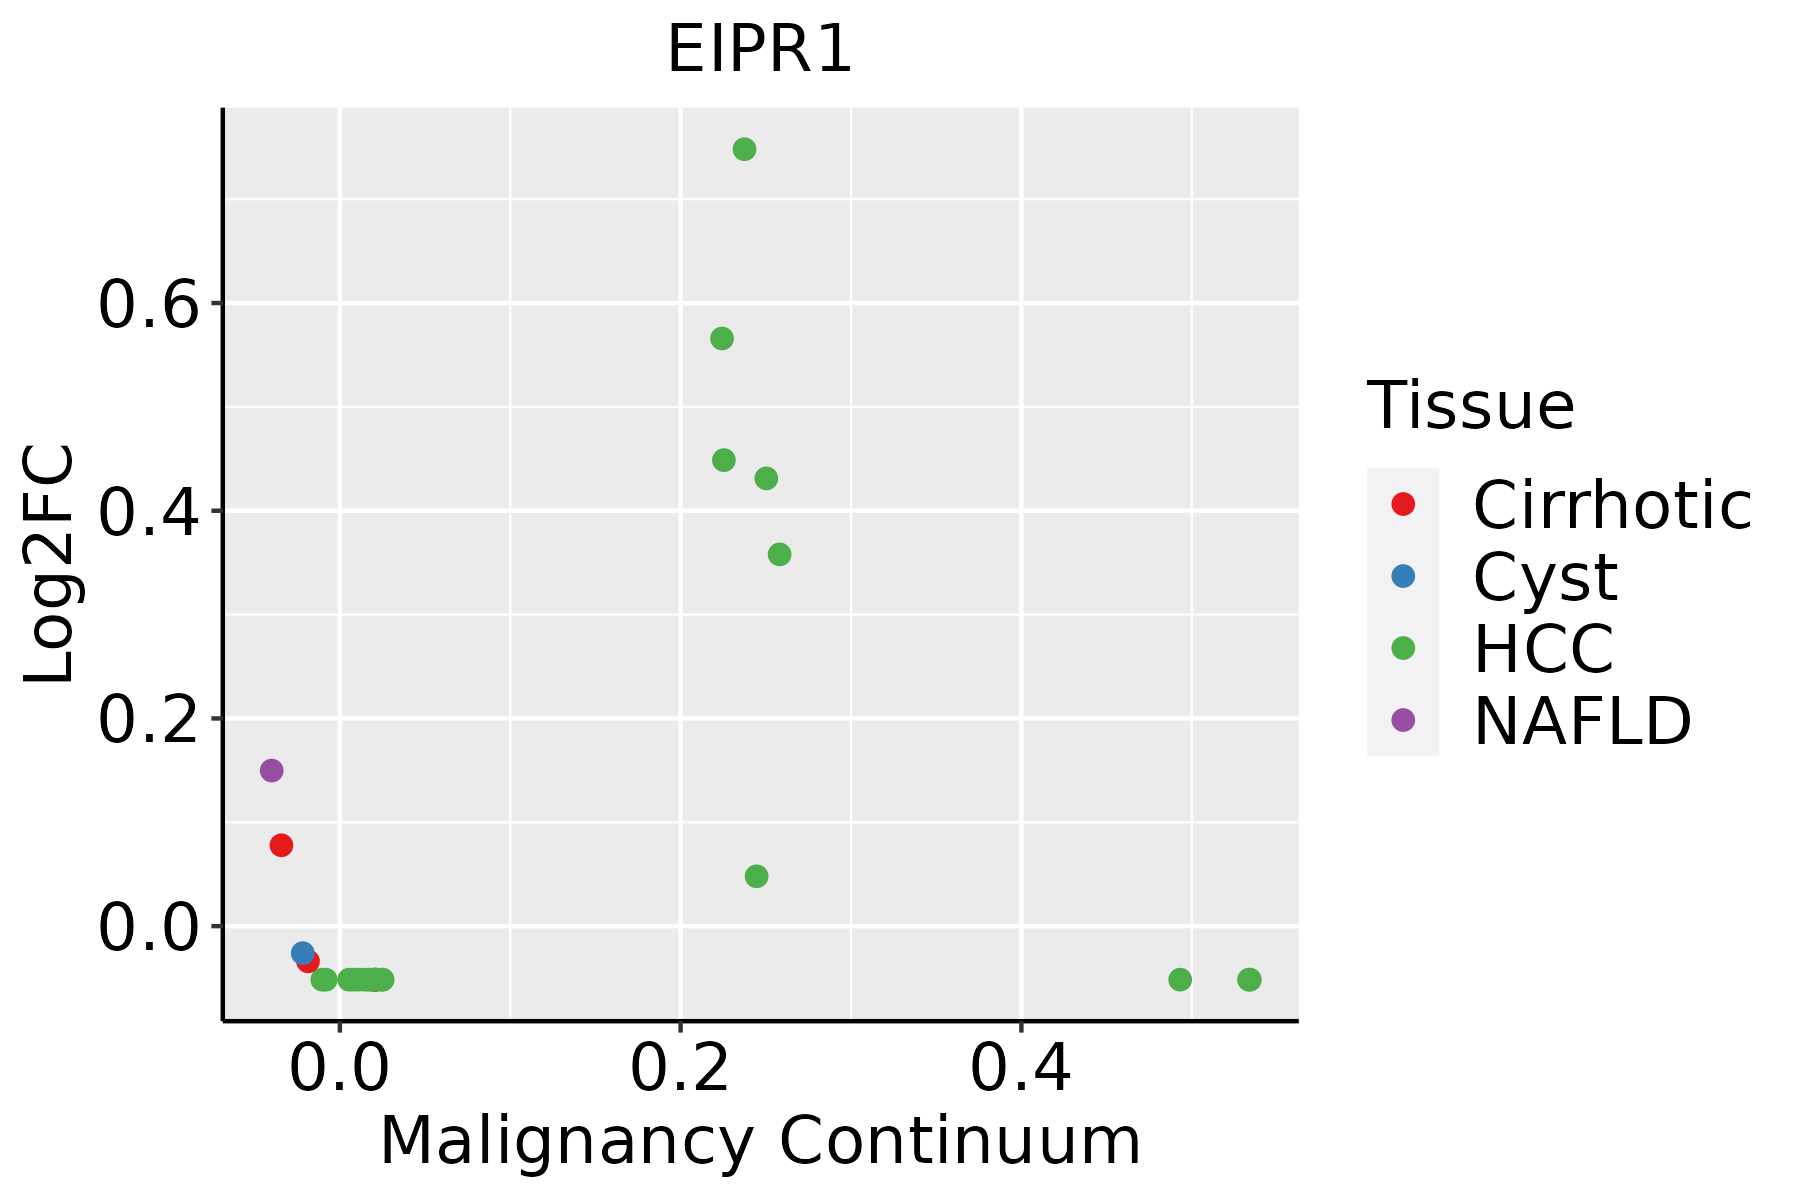 | HCC: Hepatocellular carcinoma |
| NAFLD: Non-alcoholic fatty liver disease |
| ∗log2FC in expression of this searched gene in stem-like cells from each diseased tissue sample relative to stem-like cells in normal samples in each tissue plotted against the malignancy continuum. Samples are colored based on if they are from different disease stage. |
Top |
Malignant transformation related pathway analysis |
| Find out the enriched GO biological processes and KEGG pathways involved in transition from healthy to precancer to cancer |
| Tissue | Disease Stage | Enriched GO biological Processes |
| Colorectum | AD |  |
| Colorectum | SER |  |
| Colorectum | MSS |  |
| Colorectum | MSI-H |  |
| Colorectum | FAP |  |
| ∗Top 15 enriched GO BP terms are showed in the bar plot of each disease state in each tissue. Each row represents a significant GO biological process which is colored according to the -log10(p.adjust). |
| Page: 1 2 3 4 5 6 7 8 9 |
| GO ID | Tissue | Disease Stage | Description | Gene Ratio | Bg Ratio | pvalue | p.adjust | Count |
| GO:003238617 | Esophagus | HGIN | regulation of intracellular transport | 79/2587 | 337/18723 | 1.11e-06 | 4.36e-05 | 79 |
| GO:001619710 | Esophagus | HGIN | endosomal transport | 57/2587 | 230/18723 | 5.74e-06 | 1.81e-04 | 57 |
| GO:003238820 | Esophagus | HGIN | positive regulation of intracellular transport | 51/2587 | 202/18723 | 1.00e-05 | 2.92e-04 | 51 |
| GO:009887610 | Esophagus | HGIN | vesicle-mediated transport to the plasma membrane | 36/2587 | 136/18723 | 6.76e-05 | 1.55e-03 | 36 |
| GO:003238618 | Esophagus | ESCC | regulation of intracellular transport | 243/8552 | 337/18723 | 3.20e-23 | 7.25e-21 | 243 |
| GO:0032388110 | Esophagus | ESCC | positive regulation of intracellular transport | 152/8552 | 202/18723 | 7.89e-18 | 7.36e-16 | 152 |
| GO:001619715 | Esophagus | ESCC | endosomal transport | 168/8552 | 230/18723 | 2.28e-17 | 1.93e-15 | 168 |
| GO:001648210 | Esophagus | ESCC | cytosolic transport | 124/8552 | 168/18723 | 9.69e-14 | 4.69e-12 | 124 |
| GO:009887615 | Esophagus | ESCC | vesicle-mediated transport to the plasma membrane | 99/8552 | 136/18723 | 1.13e-10 | 3.39e-09 | 99 |
| GO:00421477 | Esophagus | ESCC | retrograde transport, endosome to Golgi | 63/8552 | 91/18723 | 4.58e-06 | 4.87e-05 | 63 |
| GO:00324565 | Esophagus | ESCC | endocytic recycling | 51/8552 | 73/18723 | 2.47e-05 | 2.10e-04 | 51 |
| GO:19036496 | Esophagus | ESCC | regulation of cytoplasmic transport | 22/8552 | 28/18723 | 3.95e-04 | 2.26e-03 | 22 |
| GO:000930617 | Esophagus | ESCC | protein secretion | 190/8552 | 359/18723 | 3.22e-03 | 1.34e-02 | 190 |
| GO:003559217 | Esophagus | ESCC | establishment of protein localization to extracellular region | 190/8552 | 360/18723 | 3.77e-03 | 1.53e-02 | 190 |
| GO:007169210 | Esophagus | ESCC | protein localization to extracellular region | 193/8552 | 368/18723 | 5.01e-03 | 1.92e-02 | 193 |
| GO:005070810 | Esophagus | ESCC | regulation of protein secretion | 142/8552 | 268/18723 | 9.31e-03 | 3.24e-02 | 142 |
| GO:003238621 | Liver | HCC | regulation of intracellular transport | 231/7958 | 337/18723 | 1.99e-22 | 3.40e-20 | 231 |
| GO:003238821 | Liver | HCC | positive regulation of intracellular transport | 148/7958 | 202/18723 | 5.15e-19 | 6.66e-17 | 148 |
| GO:001619721 | Liver | HCC | endosomal transport | 154/7958 | 230/18723 | 4.74e-14 | 2.95e-12 | 154 |
| GO:001648221 | Liver | HCC | cytosolic transport | 117/7958 | 168/18723 | 8.83e-13 | 4.48e-11 | 117 |
| Page: 1 2 |
| Pathway ID | Tissue | Disease Stage | Description | Gene Ratio | Bg Ratio | pvalue | p.adjust | qvalue | Count |
| Page: 1 |
Top |
Cell-cell communication analysis |
| Identification of potential cell-cell interactions between two cell types and their ligand-receptor pairs for different disease states |
| Ligand | Receptor | LRpair | Pathway | Tissue | Disease Stage |
| Page: 1 |
Top |
Single-cell gene regulatory network inference analysis |
| Find out the significant the regulons (TFs) and the target genes of each regulon across cell types for different disease states |
| TF | Cell Type | Tissue | Disease Stage | Target Gene | RSS | Regulon Activity |
| ∗The dot plots of a searched regulon are shown for all cell subpopulations in each disease state of each tissue based on the regulon specific score inferred using pySCENIC and by calculating the average expression. |
| Page: 1 |
Top |
Somatic mutation of malignant transformation related genes |
| Annotation of somatic variants for genes involved in malignant transformation |
| Hugo Symbol | Variant Class | Variant Classification | dbSNP RS | HGVSc | HGVSp | HGVSp Short | SWISSPROT | BIOTYPE | SIFT | PolyPhen | Tumor Sample Barcode | Tissue | Histology | Sex | Age | Stage | Therapy Types | Drugs | Outcome |
| Page: 1 |
Top |
Related drugs of malignant transformation related genes |
| Identification of chemicals and drugs interact with genes involved in malignant transfromation |
| (DGIdb 4.0) |
| Entrez ID | Symbol | Category | Interaction Types | Drug Claim Name | Drug Name | PMIDs |
| Page: 1 |

Copyright 2023-Present -The University of Texas Health Science Center at Houston |