Schematic overview of the cellular and molecular mechanisms involved in the cancer progression, including the proposed cellular and molecular mechanisms in cancer cells trajectory. AT1: alveolar type 1 cells; AT2: alveolar type 2 cells; AAH: atypical adenomatous hyperplasia; AIS: adenocarcinoma in situ; MIA: minimally invasive adenocarcinoma; IA: invasive adenocarcinoma; EMT: epithelial-mesenchymal transition

Home

Download

Statistics

Help

Contact

Center for Computational Systems Medicine
leaf

Gene summary

leaf

Malignant transformation analysis

leaf

Malignant transformation related pathway analysis

leaf

Cell-cell communication analysis

leaf

Single-cell gene regulatory network inference analysis

leaf

Somatic mutation of malignant transformation related genes

leaf

Related drugs of malignant transformation related genes

Gene: EIF6

Gene summary for EIF6

check button Gene summary.

Gene informationSpeciesHuman
Gene symbol

EIF6

Gene ID

3692

Gene nameeukaryotic translation initiation factor 6
Gene AliasCAB
Cytomap20q11.22
Gene Typeprotein-coding
GO ID

GO:0000054

UniProtAcc

P56537


Top

Malignant transformation analysis

check button Identification of the aberrant gene expression in precancerous and cancerous lesions by comparing the gene expression of stem-like cells in diseased tissues with normal stem cells
check button Malignant transformation involving gene list.
Entrez IDSymbolReplicatesSpeciesOrganTissueAdj P-valueLog2FCMalignancy
3692EIF6GSM4909282HumanBreastIDC8.19e-052.62e-01-0.0288
3692EIF6GSM4909288HumanBreastIDC4.69e-02-8.28e-020.0988
3692EIF6GSM4909296HumanBreastIDC4.20e-076.91e-020.1524
3692EIF6GSM4909297HumanBreastIDC8.83e-15-3.78e-020.1517
3692EIF6GSM4909304HumanBreastIDC1.89e-073.83e-010.1636
3692EIF6GSM4909311HumanBreastIDC1.58e-30-6.25e-020.1534
3692EIF6GSM4909312HumanBreastIDC4.75e-108.30e-020.1552
3692EIF6GSM4909313HumanBreastIDC5.94e-03-2.04e-010.0391
3692EIF6GSM4909319HumanBreastIDC9.63e-37-1.82e-010.1563
3692EIF6GSM4909320HumanBreastIDC8.63e-123.07e-010.1575
3692EIF6GSM4909321HumanBreastIDC3.25e-223.06e-010.1559
3692EIF6brca1HumanBreastPrecancer3.51e-649.08e-01-0.0338
3692EIF6brca2HumanBreastPrecancer3.80e-224.53e-01-0.024
3692EIF6brca3HumanBreastPrecancer9.28e-336.26e-01-0.0263
3692EIF6M2HumanBreastIDC1.18e-022.87e-010.21
3692EIF6NCCBC14HumanBreastDCIS2.24e-04-1.48e-010.2021
3692EIF6NCCBC2HumanBreastDCIS6.55e-062.45e-030.1554
3692EIF6NCCBC3HumanBreastDCIS6.64e-03-8.06e-030.1198
3692EIF6NCCBC5HumanBreastDCIS1.30e-11-7.75e-030.2046
3692EIF6P1HumanBreastIDC6.96e-16-2.50e-010.1527
Page: 1 2 3 4 5 6 7 8 9 10 11 12 13 

check button Transcriptomic changes along malignancy continuum.
TissueExpression DynamicsAbbreviation
BreastThe image shows the transcriptomic changes along malignancy continuum.log2FC in expression of this searched gene in stem-like cells from each diseased tissue sample relative to stem-like cells in normal samples in each tissue plotted against the malignancy continuum. Samples are colored based on if they are from different disease stage.IDC: Invasive ductal carcinoma
DCIS: Ductal carcinoma in situ
Precancer(BRCA1-mut): Precancerous lesion from BRCA1 mutation carriers
Colorectum (GSE201348)The image shows the transcriptomic changes along malignancy continuum.log2FC in expression of this searched gene in stem-like cells from each diseased tissue sample relative to stem-like cells in normal samples in each tissue plotted against the malignancy continuum. Samples are colored based on if they are from different disease stage.FAP: Familial adenomatous polyposis
CRC: Colorectal cancer
Colorectum (HTA11)The image shows the transcriptomic changes along malignancy continuum.log2FC in expression of this searched gene in stem-like cells from each diseased tissue sample relative to stem-like cells in normal samples in each tissue plotted against the malignancy continuum. Samples are colored based on if they are from different disease stage.AD: Adenomas
SER: Sessile serrated lesions
MSI-H: Microsatellite-high colorectal cancer
MSS: Microsatellite stable colorectal cancer
EndometriumThe image shows the transcriptomic changes along malignancy continuum.log2FC in expression of this searched gene in stem-like cells from each diseased tissue sample relative to stem-like cells in normal samples in each tissue plotted against the malignancy continuum. Samples are colored based on if they are from different disease stage.
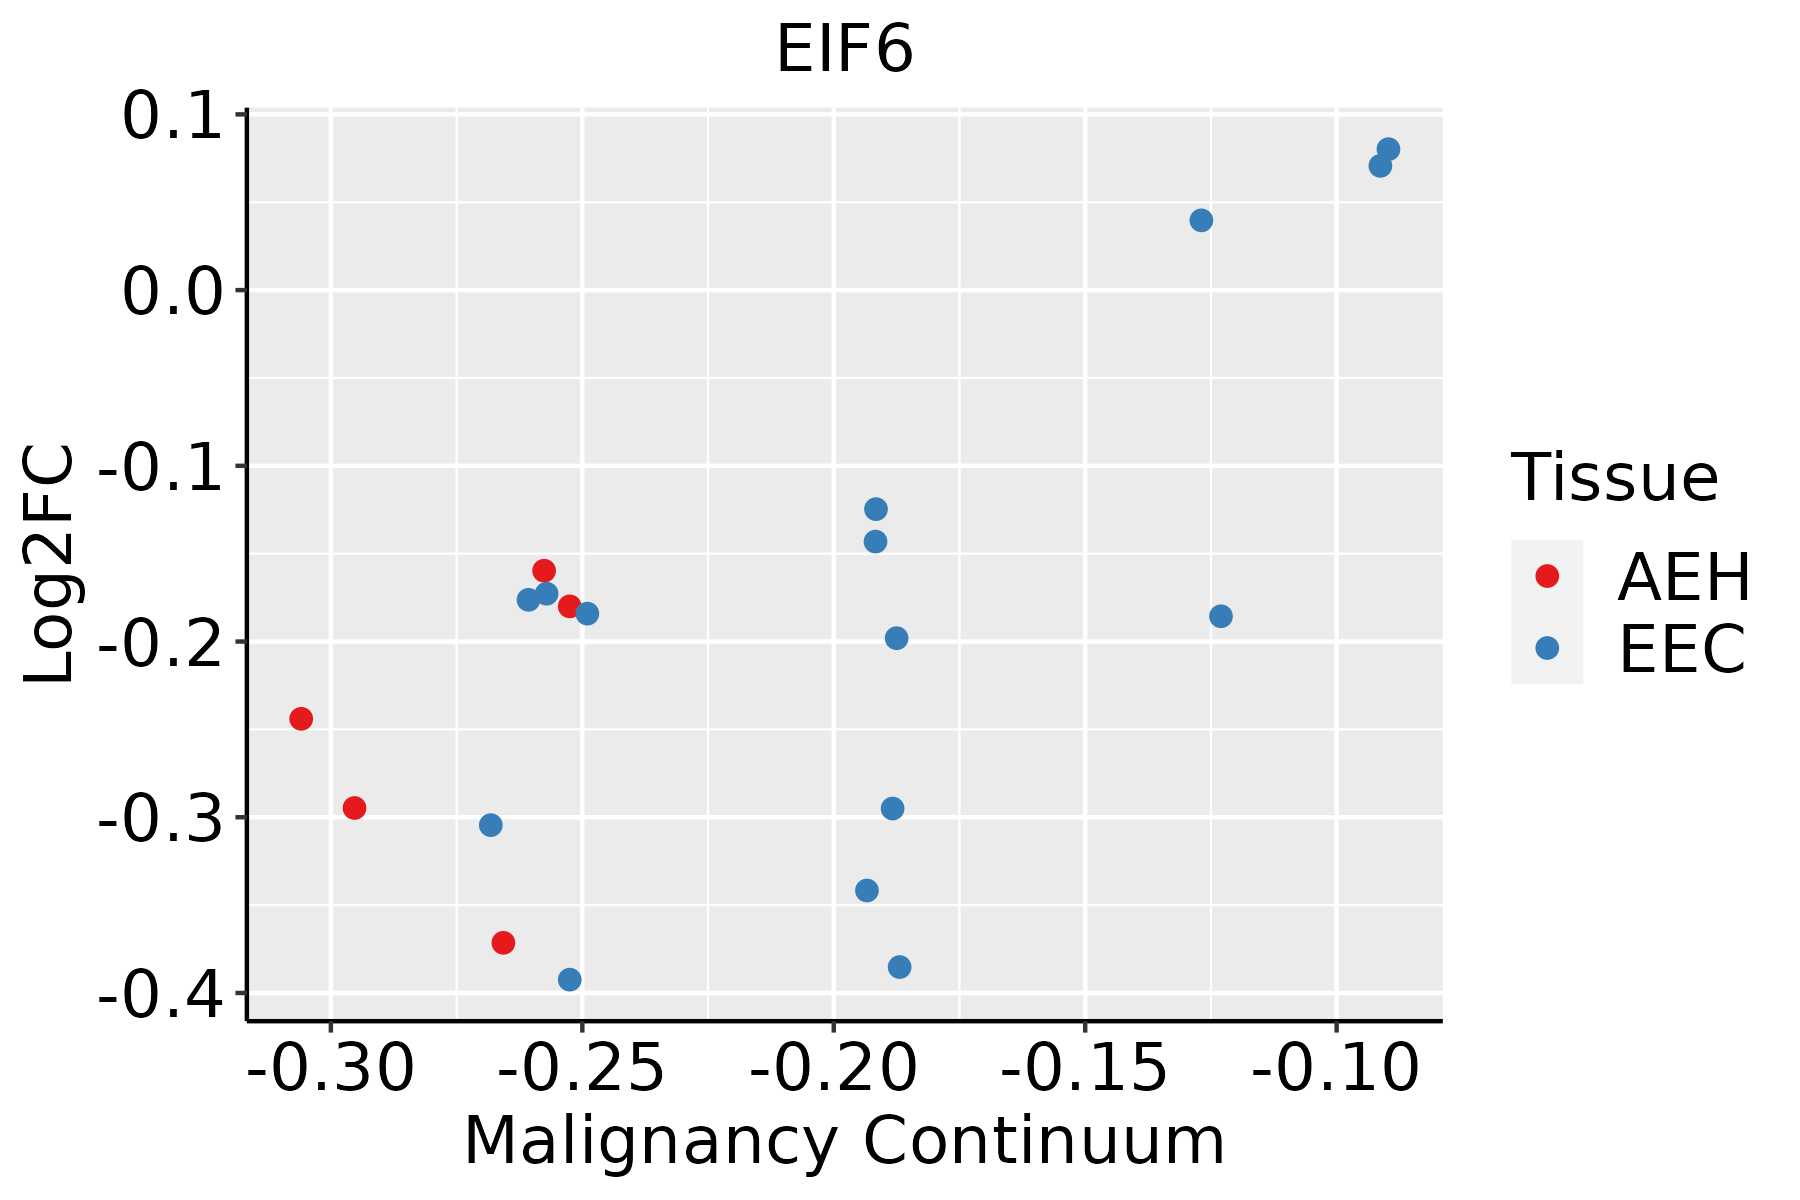
AEH: Atypical endometrial hyperplasia
EEC: Endometrioid Cancer
EsophagusThe image shows the transcriptomic changes along malignancy continuum.log2FC in expression of this searched gene in stem-like cells from each diseased tissue sample relative to stem-like cells in normal samples in each tissue plotted against the malignancy continuum. Samples are colored based on if they are from different disease stage.
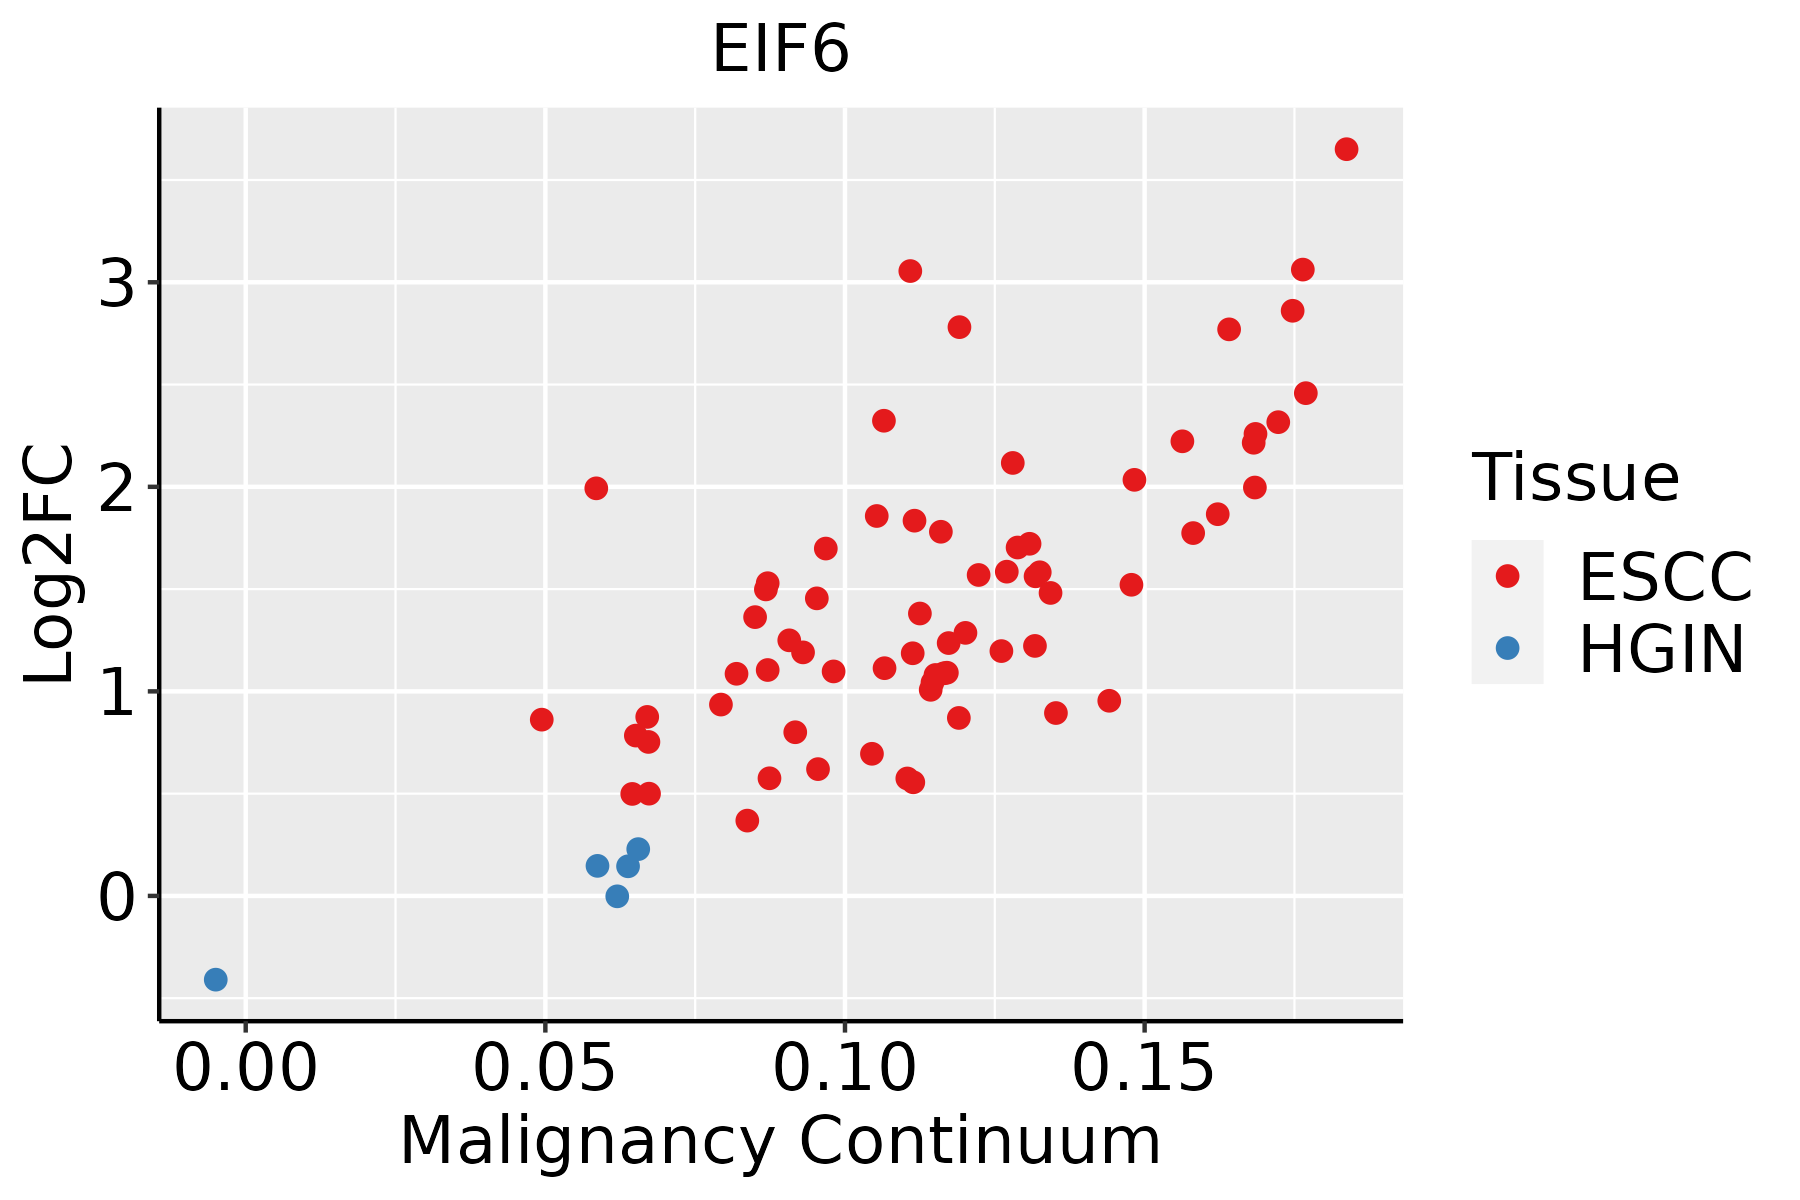
ESCC: Esophageal squamous cell carcinoma
HGIN: High-grade intraepithelial neoplasias
LGIN: Low-grade intraepithelial neoplasias
GCThe image shows the transcriptomic changes along malignancy continuum.log2FC in expression of this searched gene in stem-like cells from each diseased tissue sample relative to stem-like cells in normal samples in each tissue plotted against the malignancy continuum. Samples are colored based on if they are from different disease stage.CAG: Chronic atrophic gastritis
CAG with IM: Chronic atrophic gastritis with intestinal metaplasia
CSG: Chronic superficial gastritis
GC: Gastric cancer
SIM: Severe intestinal metaplasia
WIM: Wild intestinal metaplasia
LiverThe image shows the transcriptomic changes along malignancy continuum.log2FC in expression of this searched gene in stem-like cells from each diseased tissue sample relative to stem-like cells in normal samples in each tissue plotted against the malignancy continuum. Samples are colored based on if they are from different disease stage.
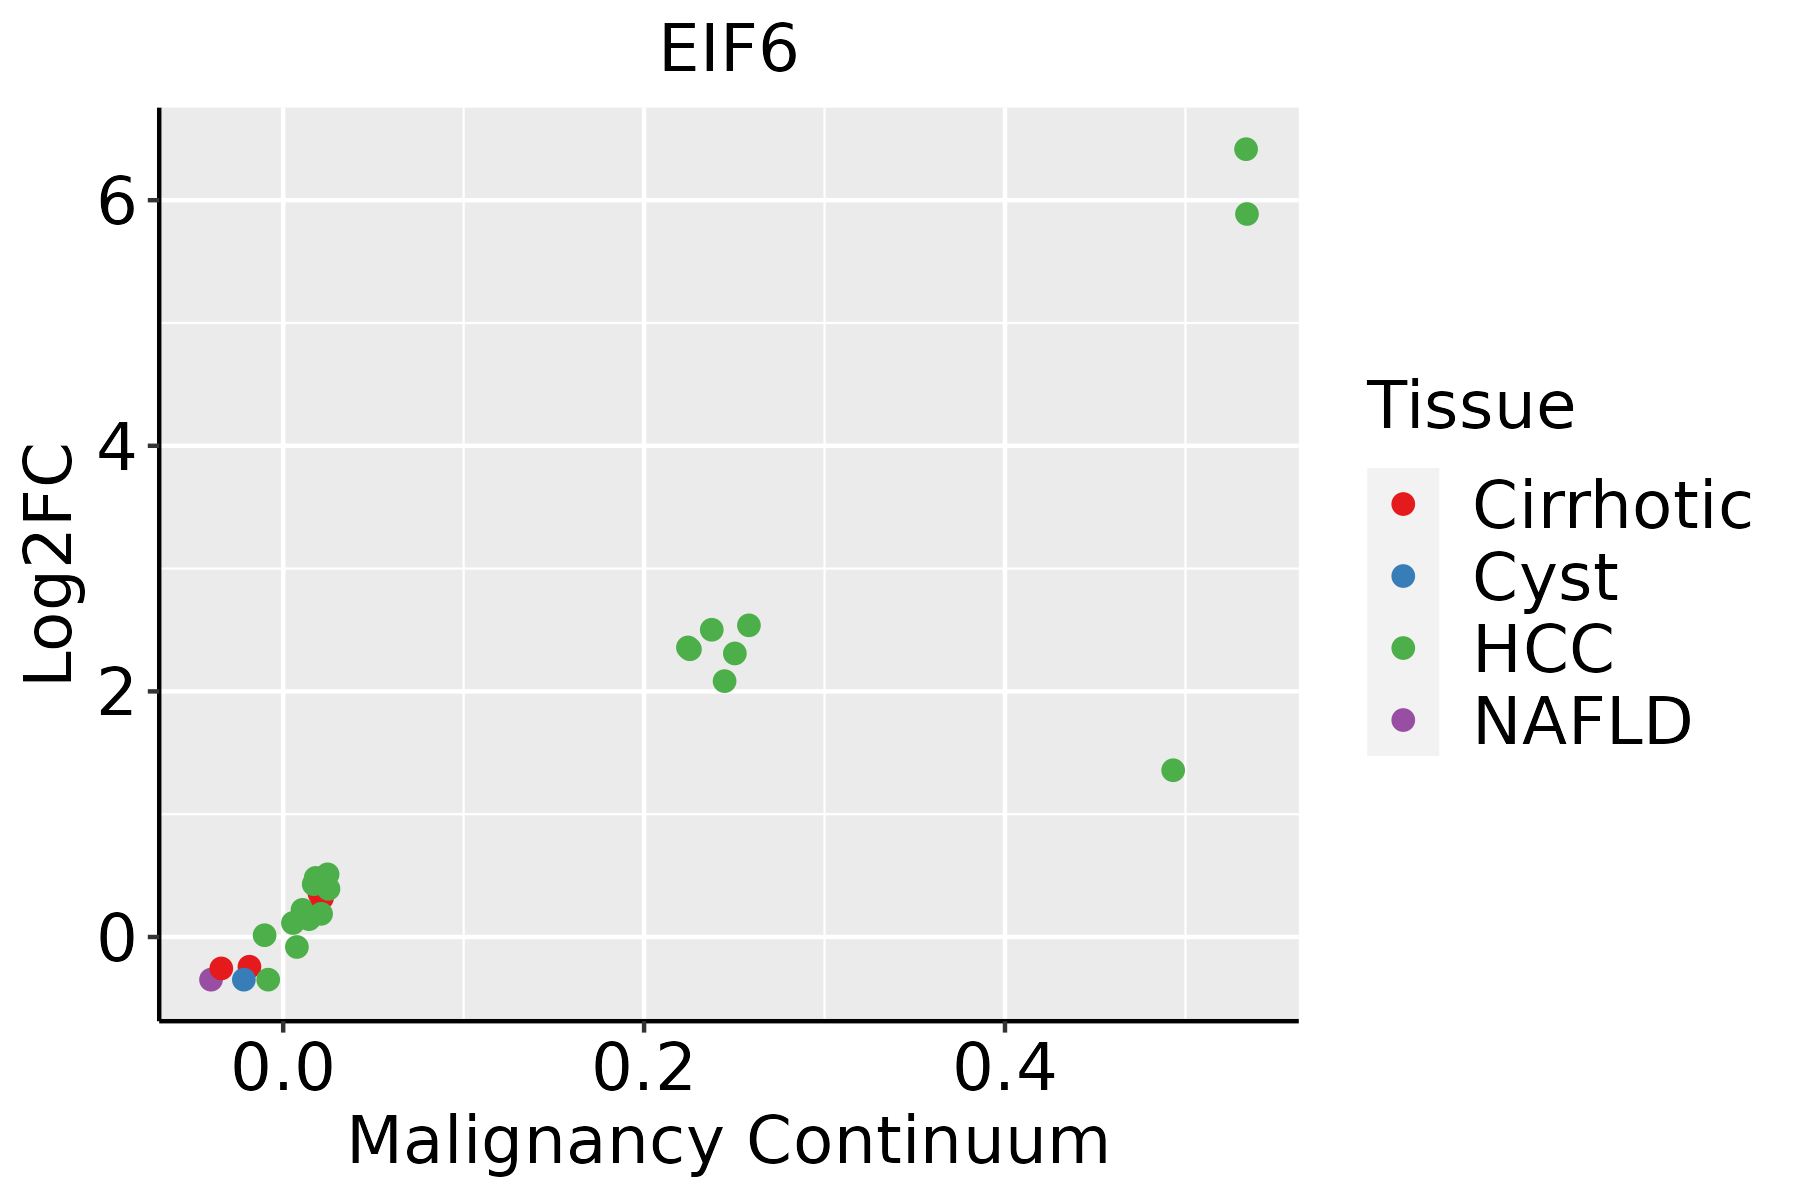
HCC: Hepatocellular carcinoma
NAFLD: Non-alcoholic fatty liver disease
Oral CavityThe image shows the transcriptomic changes along malignancy continuum.log2FC in expression of this searched gene in stem-like cells from each diseased tissue sample relative to stem-like cells in normal samples in each tissue plotted against the malignancy continuum. Samples are colored based on if they are from different disease stage.
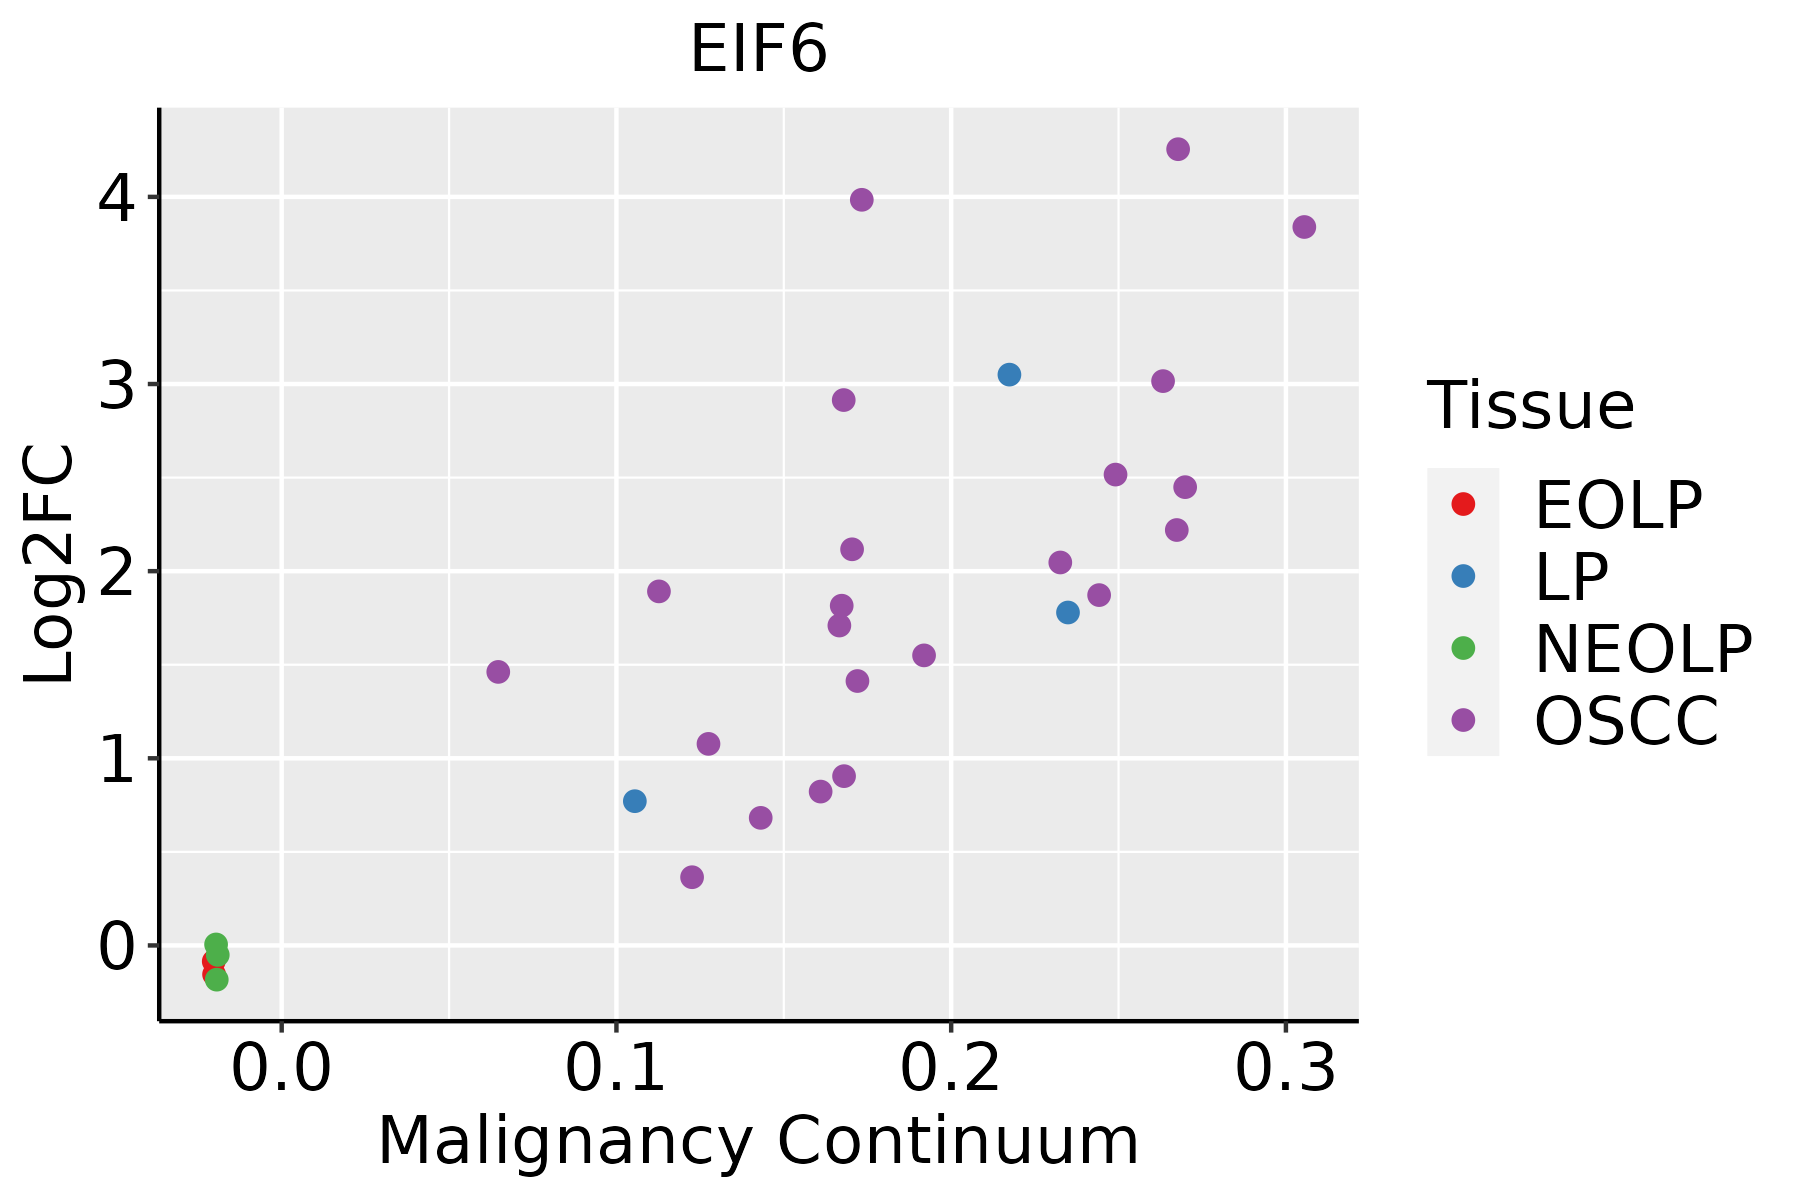
EOLP: Erosive Oral lichen planus
LP: leukoplakia
NEOLP: Non-erosive oral lichen planus
OSCC: Oral squamous cell carcinoma
ProstateThe image shows the transcriptomic changes along malignancy continuum.log2FC in expression of this searched gene in stem-like cells from each diseased tissue sample relative to stem-like cells in normal samples in each tissue plotted against the malignancy continuum. Samples are colored based on if they are from different disease stage.BPH: Benign Prostatic Hyperplasia
SkinThe image shows the transcriptomic changes along malignancy continuum.log2FC in expression of this searched gene in stem-like cells from each diseased tissue sample relative to stem-like cells in normal samples in each tissue plotted against the malignancy continuum. Samples are colored based on if they are from different disease stage.
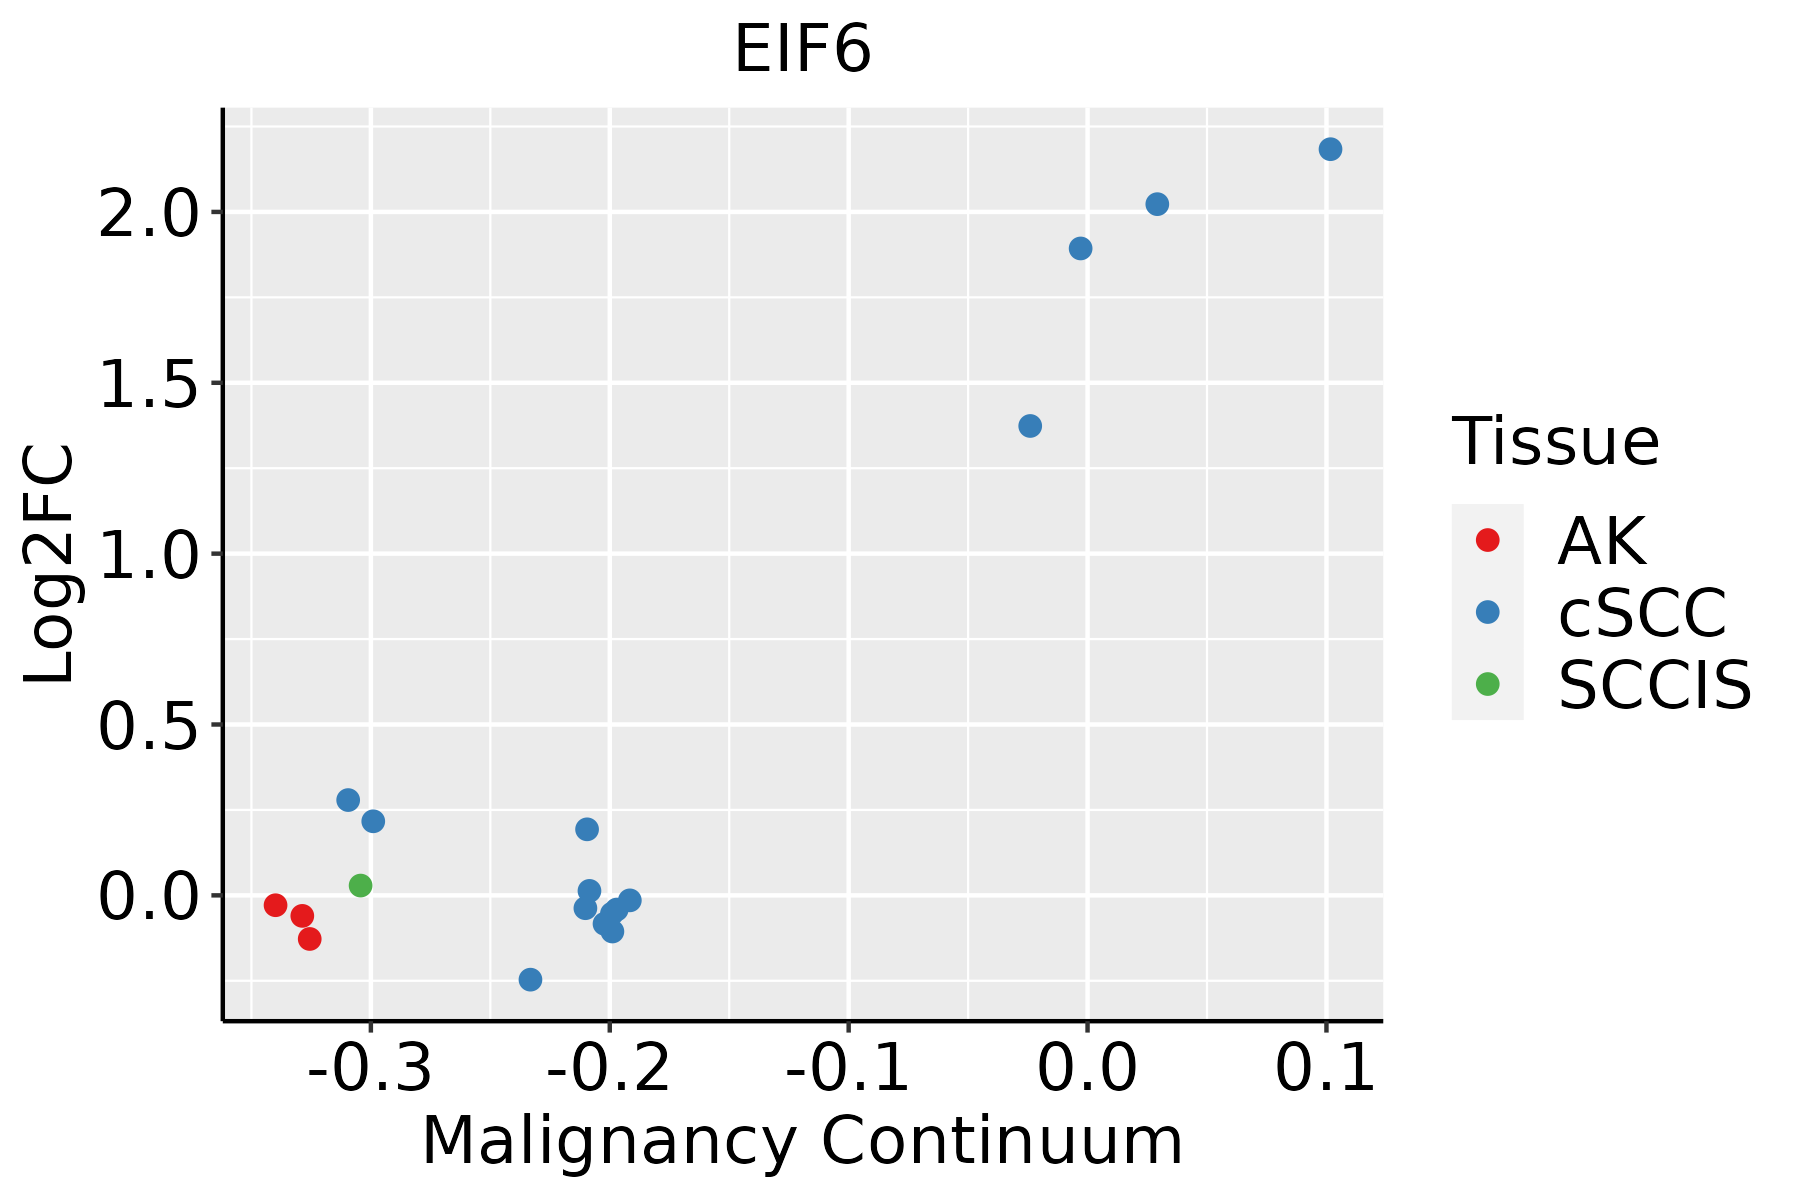
AK: Actinic keratosis
cSCC: Cutaneous squamous cell carcinoma
SCCIS:squamous cell carcinoma in situ
ThyroidThe image shows the transcriptomic changes along malignancy continuum.log2FC in expression of this searched gene in stem-like cells from each diseased tissue sample relative to stem-like cells in normal samples in each tissue plotted against the malignancy continuum. Samples are colored based on if they are from different disease stage.
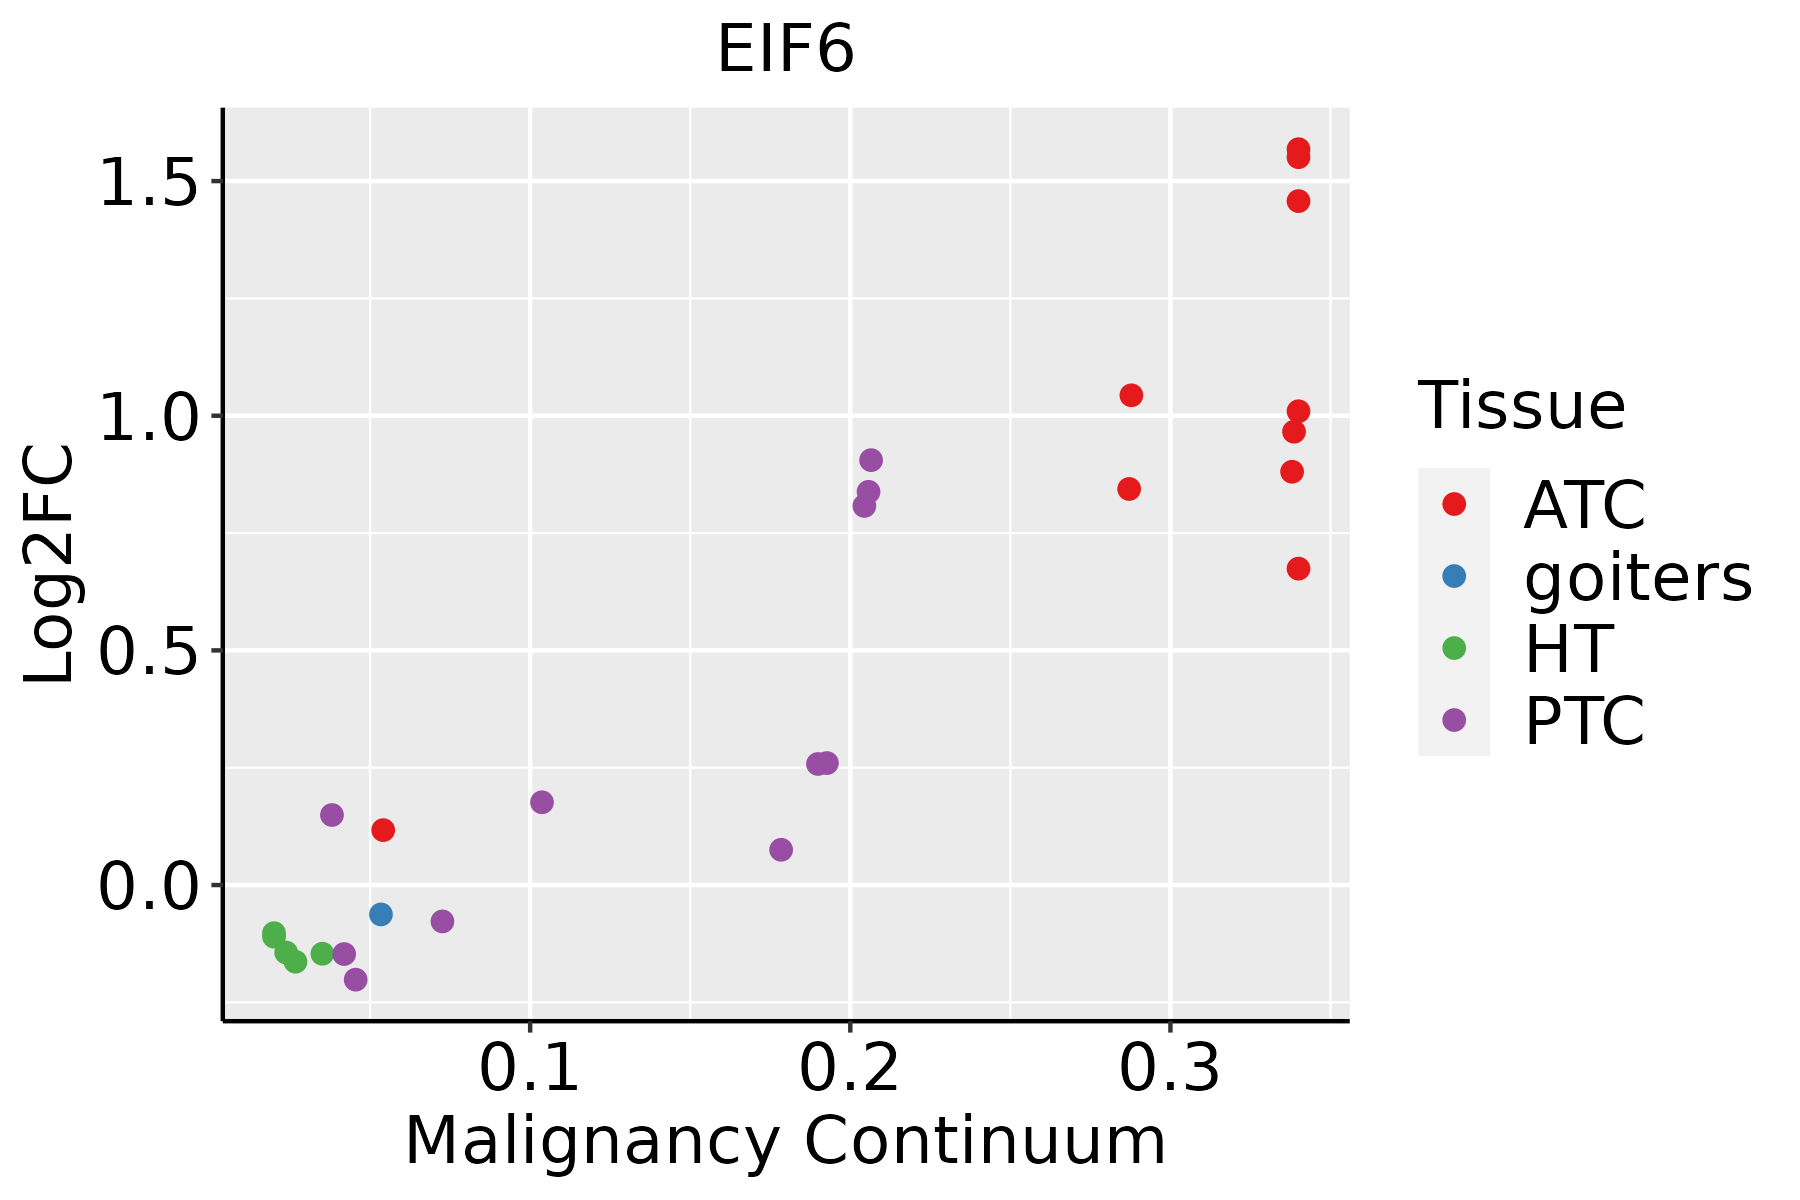
ATC: Anaplastic thyroid cancer
HT: Hashimoto's thyroiditis
PTC: Papillary thyroid cancer
∗log2FC in expression of this searched gene in stem-like cells from each diseased tissue sample relative to stem-like cells in normal samples in each tissue plotted against the malignancy continuum. Samples are colored based on if they are from different disease stage.

Top

Malignant transformation related pathway analysis

check buttonFind out the enriched GO biological processes and KEGG pathways involved in transition from healthy to precancer to cancer
check button Figure of enriched GO biological processes.
TissueDisease StageEnriched GO biological Processes
ColorectumADGO analysis - Figure of enriched GO biological processes: Top 15 enriched GO BP terms are showed in the bar plot of each disease state in each tissue. Each row represents a significant GO biological process which is colored according to the -log10(p.adjust).
ColorectumSERGO analysis - Figure of enriched GO biological processes: Top 15 enriched GO BP terms are showed in the bar plot of each disease state in each tissue. Each row represents a significant GO biological process which is colored according to the -log10(p.adjust).
ColorectumMSSGO analysis - Figure of enriched GO biological processes: Top 15 enriched GO BP terms are showed in the bar plot of each disease state in each tissue. Each row represents a significant GO biological process which is colored according to the -log10(p.adjust).
ColorectumMSI-HGO analysis - Figure of enriched GO biological processes: Top 15 enriched GO BP terms are showed in the bar plot of each disease state in each tissue. Each row represents a significant GO biological process which is colored according to the -log10(p.adjust).
ColorectumFAPGO analysis - Figure of enriched GO biological processes: Top 15 enriched GO BP terms are showed in the bar plot of each disease state in each tissue. Each row represents a significant GO biological process which is colored according to the -log10(p.adjust).
∗Top 15 enriched GO BP terms are showed in the bar plot of each disease state in each tissue. Each row represents a significant GO biological process which is colored according to the -log10(p.adjust).
Page: 1 2 3 4 5 6 7 8 9 

check button Enriched GO biological processes.
GO IDTissueDisease StageDescriptionGene RatioBg Ratiopvaluep.adjustCount
GO:00460349BreastPrecancerATP metabolic process82/1080277/187231.94e-365.19e-3382
GO:00060918BreastPrecancergeneration of precursor metabolites and energy94/1080490/187231.54e-251.64e-2294
GO:00226139BreastPrecancerribonucleoprotein complex biogenesis79/1080463/187232.11e-181.03e-1579
GO:00718269BreastPrecancerribonucleoprotein complex subunit organization48/1080227/187232.68e-158.45e-1348
GO:00226189BreastPrecancerribonucleoprotein complex assembly47/1080220/187233.47e-151.03e-1247
GO:00422549BreastPrecancerribosome biogenesis52/1080299/187237.35e-131.51e-1052
GO:00064138BreastPrecancertranslational initiation30/1080118/187233.23e-125.58e-1030
GO:00064179BreastPrecancerregulation of translation67/1080468/187234.71e-127.64e-1067
GO:00457279BreastPrecancerpositive regulation of translation32/1080136/187235.89e-129.27e-1032
GO:00422559BreastPrecancerribosome assembly21/108061/187231.06e-111.53e-0921
GO:00422739BreastPrecancerribosomal large subunit biogenesis22/108072/187235.03e-115.61e-0922
GO:00342509BreastPrecancerpositive regulation of cellular amide metabolic process33/1080162/187231.72e-101.77e-0833
GO:00063646BreastPrecancerrRNA processing35/1080225/187237.90e-084.60e-0635
GO:00160726BreastPrecancerrRNA metabolic process36/1080236/187238.59e-084.84e-0636
GO:00196938BreastPrecancerribose phosphate metabolic process49/1080396/187233.81e-071.78e-0549
GO:00091509BreastPrecancerpurine ribonucleotide metabolic process46/1080368/187236.47e-072.71e-0546
GO:00091179BreastPrecancernucleotide metabolic process56/1080489/187237.40e-073.00e-0556
GO:00092598BreastPrecancerribonucleotide metabolic process47/1080385/187239.69e-073.84e-0547
GO:00469398BreastPrecancernucleotide phosphorylation20/1080101/187231.07e-064.18e-0520
GO:00067539BreastPrecancernucleoside phosphate metabolic process56/1080497/187231.24e-064.70e-0556
Page: 1 2 3 4 5 6 7 8 9 10 11 12 13 14 15 16 17 18 19 20 21 22 23 24 25 26 27 28 29 30 31 32 33 34 35 36 37 38 39 40 41 42 43 44 45 46 47 48 49 50 51 52 53 54 55 56 57 58 59 60 61 62 

check button Enriched KEGG pathways.
Pathway IDTissueDisease StageDescriptionGene RatioBg Ratiopvaluep.adjustqvalueCount
Page: 1 

Top

Cell-cell communication analysis

check buttonIdentification of potential cell-cell interactions between two cell types and their ligand-receptor pairs for different disease states
LigandReceptorLRpairPathwayTissueDisease Stage
Page: 1 

Top

Single-cell gene regulatory network inference analysis

check buttonFind out the significant the regulons (TFs) and the target genes of each regulon across cell types for different disease states
TFCell TypeTissueDisease StageTarget GeneRSSRegulon Activity
∗The dot plots of a searched regulon are shown for all cell subpopulations in each disease state of each tissue based on the regulon specific score inferred using pySCENIC and by calculating the average expression.
Page: 1 

Top

Somatic mutation of malignant transformation related genes

check buttonAnnotation of somatic variants for genes involved in malignant transformation
Hugo SymbolVariant ClassVariant ClassificationdbSNP RSHGVScHGVSpHGVSp ShortSWISSPROTBIOTYPESIFTPolyPhenTumor Sample BarcodeTissueHistologySexAgeStageTherapy TypesDrugsOutcome
EIF6SNVMissense_Mutationc.427G>Tp.Ala143Serp.A143SP56537protein_codingtolerated(0.05)benign(0.192)TCGA-CM-6163-01Colorectumcolon adenocarcinomaMale>=65I/IIUnknownUnknownSD
EIF6SNVMissense_Mutationnovelc.268N>Tp.Asp90Tyrp.D90YP56537protein_codingdeleterious(0)probably_damaging(0.969)TCGA-A5-A0G1-01Endometriumuterine corpus endometrioid carcinomaFemale>=65I/IIUnknownUnknownSD
EIF6SNVMissense_Mutationnovelc.268N>Tp.Asp90Tyrp.D90YP56537protein_codingdeleterious(0)probably_damaging(0.969)TCGA-A5-A0GG-01Endometriumuterine corpus endometrioid carcinomaFemale>=65I/IIUnknownUnknownSD
EIF6SNVMissense_Mutationc.205N>Ap.Gly69Serp.G69SP56537protein_codingdeleterious(0)probably_damaging(0.957)TCGA-AJ-A3EL-01Endometriumuterine corpus endometrioid carcinomaFemale<65I/IIUnknownUnknownSD
EIF6SNVMissense_Mutationc.368G>Tp.Arg123Metp.R123MP56537protein_codingdeleterious(0.01)benign(0.142)TCGA-AP-A059-01Endometriumuterine corpus endometrioid carcinomaFemale>=65I/IIUnknownUnknownSD
EIF6SNVMissense_Mutationc.200G>Tp.Arg67Metp.R67MP56537protein_codingdeleterious(0)possibly_damaging(0.838)TCGA-AP-A059-01Endometriumuterine corpus endometrioid carcinomaFemale>=65I/IIUnknownUnknownSD
EIF6SNVMissense_Mutationrs144752898c.430G>Ap.Asp144Asnp.D144NP56537protein_codingtolerated(0.42)benign(0.009)TCGA-AP-A1DV-01Endometriumuterine corpus endometrioid carcinomaFemale<65I/IIUnknownUnknownSD
EIF6SNVMissense_Mutationrs773641573c.254N>Ap.Arg85Hisp.R85HP56537protein_codingdeleterious(0.01)possibly_damaging(0.9)TCGA-BG-A0M9-01Endometriumuterine corpus endometrioid carcinomaFemale>=65I/IIUnknownUnknownSD
EIF6SNVMissense_Mutationnovelc.313N>Ap.Gly105Serp.G105SP56537protein_codingdeleterious(0.04)probably_damaging(0.996)TCGA-EO-A22U-01Endometriumuterine corpus endometrioid carcinomaFemale>=65I/IIUnknownUnknownSD
EIF6SNVMissense_Mutationrs768741006c.511G>Ap.Asp171Asnp.D171NP56537protein_codingtolerated(0.07)benign(0.151)TCGA-FI-A2D0-01Endometriumuterine corpus endometrioid carcinomaFemale<65I/IIUnknownUnknownSD
Page: 1 2 

Top

Related drugs of malignant transformation related genes

check buttonIdentification of chemicals and drugs interact with genes involved in malignant transfromation
(DGIdb 4.0)
Entrez IDSymbolCategoryInteraction TypesDrug Claim NameDrug NamePMIDs
Page: 1