Schematic overview of the cellular and molecular mechanisms involved in the cancer progression, including the proposed cellular and molecular mechanisms in cancer cells trajectory. AT1: alveolar type 1 cells; AT2: alveolar type 2 cells; AAH: atypical adenomatous hyperplasia; AIS: adenocarcinoma in situ; MIA: minimally invasive adenocarcinoma; IA: invasive adenocarcinoma; EMT: epithelial-mesenchymal transition

Home

Download

Statistics

Help

Contact

Center for Computational Systems Medicine
leaf

Gene summary

leaf

Malignant transformation analysis

leaf

Malignant transformation related pathway analysis

leaf

Cell-cell communication analysis

leaf

Single-cell gene regulatory network inference analysis

leaf

Somatic mutation of malignant transformation related genes

leaf

Related drugs of malignant transformation related genes

Gene: EIF5B

Gene summary for EIF5B

check button Gene summary.

Gene informationSpeciesHuman
Gene symbol

EIF5B

Gene ID

9669

Gene nameeukaryotic translation initiation factor 5B
Gene AliasIF2
Cytomap2q11.2
Gene Typeprotein-coding
GO ID

GO:0006412

UniProtAcc

O60841


Top

Malignant transformation analysis

check button Identification of the aberrant gene expression in precancerous and cancerous lesions by comparing the gene expression of stem-like cells in diseased tissues with normal stem cells
check button Malignant transformation involving gene list.
Entrez IDSymbolReplicatesSpeciesOrganTissueAdj P-valueLog2FCMalignancy
9669EIF5BHTA11_3410_2000001011HumanColorectumAD1.05e-07-4.56e-010.0155
9669EIF5BHTA11_866_2000001011HumanColorectumAD1.90e-02-2.02e-01-0.1001
9669EIF5BA015-C-203HumanColorectumFAP4.53e-203.33e-02-0.1294
9669EIF5BA015-C-204HumanColorectumFAP6.51e-042.60e-01-0.0228
9669EIF5BA014-C-040HumanColorectumFAP1.02e-023.05e-01-0.1184
9669EIF5BA002-C-201HumanColorectumFAP9.30e-06-4.48e-020.0324
9669EIF5BA001-C-119HumanColorectumFAP1.33e-032.11e-01-0.1557
9669EIF5BA001-C-108HumanColorectumFAP1.67e-183.58e-01-0.0272
9669EIF5BA002-C-205HumanColorectumFAP1.14e-203.13e-01-0.1236
9669EIF5BA001-C-104HumanColorectumFAP4.46e-053.12e-010.0184
9669EIF5BA015-C-006HumanColorectumFAP5.25e-225.21e-01-0.0994
9669EIF5BA015-C-106HumanColorectumFAP1.89e-102.32e-01-0.0511
9669EIF5BA002-C-114HumanColorectumFAP1.34e-152.09e-01-0.1561
9669EIF5BA015-C-104HumanColorectumFAP1.08e-271.85e-01-0.1899
9669EIF5BA001-C-014HumanColorectumFAP4.57e-142.71e-010.0135
9669EIF5BA002-C-016HumanColorectumFAP8.75e-191.81e-010.0521
9669EIF5BA015-C-002HumanColorectumFAP3.70e-134.05e-01-0.0763
9669EIF5BA001-C-007HumanColorectumCRC5.72e-065.29e-010.1899
9669EIF5BA001-C-203HumanColorectumFAP1.21e-101.90e-01-0.0481
9669EIF5BA002-C-116HumanColorectumFAP5.88e-24-4.53e-02-0.0452
Page: 1 2 3 4 5 6 7 8 9 10 

check button Transcriptomic changes along malignancy continuum.
TissueExpression DynamicsAbbreviation
Colorectum (GSE201348)The image shows the transcriptomic changes along malignancy continuum.log2FC in expression of this searched gene in stem-like cells from each diseased tissue sample relative to stem-like cells in normal samples in each tissue plotted against the malignancy continuum. Samples are colored based on if they are from different disease stage.FAP: Familial adenomatous polyposis
CRC: Colorectal cancer
Colorectum (HTA11)The image shows the transcriptomic changes along malignancy continuum.log2FC in expression of this searched gene in stem-like cells from each diseased tissue sample relative to stem-like cells in normal samples in each tissue plotted against the malignancy continuum. Samples are colored based on if they are from different disease stage.AD: Adenomas
SER: Sessile serrated lesions
MSI-H: Microsatellite-high colorectal cancer
MSS: Microsatellite stable colorectal cancer
EndometriumThe image shows the transcriptomic changes along malignancy continuum.log2FC in expression of this searched gene in stem-like cells from each diseased tissue sample relative to stem-like cells in normal samples in each tissue plotted against the malignancy continuum. Samples are colored based on if they are from different disease stage.AEH: Atypical endometrial hyperplasia
EEC: Endometrioid Cancer
EsophagusThe image shows the transcriptomic changes along malignancy continuum.log2FC in expression of this searched gene in stem-like cells from each diseased tissue sample relative to stem-like cells in normal samples in each tissue plotted against the malignancy continuum. Samples are colored based on if they are from different disease stage.ESCC: Esophageal squamous cell carcinoma
HGIN: High-grade intraepithelial neoplasias
LGIN: Low-grade intraepithelial neoplasias
LiverThe image shows the transcriptomic changes along malignancy continuum.log2FC in expression of this searched gene in stem-like cells from each diseased tissue sample relative to stem-like cells in normal samples in each tissue plotted against the malignancy continuum. Samples are colored based on if they are from different disease stage.
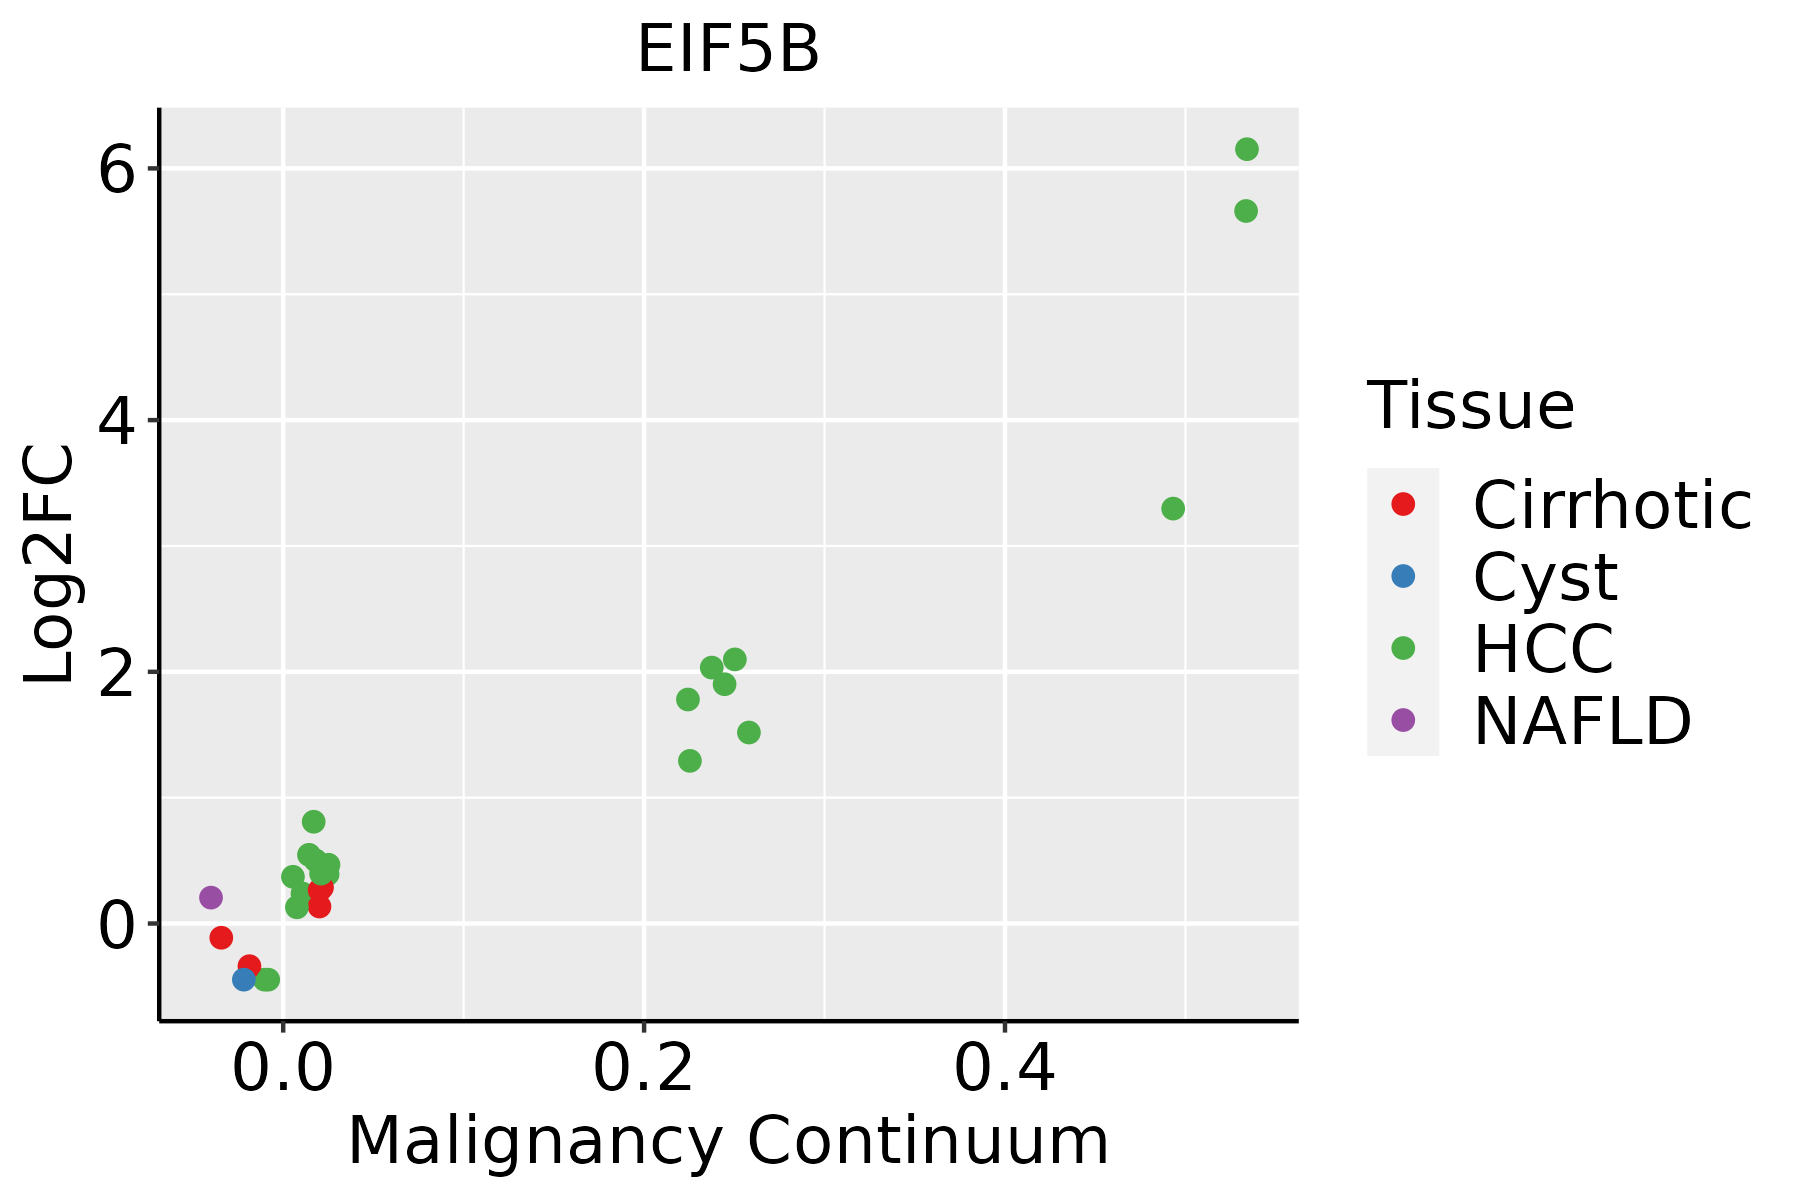
HCC: Hepatocellular carcinoma
NAFLD: Non-alcoholic fatty liver disease
Oral CavityThe image shows the transcriptomic changes along malignancy continuum.log2FC in expression of this searched gene in stem-like cells from each diseased tissue sample relative to stem-like cells in normal samples in each tissue plotted against the malignancy continuum. Samples are colored based on if they are from different disease stage.
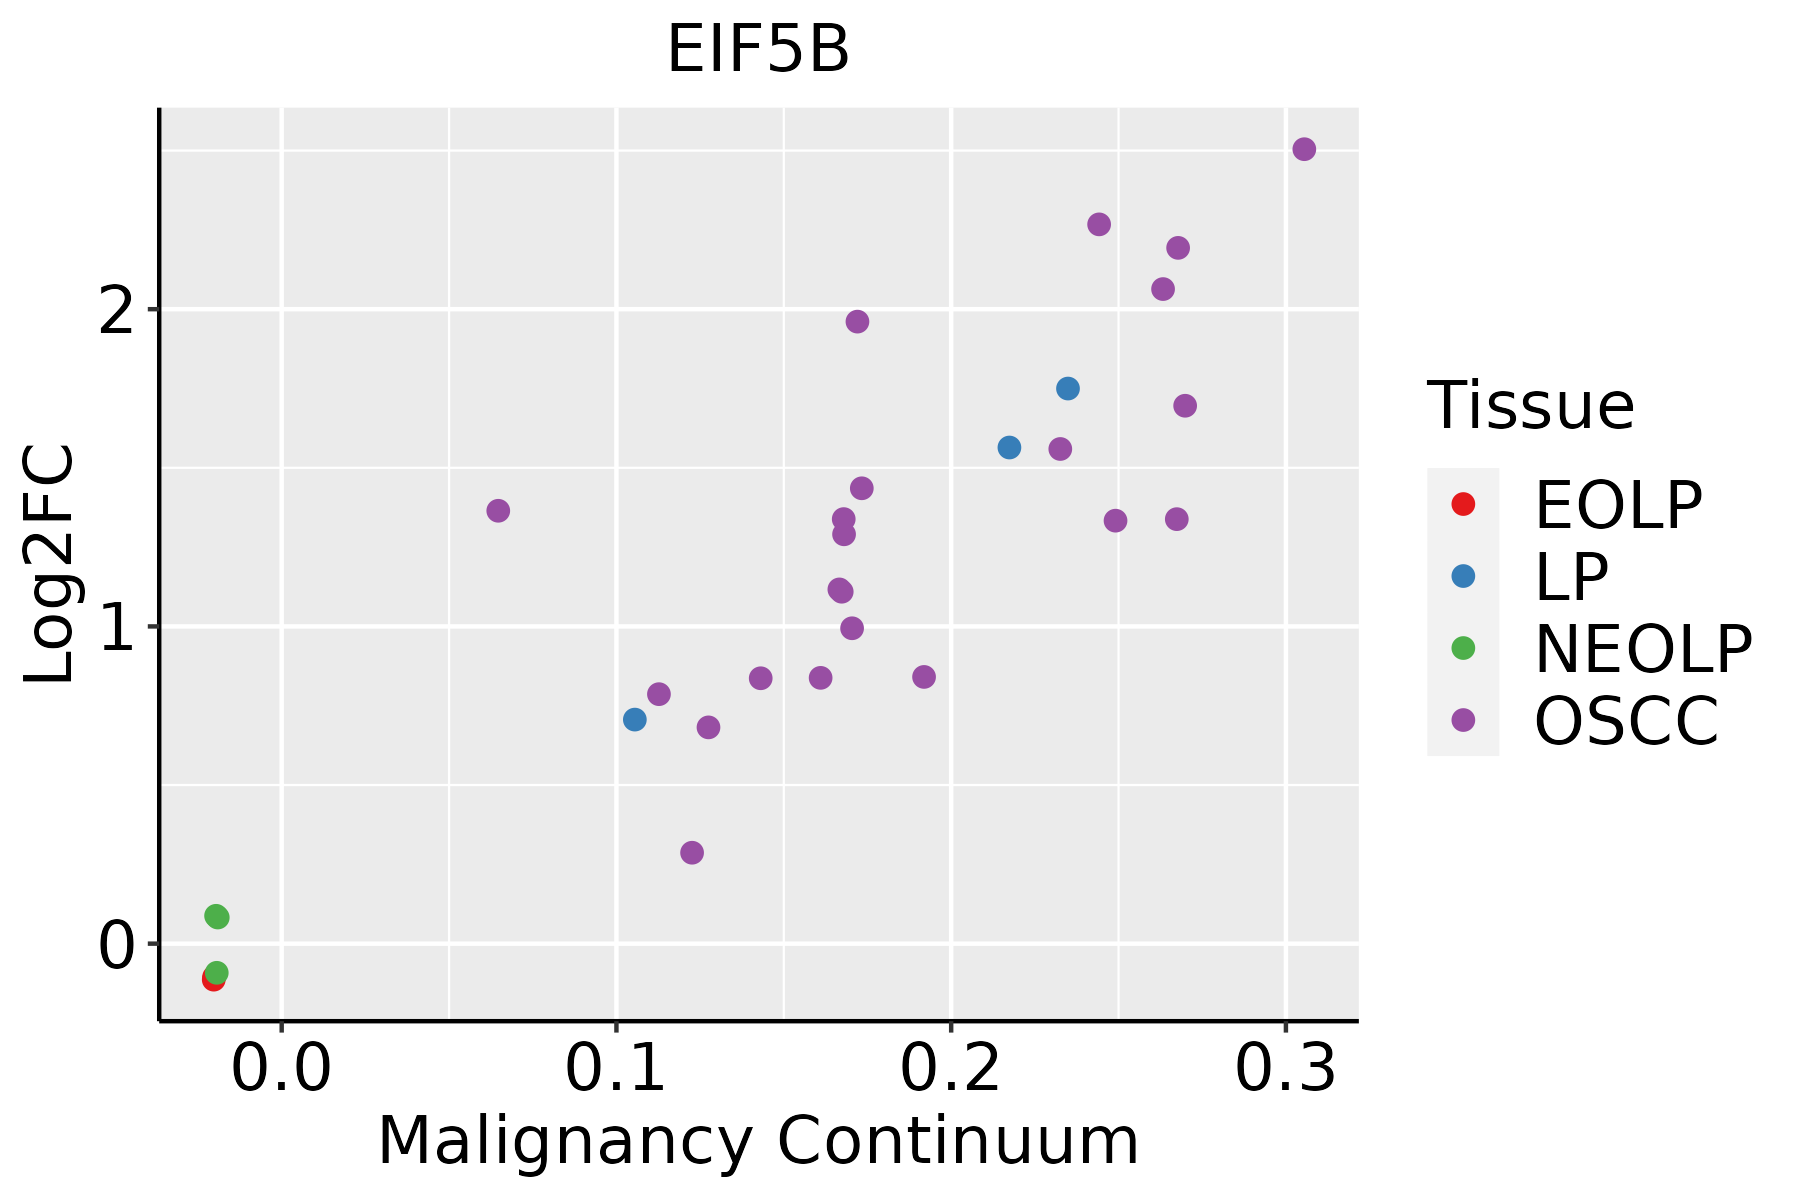
EOLP: Erosive Oral lichen planus
LP: leukoplakia
NEOLP: Non-erosive oral lichen planus
OSCC: Oral squamous cell carcinoma
ProstateThe image shows the transcriptomic changes along malignancy continuum.log2FC in expression of this searched gene in stem-like cells from each diseased tissue sample relative to stem-like cells in normal samples in each tissue plotted against the malignancy continuum. Samples are colored based on if they are from different disease stage.
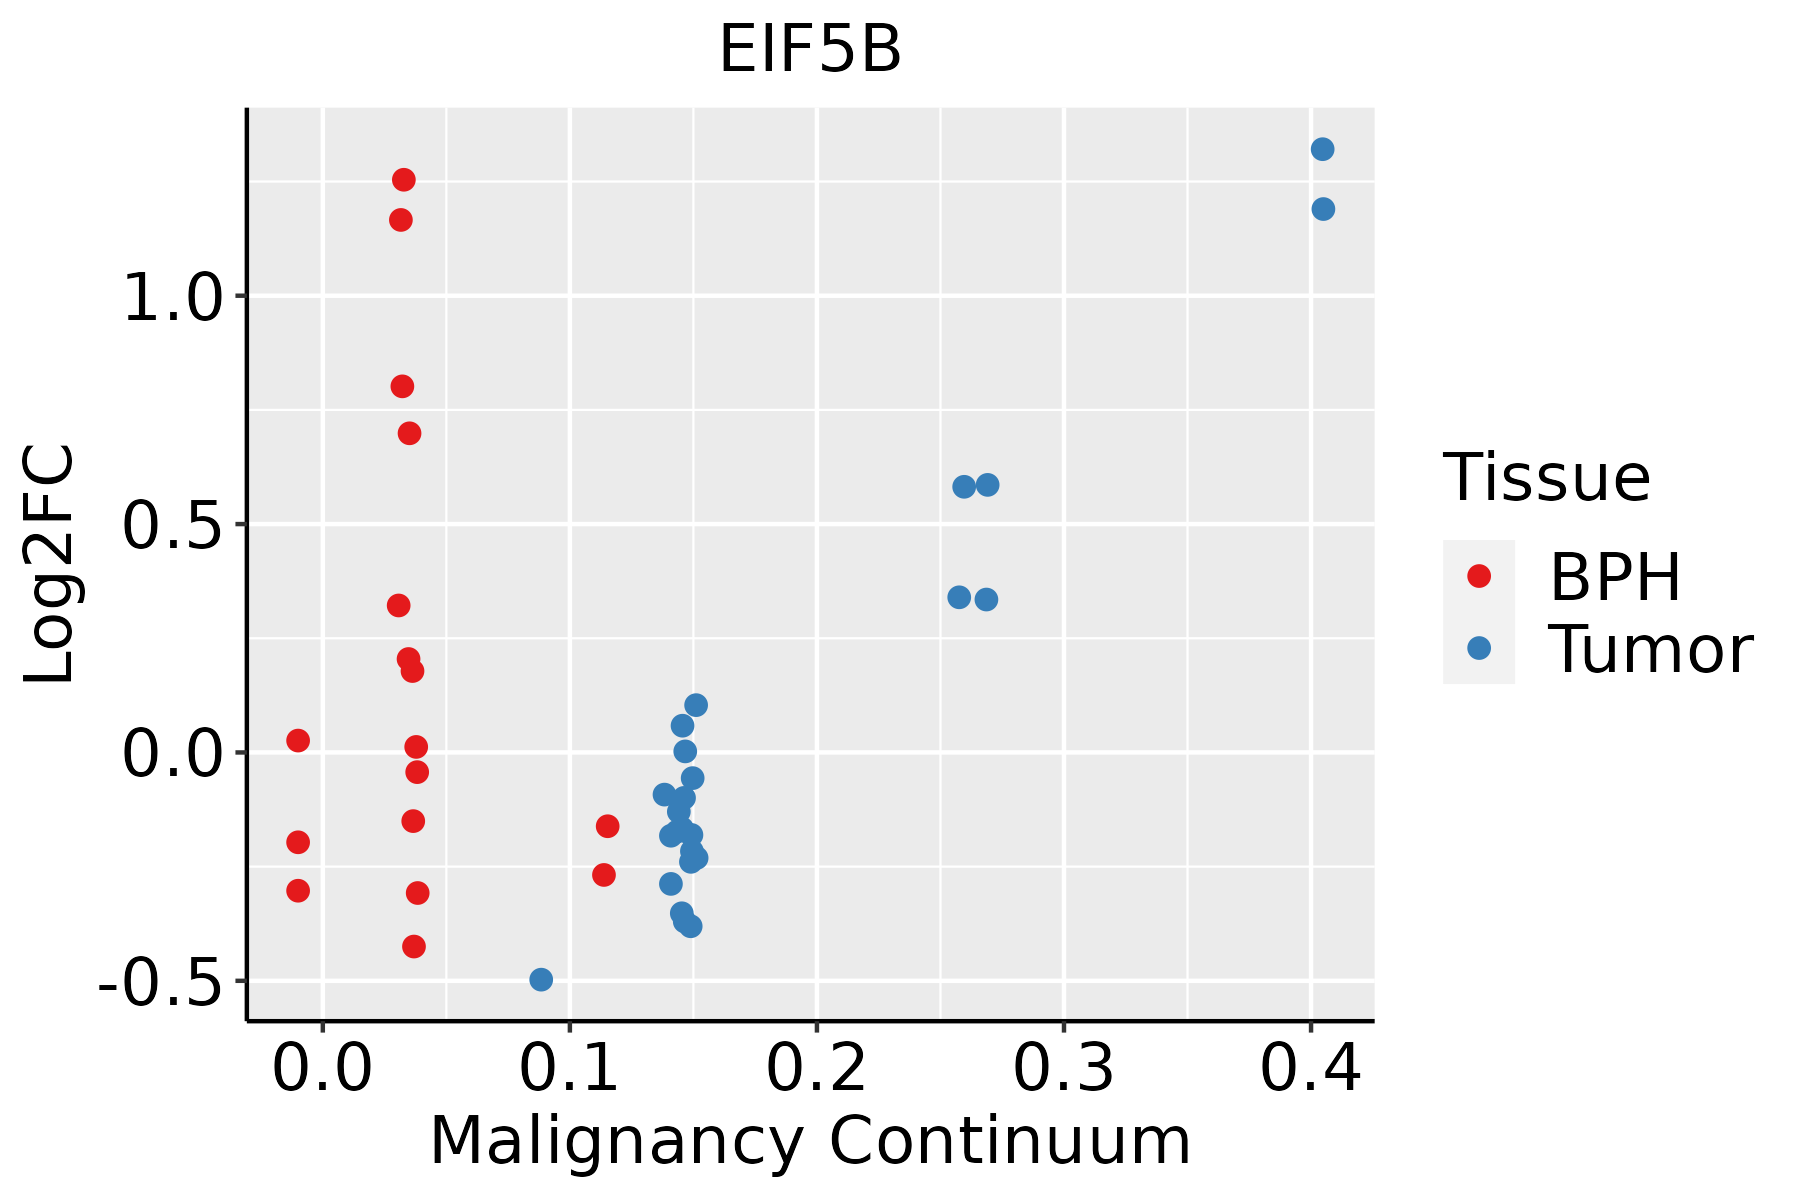
BPH: Benign Prostatic Hyperplasia
SkinThe image shows the transcriptomic changes along malignancy continuum.log2FC in expression of this searched gene in stem-like cells from each diseased tissue sample relative to stem-like cells in normal samples in each tissue plotted against the malignancy continuum. Samples are colored based on if they are from different disease stage.AK: Actinic keratosis
cSCC: Cutaneous squamous cell carcinoma
SCCIS:squamous cell carcinoma in situ
ThyroidThe image shows the transcriptomic changes along malignancy continuum.log2FC in expression of this searched gene in stem-like cells from each diseased tissue sample relative to stem-like cells in normal samples in each tissue plotted against the malignancy continuum. Samples are colored based on if they are from different disease stage.
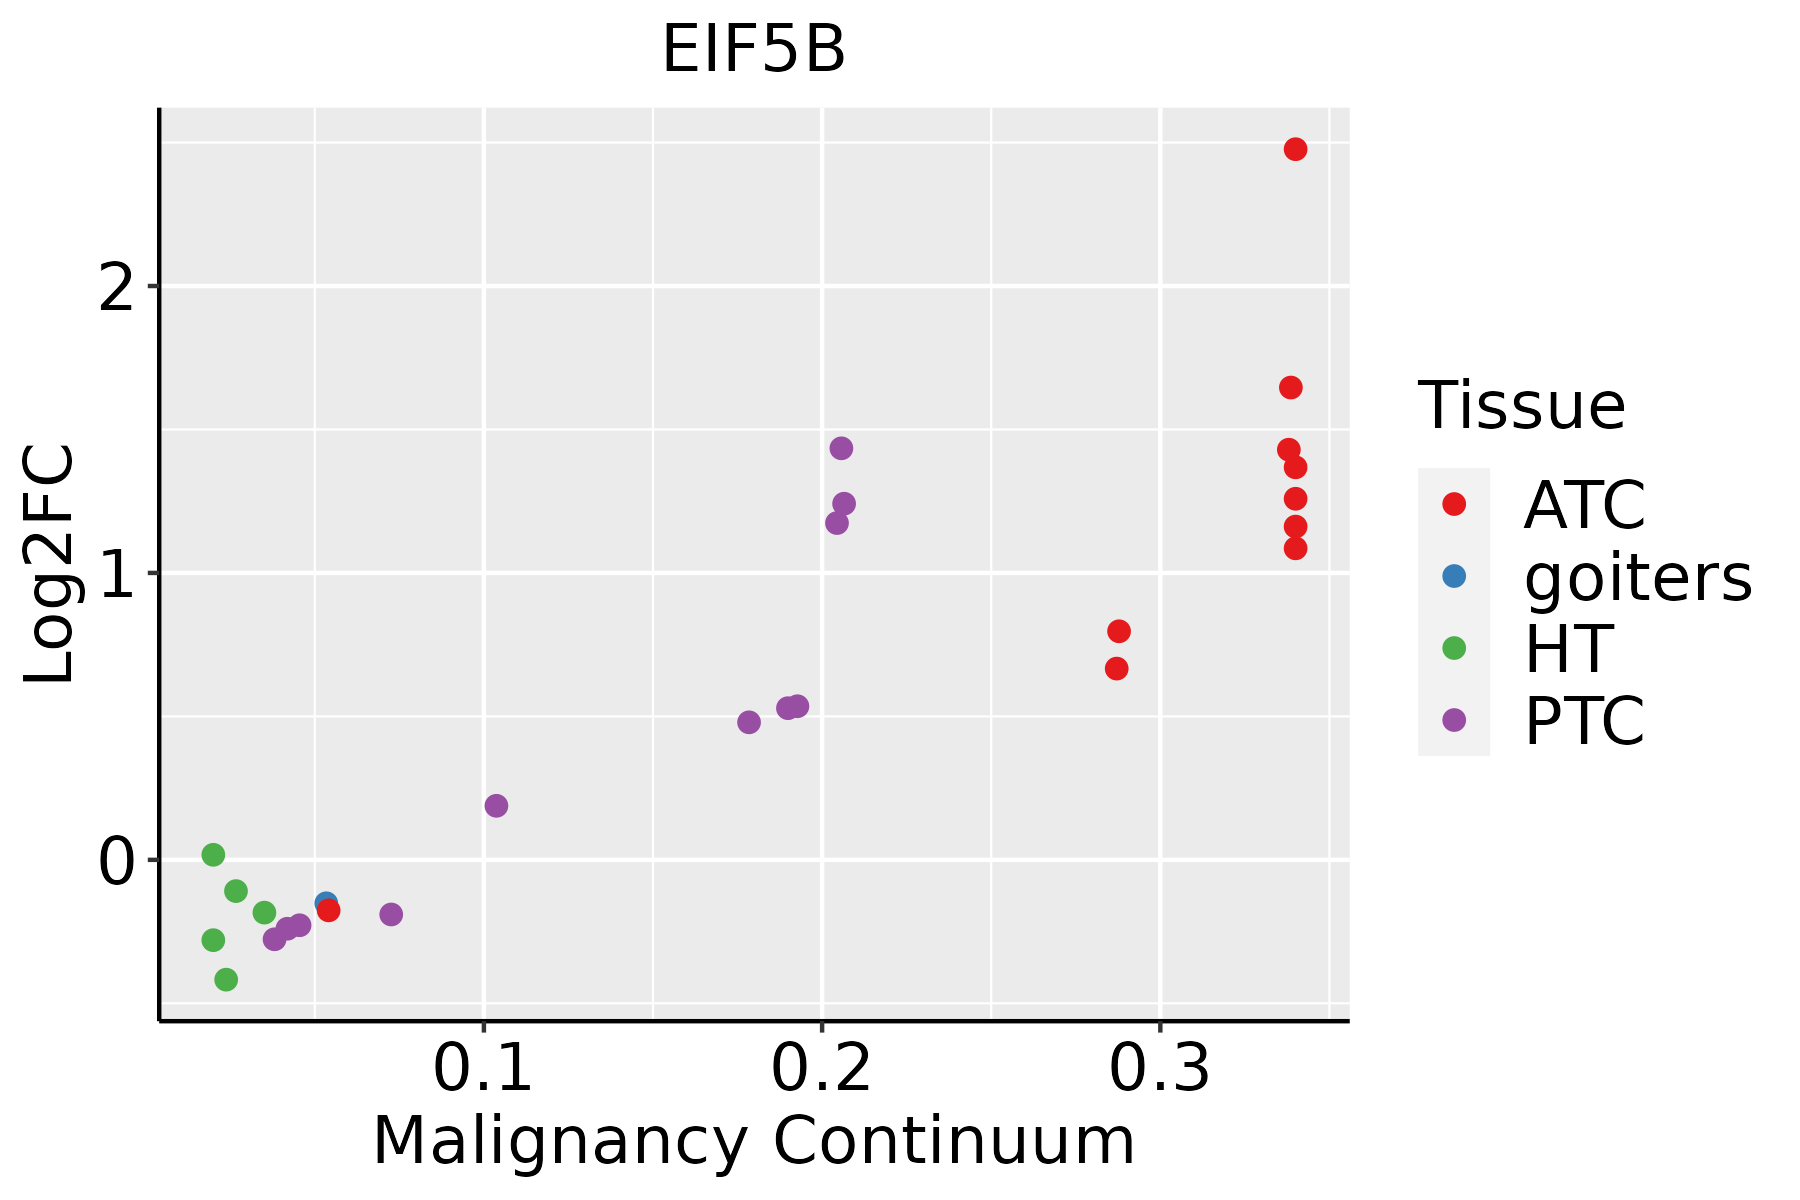
ATC: Anaplastic thyroid cancer
HT: Hashimoto's thyroiditis
PTC: Papillary thyroid cancer
∗log2FC in expression of this searched gene in stem-like cells from each diseased tissue sample relative to stem-like cells in normal samples in each tissue plotted against the malignancy continuum. Samples are colored based on if they are from different disease stage.

Top

Malignant transformation related pathway analysis

check buttonFind out the enriched GO biological processes and KEGG pathways involved in transition from healthy to precancer to cancer
check button Figure of enriched GO biological processes.
TissueDisease StageEnriched GO biological Processes
ColorectumADGO analysis - Figure of enriched GO biological processes: Top 15 enriched GO BP terms are showed in the bar plot of each disease state in each tissue. Each row represents a significant GO biological process which is colored according to the -log10(p.adjust).
ColorectumSERGO analysis - Figure of enriched GO biological processes: Top 15 enriched GO BP terms are showed in the bar plot of each disease state in each tissue. Each row represents a significant GO biological process which is colored according to the -log10(p.adjust).
ColorectumMSSGO analysis - Figure of enriched GO biological processes: Top 15 enriched GO BP terms are showed in the bar plot of each disease state in each tissue. Each row represents a significant GO biological process which is colored according to the -log10(p.adjust).
ColorectumMSI-HGO analysis - Figure of enriched GO biological processes: Top 15 enriched GO BP terms are showed in the bar plot of each disease state in each tissue. Each row represents a significant GO biological process which is colored according to the -log10(p.adjust).
ColorectumFAPGO analysis - Figure of enriched GO biological processes: Top 15 enriched GO BP terms are showed in the bar plot of each disease state in each tissue. Each row represents a significant GO biological process which is colored according to the -log10(p.adjust).
∗Top 15 enriched GO BP terms are showed in the bar plot of each disease state in each tissue. Each row represents a significant GO biological process which is colored according to the -log10(p.adjust).
Page: 1 2 3 4 5 6 7 8 9 

check button Enriched GO biological processes.
GO IDTissueDisease StageDescriptionGene RatioBg Ratiopvaluep.adjustCount
GO:0006417ColorectumADregulation of translation141/3918468/187231.32e-064.22e-05141
GO:0006413ColorectumADtranslational initiation45/3918118/187231.35e-052.92e-0445
GO:0006446ColorectumADregulation of translational initiation28/391879/187232.02e-031.63e-0228
GO:00064174ColorectumFAPregulation of translation111/2622468/187238.47e-091.13e-06111
GO:00064463ColorectumFAPregulation of translational initiation26/262279/187231.54e-054.01e-0426
GO:00064134ColorectumFAPtranslational initiation34/2622118/187232.13e-055.12e-0434
GO:00064175ColorectumCRCregulation of translation82/2078468/187231.79e-055.40e-0482
GO:000641310EndometriumAEHtranslational initiation42/2100118/187232.68e-124.67e-1042
GO:000641716EndometriumAEHregulation of translation94/2100468/187231.14e-087.62e-0794
GO:00064467EndometriumAEHregulation of translational initiation25/210079/187238.99e-073.19e-0525
GO:000641315EndometriumEECtranslational initiation42/2168118/187237.65e-121.24e-0942
GO:000641717EndometriumEECregulation of translation94/2168468/187235.37e-082.88e-0694
GO:000644614EndometriumEECregulation of translational initiation25/216879/187231.62e-065.03e-0525
GO:000641727EsophagusHGINregulation of translation139/2587468/187231.46e-197.98e-17139
GO:000641320EsophagusHGINtranslational initiation55/2587118/187237.33e-182.31e-1555
GO:000644610EsophagusHGINregulation of translational initiation34/258779/187232.09e-101.97e-0834
GO:0006413110EsophagusESCCtranslational initiation100/8552118/187231.16e-181.25e-16100
GO:0006417111EsophagusESCCregulation of translation304/8552468/187231.53e-171.33e-15304
GO:000644617EsophagusESCCregulation of translational initiation65/855279/187232.04e-117.07e-1065
GO:000641312LiverCirrhotictranslational initiation76/4634118/187238.36e-202.18e-1776
Page: 1 2 3 

check button Enriched KEGG pathways.
Pathway IDTissueDisease StageDescriptionGene RatioBg Ratiopvaluep.adjustqvalueCount
Page: 1 

Top

Cell-cell communication analysis

check buttonIdentification of potential cell-cell interactions between two cell types and their ligand-receptor pairs for different disease states
LigandReceptorLRpairPathwayTissueDisease Stage
Page: 1 

Top

Single-cell gene regulatory network inference analysis

check buttonFind out the significant the regulons (TFs) and the target genes of each regulon across cell types for different disease states
TFCell TypeTissueDisease StageTarget GeneRSSRegulon Activity
∗The dot plots of a searched regulon are shown for all cell subpopulations in each disease state of each tissue based on the regulon specific score inferred using pySCENIC and by calculating the average expression.
Page: 1 

Top

Somatic mutation of malignant transformation related genes

check buttonAnnotation of somatic variants for genes involved in malignant transformation
Hugo SymbolVariant ClassVariant ClassificationdbSNP RSHGVScHGVSpHGVSp ShortSWISSPROTBIOTYPESIFTPolyPhenTumor Sample BarcodeTissueHistologySexAgeStageTherapy TypesDrugsOutcome
EIF5BSNVMissense_Mutationc.2817N>Tp.Glu939Aspp.E939DO60841protein_codingtolerated(0.13)possibly_damaging(0.605)TCGA-A2-A25A-01Breastbreast invasive carcinomaFemale<65I/IIUnspecificCytoxanSD
EIF5BSNVMissense_Mutationc.2161G>Cp.Asp721Hisp.D721HO60841protein_codingdeleterious(0)probably_damaging(0.998)TCGA-A8-A085-01Breastbreast invasive carcinomaMale<65I/IIHormone TherapytamoxiphenSD
EIF5BSNVMissense_Mutationc.2641N>Tp.Arg881Cysp.R881CO60841protein_codingtolerated(0.2)benign(0.15)TCGA-AO-A128-01Breastbreast invasive carcinomaFemale<65I/IIChemotherapydoxorubicinSD
EIF5BSNVMissense_Mutationc.2488N>Ap.Gly830Serp.G830SO60841protein_codingdeleterious(0)probably_damaging(1)TCGA-BH-A0HF-01Breastbreast invasive carcinomaFemale>=65I/IIHormone TherapyarimidexSD
EIF5BSNVMissense_Mutationc.1795N>Tp.Arg599Trpp.R599WO60841protein_codingdeleterious(0)possibly_damaging(0.869)TCGA-BH-A0HU-01Breastbreast invasive carcinomaFemale<65I/IIChemotherapydocetaxelSD
EIF5BSNVMissense_Mutationc.3313N>Gp.Arg1105Glyp.R1105GO60841protein_codingdeleterious(0.01)probably_damaging(0.998)TCGA-D8-A1J8-01Breastbreast invasive carcinomaFemale>=65I/IIHormone TherapynolvadexSD
EIF5BSNVMissense_Mutationc.2654N>Cp.Gly885Alap.G885AO60841protein_codingdeleterious(0.01)probably_damaging(0.974)TCGA-E9-A243-01Breastbreast invasive carcinomaFemale<65I/IIChemotherapy5-fluorouracilPD
EIF5BSNVMissense_Mutationc.1672N>Ap.Glu558Lysp.E558KO60841protein_codingtolerated(0.62)benign(0.073)TCGA-C5-A1MK-01Cervixcervical & endocervical cancerFemale>=65III/IVChemotherapycarboplatinPD
EIF5BSNVMissense_Mutationnovelc.916N>Ap.Glu306Lysp.E306KO60841protein_codingdeleterious_low_confidence(0.01)benign(0.012)TCGA-C5-A905-01Cervixcervical & endocervical cancerFemale<65I/IIUnknownUnknownSD
EIF5BSNVMissense_Mutationnovelc.1931N>Gp.Lys644Argp.K644RO60841protein_codingdeleterious(0.01)probably_damaging(0.999)TCGA-DS-A1OD-01Cervixcervical & endocervical cancerFemale<65I/IIChemotherapycisplatinSD
Page: 1 2 3 4 5 6 7 8 9 10 11 12 13 

Top

Related drugs of malignant transformation related genes

check buttonIdentification of chemicals and drugs interact with genes involved in malignant transfromation
(DGIdb 4.0)
Entrez IDSymbolCategoryInteraction TypesDrug Claim NameDrug NamePMIDs
Page: 1