
|
|||||
|
 | |
| |
| |
| |
| |
| |
|
Gene: EIF5A2 |
Gene summary for EIF5A2 |
| Gene information | Species | Human | Gene symbol | EIF5A2 | Gene ID | 56648 |
| Gene name | eukaryotic translation initiation factor 5A2 | |
| Gene Alias | EIF-5A2 | |
| Cytomap | 3q26.2 | |
| Gene Type | protein-coding | GO ID | GO:0000003 | UniProtAcc | Q9GZV4 |
Top |
Malignant transformation analysis |
| Identification of the aberrant gene expression in precancerous and cancerous lesions by comparing the gene expression of stem-like cells in diseased tissues with normal stem cells |
| Entrez ID | Symbol | Replicates | Species | Organ | Tissue | Adj P-value | Log2FC | Malignancy |
| 56648 | EIF5A2 | LZE4T | Human | Esophagus | ESCC | 4.59e-06 | 2.58e-01 | 0.0811 |
| 56648 | EIF5A2 | LZE7T | Human | Esophagus | ESCC | 8.66e-05 | 2.86e-01 | 0.0667 |
| 56648 | EIF5A2 | LZE24T | Human | Esophagus | ESCC | 1.19e-07 | 2.14e-01 | 0.0596 |
| 56648 | EIF5A2 | LZE6T | Human | Esophagus | ESCC | 6.51e-06 | 3.23e-01 | 0.0845 |
| 56648 | EIF5A2 | P1T-E | Human | Esophagus | ESCC | 9.03e-04 | 1.90e-01 | 0.0875 |
| 56648 | EIF5A2 | P2T-E | Human | Esophagus | ESCC | 2.91e-27 | 4.94e-01 | 0.1177 |
| 56648 | EIF5A2 | P4T-E | Human | Esophagus | ESCC | 9.19e-11 | 2.22e-01 | 0.1323 |
| 56648 | EIF5A2 | P5T-E | Human | Esophagus | ESCC | 2.74e-10 | 2.68e-01 | 0.1327 |
| 56648 | EIF5A2 | P8T-E | Human | Esophagus | ESCC | 7.19e-06 | 2.21e-01 | 0.0889 |
| 56648 | EIF5A2 | P9T-E | Human | Esophagus | ESCC | 6.00e-08 | 2.21e-01 | 0.1131 |
| 56648 | EIF5A2 | P10T-E | Human | Esophagus | ESCC | 1.02e-17 | 3.29e-01 | 0.116 |
| 56648 | EIF5A2 | P11T-E | Human | Esophagus | ESCC | 7.86e-11 | 5.53e-01 | 0.1426 |
| 56648 | EIF5A2 | P12T-E | Human | Esophagus | ESCC | 1.04e-31 | 6.74e-01 | 0.1122 |
| 56648 | EIF5A2 | P15T-E | Human | Esophagus | ESCC | 7.80e-11 | 3.24e-01 | 0.1149 |
| 56648 | EIF5A2 | P16T-E | Human | Esophagus | ESCC | 6.71e-11 | 1.32e-01 | 0.1153 |
| 56648 | EIF5A2 | P17T-E | Human | Esophagus | ESCC | 1.36e-08 | 2.53e-01 | 0.1278 |
| 56648 | EIF5A2 | P21T-E | Human | Esophagus | ESCC | 2.02e-15 | 3.64e-01 | 0.1617 |
| 56648 | EIF5A2 | P22T-E | Human | Esophagus | ESCC | 7.73e-18 | 3.79e-01 | 0.1236 |
| 56648 | EIF5A2 | P23T-E | Human | Esophagus | ESCC | 4.15e-10 | 2.52e-01 | 0.108 |
| 56648 | EIF5A2 | P24T-E | Human | Esophagus | ESCC | 1.85e-05 | 1.04e-01 | 0.1287 |
| Page: 1 2 3 4 |
| Tissue | Expression Dynamics | Abbreviation |
| Esophagus | 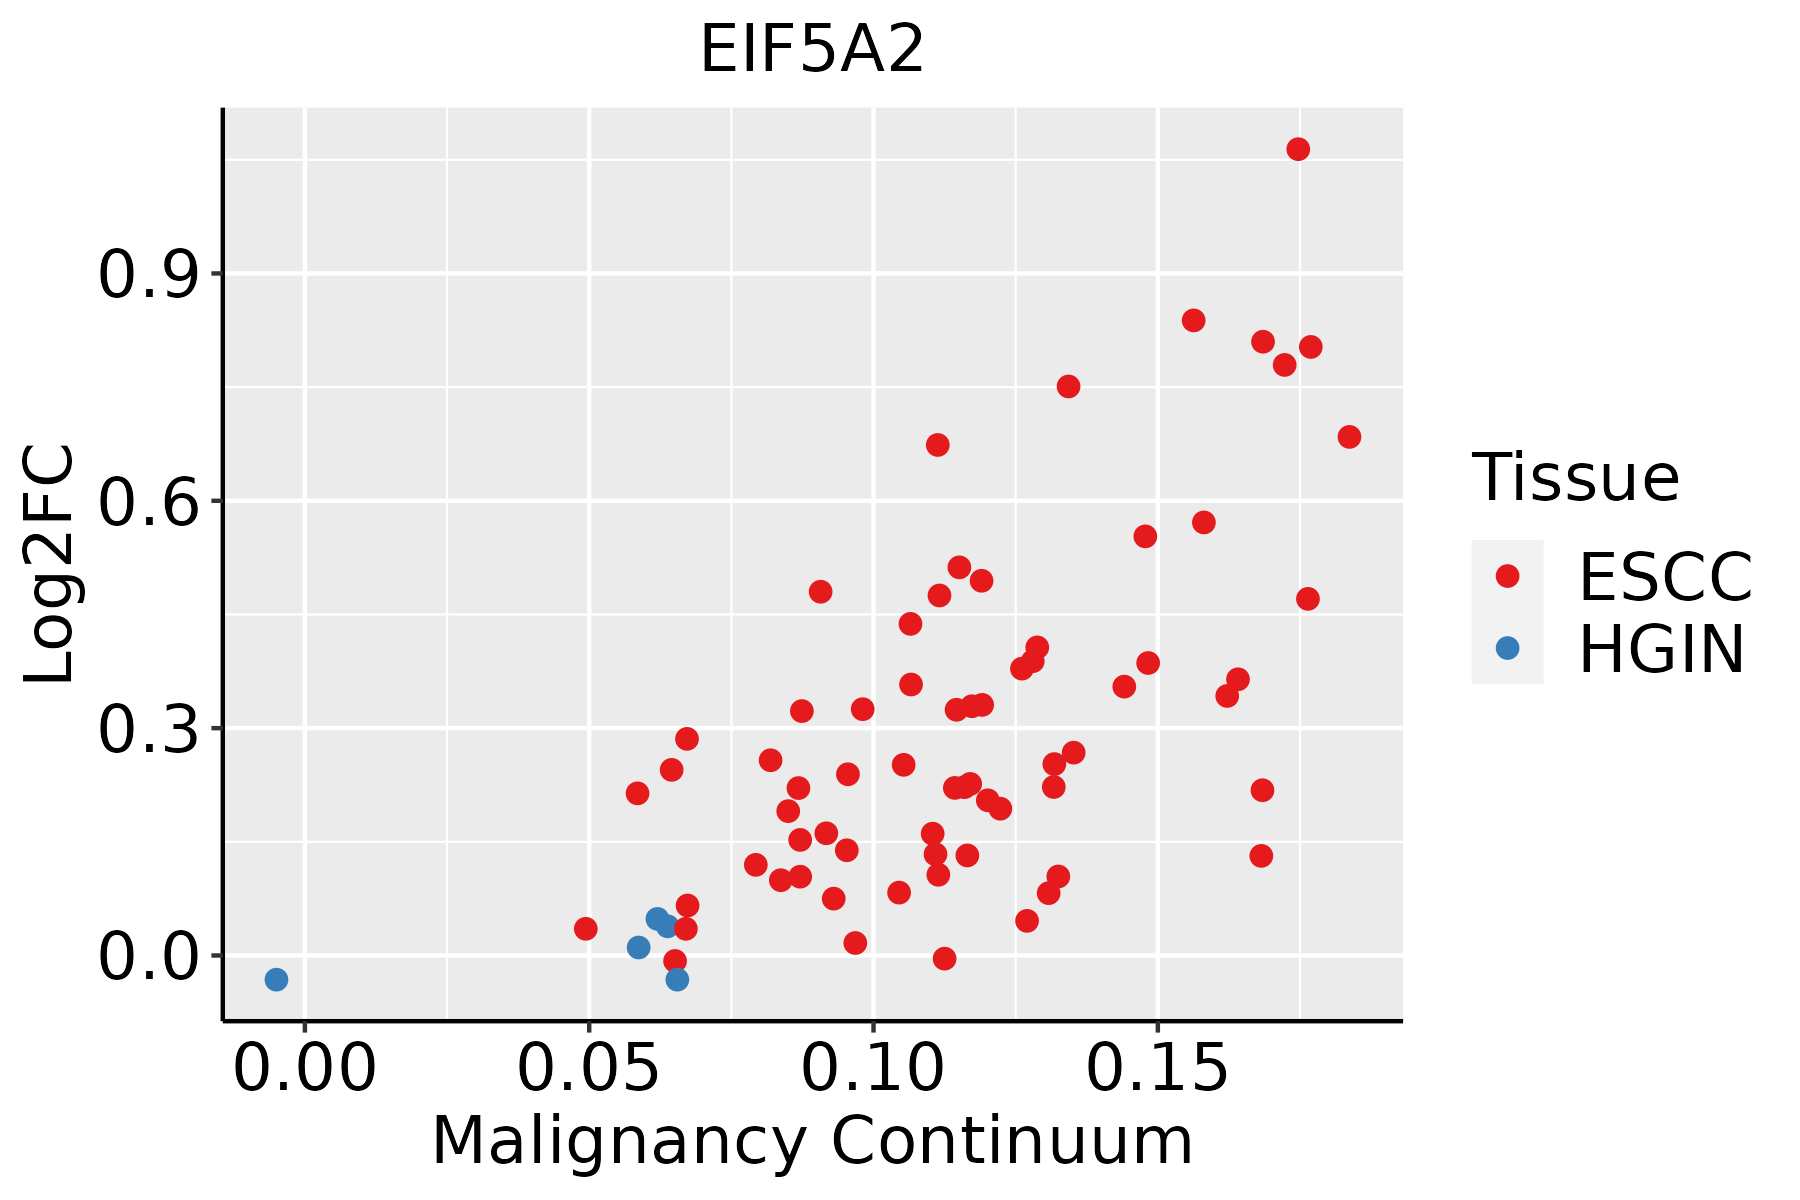 | ESCC: Esophageal squamous cell carcinoma |
| HGIN: High-grade intraepithelial neoplasias | ||
| LGIN: Low-grade intraepithelial neoplasias | ||
| Oral Cavity | 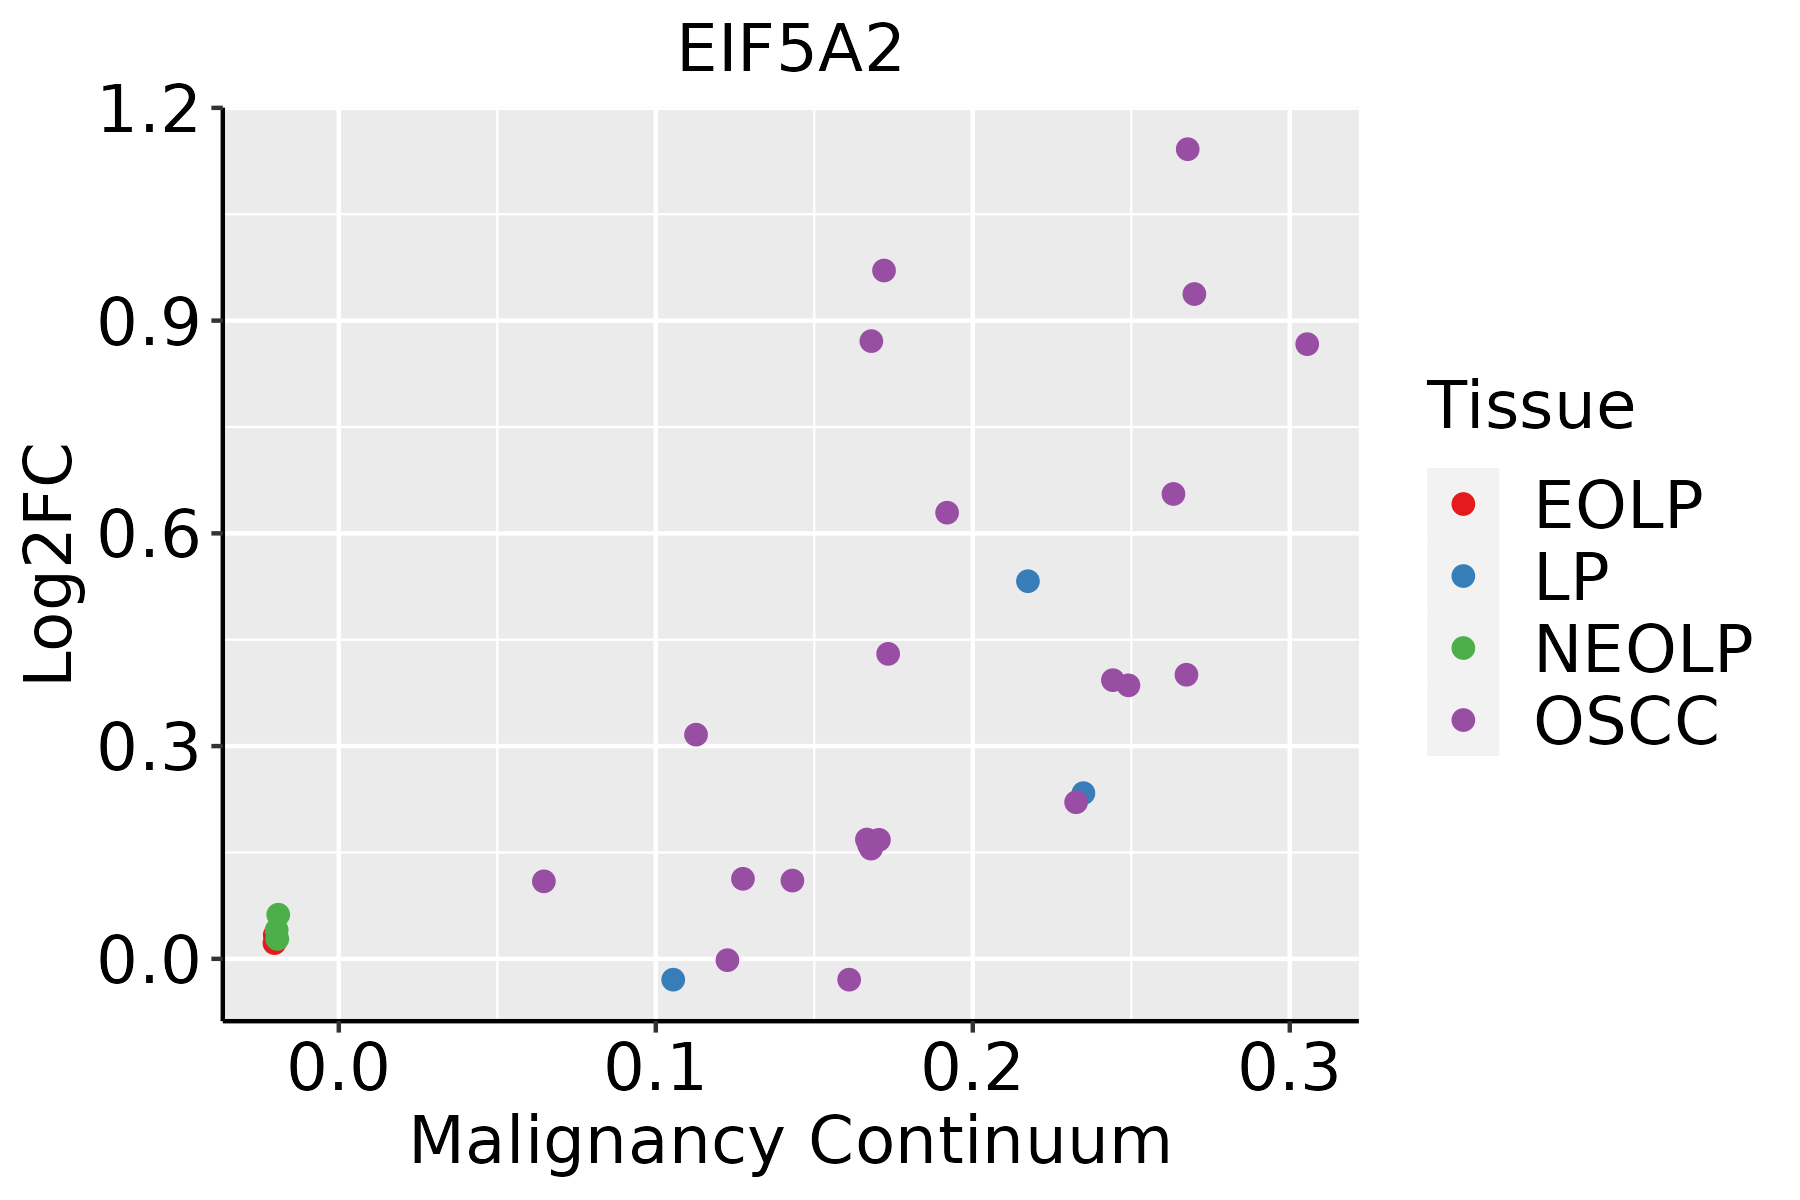 | EOLP: Erosive Oral lichen planus |
| LP: leukoplakia | ||
| NEOLP: Non-erosive oral lichen planus | ||
| OSCC: Oral squamous cell carcinoma |
| ∗log2FC in expression of this searched gene in stem-like cells from each diseased tissue sample relative to stem-like cells in normal samples in each tissue plotted against the malignancy continuum. Samples are colored based on if they are from different disease stage. |
Top |
Malignant transformation related pathway analysis |
| Find out the enriched GO biological processes and KEGG pathways involved in transition from healthy to precancer to cancer |
| Tissue | Disease Stage | Enriched GO biological Processes |
| Colorectum | AD |  |
| Colorectum | SER |  |
| Colorectum | MSS |  |
| Colorectum | MSI-H |  |
| Colorectum | FAP |  |
| ∗Top 15 enriched GO BP terms are showed in the bar plot of each disease state in each tissue. Each row represents a significant GO biological process which is colored according to the -log10(p.adjust). |
| Page: 1 2 3 4 5 6 7 8 9 |
| GO ID | Tissue | Disease Stage | Description | Gene Ratio | Bg Ratio | pvalue | p.adjust | Count |
| GO:0006403110 | Esophagus | ESCC | RNA localization | 166/8552 | 201/18723 | 1.95e-27 | 6.18e-25 | 166 |
| GO:0022411111 | Esophagus | ESCC | cellular component disassembly | 305/8552 | 443/18723 | 1.94e-23 | 4.57e-21 | 305 |
| GO:005123617 | Esophagus | ESCC | establishment of RNA localization | 134/8552 | 166/18723 | 1.23e-20 | 1.81e-18 | 134 |
| GO:005102815 | Esophagus | ESCC | mRNA transport | 110/8552 | 130/18723 | 2.76e-20 | 3.80e-18 | 110 |
| GO:005065717 | Esophagus | ESCC | nucleic acid transport | 131/8552 | 163/18723 | 6.94e-20 | 8.46e-18 | 131 |
| GO:005065817 | Esophagus | ESCC | RNA transport | 131/8552 | 163/18723 | 6.94e-20 | 8.46e-18 | 131 |
| GO:0006417111 | Esophagus | ESCC | regulation of translation | 304/8552 | 468/18723 | 1.53e-17 | 1.33e-15 | 304 |
| GO:001593117 | Esophagus | ESCC | nucleobase-containing compound transport | 162/8552 | 222/18723 | 9.87e-17 | 7.93e-15 | 162 |
| GO:0045727111 | Esophagus | ESCC | positive regulation of translation | 107/8552 | 136/18723 | 2.79e-15 | 1.68e-13 | 107 |
| GO:0034250111 | Esophagus | ESCC | positive regulation of cellular amide metabolic process | 123/8552 | 162/18723 | 3.32e-15 | 1.93e-13 | 123 |
| GO:003298416 | Esophagus | ESCC | protein-containing complex disassembly | 151/8552 | 224/18723 | 3.45e-11 | 1.15e-09 | 151 |
| GO:000641419 | Esophagus | ESCC | translational elongation | 41/8552 | 55/18723 | 1.26e-05 | 1.16e-04 | 41 |
| GO:00432446 | Esophagus | ESCC | regulation of protein-containing complex disassembly | 75/8552 | 121/18723 | 2.17e-04 | 1.36e-03 | 75 |
| GO:00436245 | Esophagus | ESCC | cellular protein complex disassembly | 78/8552 | 136/18723 | 4.00e-03 | 1.62e-02 | 78 |
| GO:002241119 | Oral cavity | OSCC | cellular component disassembly | 283/7305 | 443/18723 | 9.57e-27 | 3.37e-24 | 283 |
| GO:000640318 | Oral cavity | OSCC | RNA localization | 150/7305 | 201/18723 | 6.90e-25 | 1.98e-22 | 150 |
| GO:00510287 | Oral cavity | OSCC | mRNA transport | 101/7305 | 130/18723 | 2.19e-19 | 3.15e-17 | 101 |
| GO:005065714 | Oral cavity | OSCC | nucleic acid transport | 120/7305 | 163/18723 | 2.31e-19 | 3.18e-17 | 120 |
| GO:005065814 | Oral cavity | OSCC | RNA transport | 120/7305 | 163/18723 | 2.31e-19 | 3.18e-17 | 120 |
| GO:005123614 | Oral cavity | OSCC | establishment of RNA localization | 121/7305 | 166/18723 | 6.38e-19 | 8.24e-17 | 121 |
| Page: 1 2 |
| Pathway ID | Tissue | Disease Stage | Description | Gene Ratio | Bg Ratio | pvalue | p.adjust | qvalue | Count |
| Page: 1 |
Top |
Cell-cell communication analysis |
| Identification of potential cell-cell interactions between two cell types and their ligand-receptor pairs for different disease states |
| Ligand | Receptor | LRpair | Pathway | Tissue | Disease Stage |
| Page: 1 |
Top |
Single-cell gene regulatory network inference analysis |
| Find out the significant the regulons (TFs) and the target genes of each regulon across cell types for different disease states |
| TF | Cell Type | Tissue | Disease Stage | Target Gene | RSS | Regulon Activity |
| EIF5A2 | TRANS | Cervix | HSIL_HPV | CEBPE,LINC02693,IL33, etc. | 6.07e-02 |  |
| EIF5A2 | TRANS | Cervix | N_HPV | CEBPE,LINC02693,IL33, etc. | 1.61e-01 |  |
| EIF5A2 | GOB | Stomach | Healthy | GGH,SNHG5,BCAR1, etc. | 4.05e-01 |  |
| ∗The dot plots of a searched regulon are shown for all cell subpopulations in each disease state of each tissue based on the regulon specific score inferred using pySCENIC and by calculating the average expression. |
| Page: 1 |
Top |
Somatic mutation of malignant transformation related genes |
| Annotation of somatic variants for genes involved in malignant transformation |
| Hugo Symbol | Variant Class | Variant Classification | dbSNP RS | HGVSc | HGVSp | HGVSp Short | SWISSPROT | BIOTYPE | SIFT | PolyPhen | Tumor Sample Barcode | Tissue | Histology | Sex | Age | Stage | Therapy Types | Drugs | Outcome |
| EIF5A2 | SNV | Missense_Mutation | c.257N>T | p.Arg86Ile | p.R86I | Q9GZV4 | protein_coding | deleterious(0) | probably_damaging(0.974) | TCGA-AA-3510-01 | Colorectum | colon adenocarcinoma | Male | >=65 | I/II | Unknown | Unknown | SD | |
| EIF5A2 | SNV | Missense_Mutation | rs761918940 | c.325N>T | p.Arg109Cys | p.R109C | Q9GZV4 | protein_coding | deleterious(0.02) | benign(0.222) | TCGA-CA-6717-01 | Colorectum | colon adenocarcinoma | Male | <65 | I/II | Chemotherapy | oxaliplatin | CR |
| EIF5A2 | SNV | Missense_Mutation | c.257N>T | p.Arg86Ile | p.R86I | Q9GZV4 | protein_coding | deleterious(0) | probably_damaging(0.974) | TCGA-F5-6814-01 | Colorectum | rectum adenocarcinoma | Male | <65 | I/II | Unknown | Unknown | SD | |
| EIF5A2 | SNV | Missense_Mutation | rs747942434 | c.10N>A | p.Glu4Lys | p.E4K | Q9GZV4 | protein_coding | deleterious(0.01) | benign(0.178) | TCGA-F5-6814-01 | Colorectum | rectum adenocarcinoma | Male | <65 | I/II | Unknown | Unknown | SD |
| EIF5A2 | SNV | Missense_Mutation | novel | c.278N>A | p.Cys93Tyr | p.C93Y | Q9GZV4 | protein_coding | tolerated(0.08) | benign(0.001) | TCGA-A5-A1OF-01 | Endometrium | uterine corpus endometrioid carcinoma | Female | <65 | I/II | Unknown | Unknown | SD |
| EIF5A2 | SNV | Missense_Mutation | rs761918940 | c.325N>T | p.Arg109Cys | p.R109C | Q9GZV4 | protein_coding | deleterious(0.02) | benign(0.222) | TCGA-AJ-A3EL-01 | Endometrium | uterine corpus endometrioid carcinoma | Female | <65 | I/II | Unknown | Unknown | SD |
| EIF5A2 | SNV | Missense_Mutation | rs747942434 | c.10G>A | p.Glu4Lys | p.E4K | Q9GZV4 | protein_coding | deleterious(0.01) | benign(0.178) | TCGA-AP-A056-01 | Endometrium | uterine corpus endometrioid carcinoma | Female | <65 | I/II | Unknown | Unknown | SD |
| EIF5A2 | SNV | Missense_Mutation | novel | c.76C>T | p.Arg26Cys | p.R26C | Q9GZV4 | protein_coding | tolerated(0.06) | benign(0.009) | TCGA-AP-A1E0-01 | Endometrium | uterine corpus endometrioid carcinoma | Female | <65 | III/IV | Chemotherapy | paclitaxel | SD |
| EIF5A2 | SNV | Missense_Mutation | novel | c.283C>A | p.Gln95Lys | p.Q95K | Q9GZV4 | protein_coding | tolerated(0.25) | benign(0.003) | TCGA-AX-A2HC-01 | Endometrium | uterine corpus endometrioid carcinoma | Female | <65 | III/IV | Chemotherapy | paclitaxel | PD |
| EIF5A2 | SNV | Missense_Mutation | novel | c.67N>G | p.Ser23Ala | p.S23A | Q9GZV4 | protein_coding | deleterious(0.01) | possibly_damaging(0.744) | TCGA-EY-A2OM-01 | Endometrium | uterine corpus endometrioid carcinoma | Female | <65 | I/II | Chemotherapy | taxol | SD |
| Page: 1 2 3 |
Top |
Related drugs of malignant transformation related genes |
| Identification of chemicals and drugs interact with genes involved in malignant transfromation |
| (DGIdb 4.0) |
| Entrez ID | Symbol | Category | Interaction Types | Drug Claim Name | Drug Name | PMIDs |
| Page: 1 |

Copyright 2023-Present -The University of Texas Health Science Center at Houston |