
|
|||||
|
 | |
| |
| |
| |
| |
| |
|
Gene: EIF4G3 |
Gene summary for EIF4G3 |
| Gene information | Species | Human | Gene symbol | EIF4G3 | Gene ID | 8672 |
| Gene name | eukaryotic translation initiation factor 4 gamma 3 | |
| Gene Alias | eIF-4G 3 | |
| Cytomap | 1p36.12 | |
| Gene Type | protein-coding | GO ID | GO:0006412 | UniProtAcc | A0A0A0MSA7 |
Top |
Malignant transformation analysis |
| Identification of the aberrant gene expression in precancerous and cancerous lesions by comparing the gene expression of stem-like cells in diseased tissues with normal stem cells |
| Entrez ID | Symbol | Replicates | Species | Organ | Tissue | Adj P-value | Log2FC | Malignancy |
| 8672 | EIF4G3 | CA_HPV_1 | Human | Cervix | CC | 4.01e-02 | 4.60e-02 | 0.0264 |
| 8672 | EIF4G3 | CCI_1 | Human | Cervix | CC | 3.24e-14 | 1.74e+00 | 0.528 |
| 8672 | EIF4G3 | CCI_2 | Human | Cervix | CC | 4.94e-06 | 9.24e-01 | 0.5249 |
| 8672 | EIF4G3 | CCI_3 | Human | Cervix | CC | 8.56e-21 | 1.55e+00 | 0.516 |
| 8672 | EIF4G3 | HTA11_3410_2000001011 | Human | Colorectum | AD | 2.75e-43 | -8.06e-01 | 0.0155 |
| 8672 | EIF4G3 | HTA11_2951_2000001011 | Human | Colorectum | AD | 1.05e-18 | -9.29e-01 | 0.0216 |
| 8672 | EIF4G3 | HTA11_347_2000001011 | Human | Colorectum | AD | 8.44e-34 | 1.21e+00 | -0.1954 |
| 8672 | EIF4G3 | HTA11_411_2000001011 | Human | Colorectum | SER | 5.86e-07 | 5.63e-01 | -0.2602 |
| 8672 | EIF4G3 | HTA11_1391_2000001011 | Human | Colorectum | AD | 2.23e-03 | 4.21e-01 | -0.059 |
| 8672 | EIF4G3 | HTA11_7862_2000001011 | Human | Colorectum | AD | 1.80e-03 | -3.80e-01 | -0.0179 |
| 8672 | EIF4G3 | HTA11_866_3004761011 | Human | Colorectum | AD | 8.63e-15 | -6.50e-01 | 0.096 |
| 8672 | EIF4G3 | HTA11_9408_2000001011 | Human | Colorectum | AD | 2.70e-06 | -8.40e-01 | 0.0451 |
| 8672 | EIF4G3 | HTA11_8622_2000001021 | Human | Colorectum | SER | 7.71e-06 | -5.47e-01 | 0.0528 |
| 8672 | EIF4G3 | HTA11_7696_3000711011 | Human | Colorectum | AD | 1.97e-10 | -4.95e-01 | 0.0674 |
| 8672 | EIF4G3 | HTA11_7469_2000001011 | Human | Colorectum | AD | 3.70e-02 | -5.07e-01 | -0.0124 |
| 8672 | EIF4G3 | HTA11_11156_2000001011 | Human | Colorectum | AD | 1.06e-03 | -7.74e-01 | 0.0397 |
| 8672 | EIF4G3 | HTA11_6818_2000001021 | Human | Colorectum | AD | 4.64e-16 | -8.34e-01 | 0.0588 |
| 8672 | EIF4G3 | HTA11_99999970781_79442 | Human | Colorectum | MSS | 3.09e-19 | -5.29e-01 | 0.294 |
| 8672 | EIF4G3 | HTA11_99999973899_84307 | Human | Colorectum | MSS | 3.53e-05 | -6.18e-01 | 0.2585 |
| 8672 | EIF4G3 | HTA11_99999974143_84620 | Human | Colorectum | MSS | 8.76e-20 | -6.15e-01 | 0.3005 |
| Page: 1 2 3 4 5 6 7 8 9 10 11 12 |
| Tissue | Expression Dynamics | Abbreviation |
| Cervix | 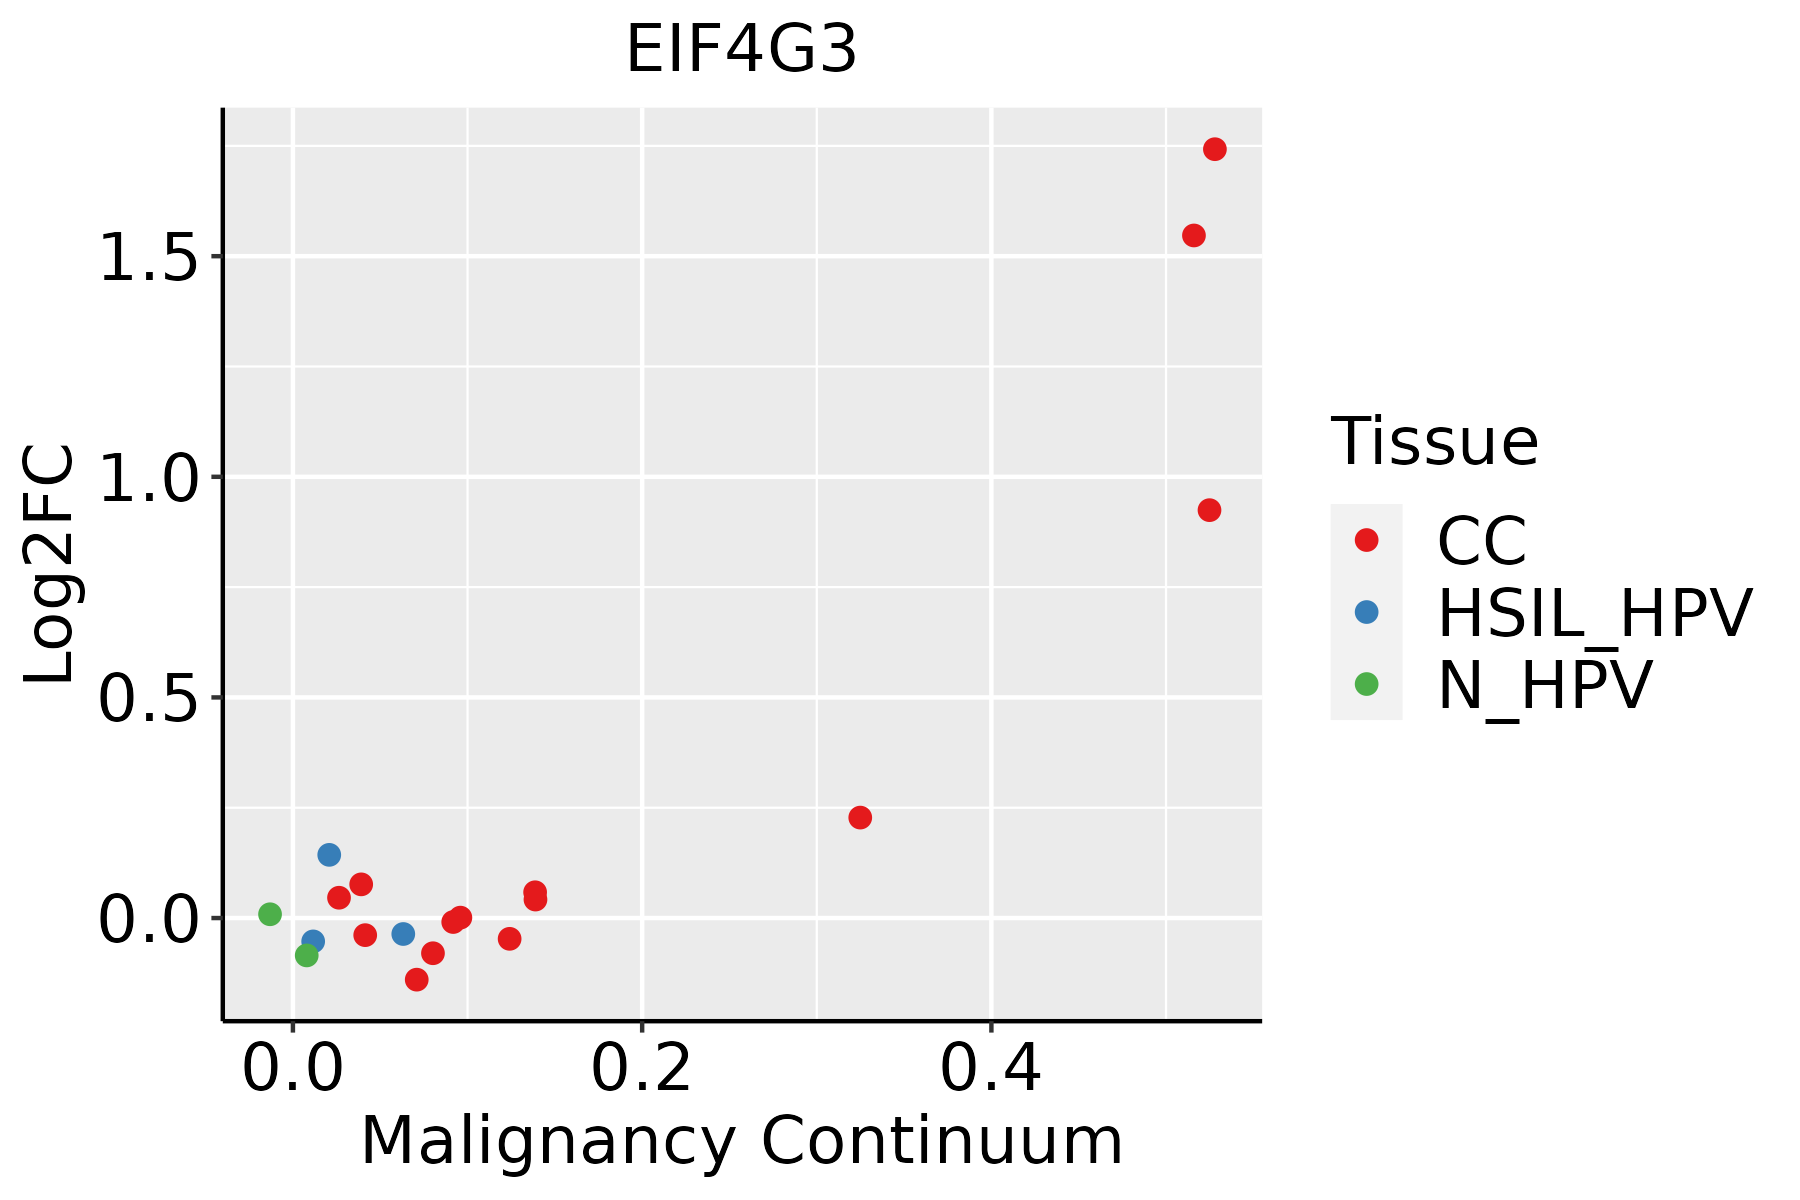 | CC: Cervix cancer |
| HSIL_HPV: HPV-infected high-grade squamous intraepithelial lesions | ||
| N_HPV: HPV-infected normal cervix | ||
| Colorectum (GSE201348) |  | FAP: Familial adenomatous polyposis |
| CRC: Colorectal cancer | ||
| Colorectum (HTA11) |  | AD: Adenomas |
| SER: Sessile serrated lesions | ||
| MSI-H: Microsatellite-high colorectal cancer | ||
| MSS: Microsatellite stable colorectal cancer | ||
| Endometrium | 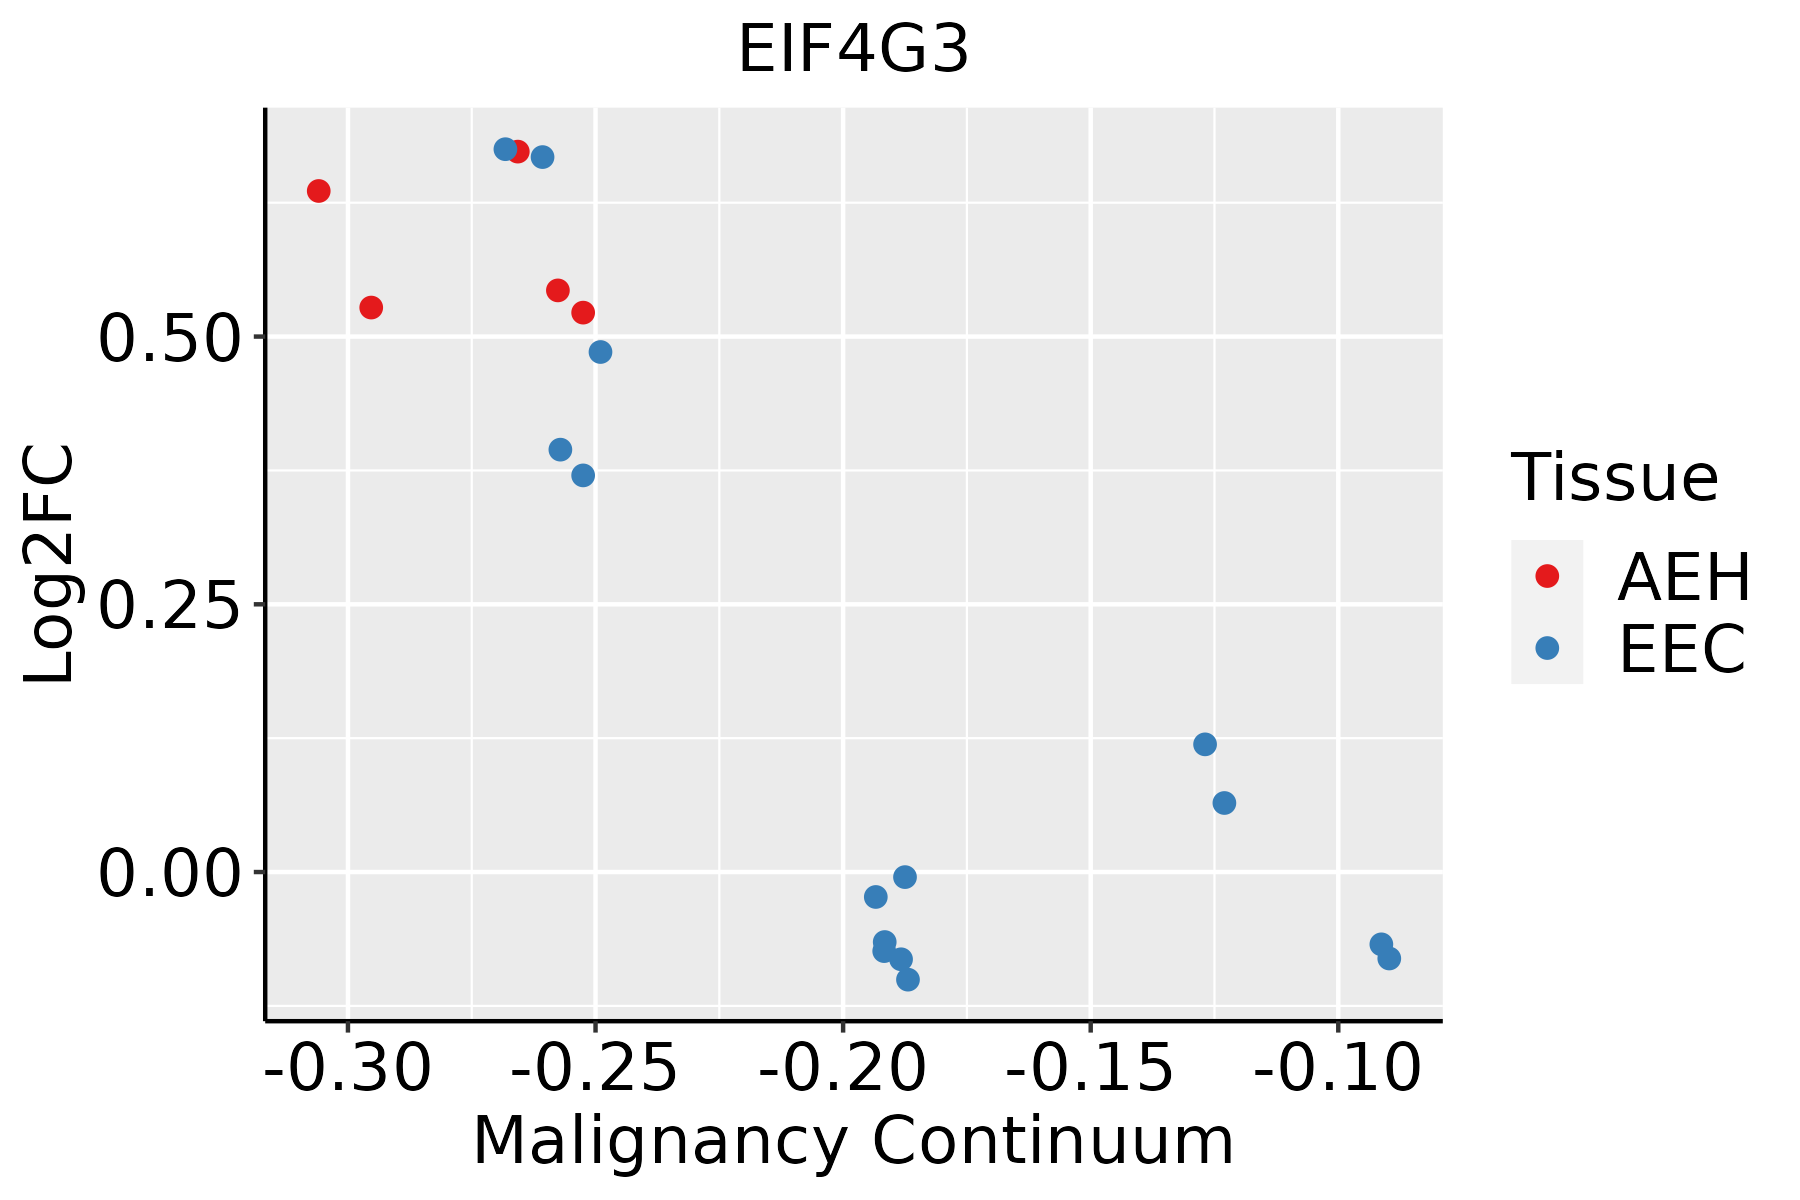 | AEH: Atypical endometrial hyperplasia |
| EEC: Endometrioid Cancer | ||
| Esophagus | 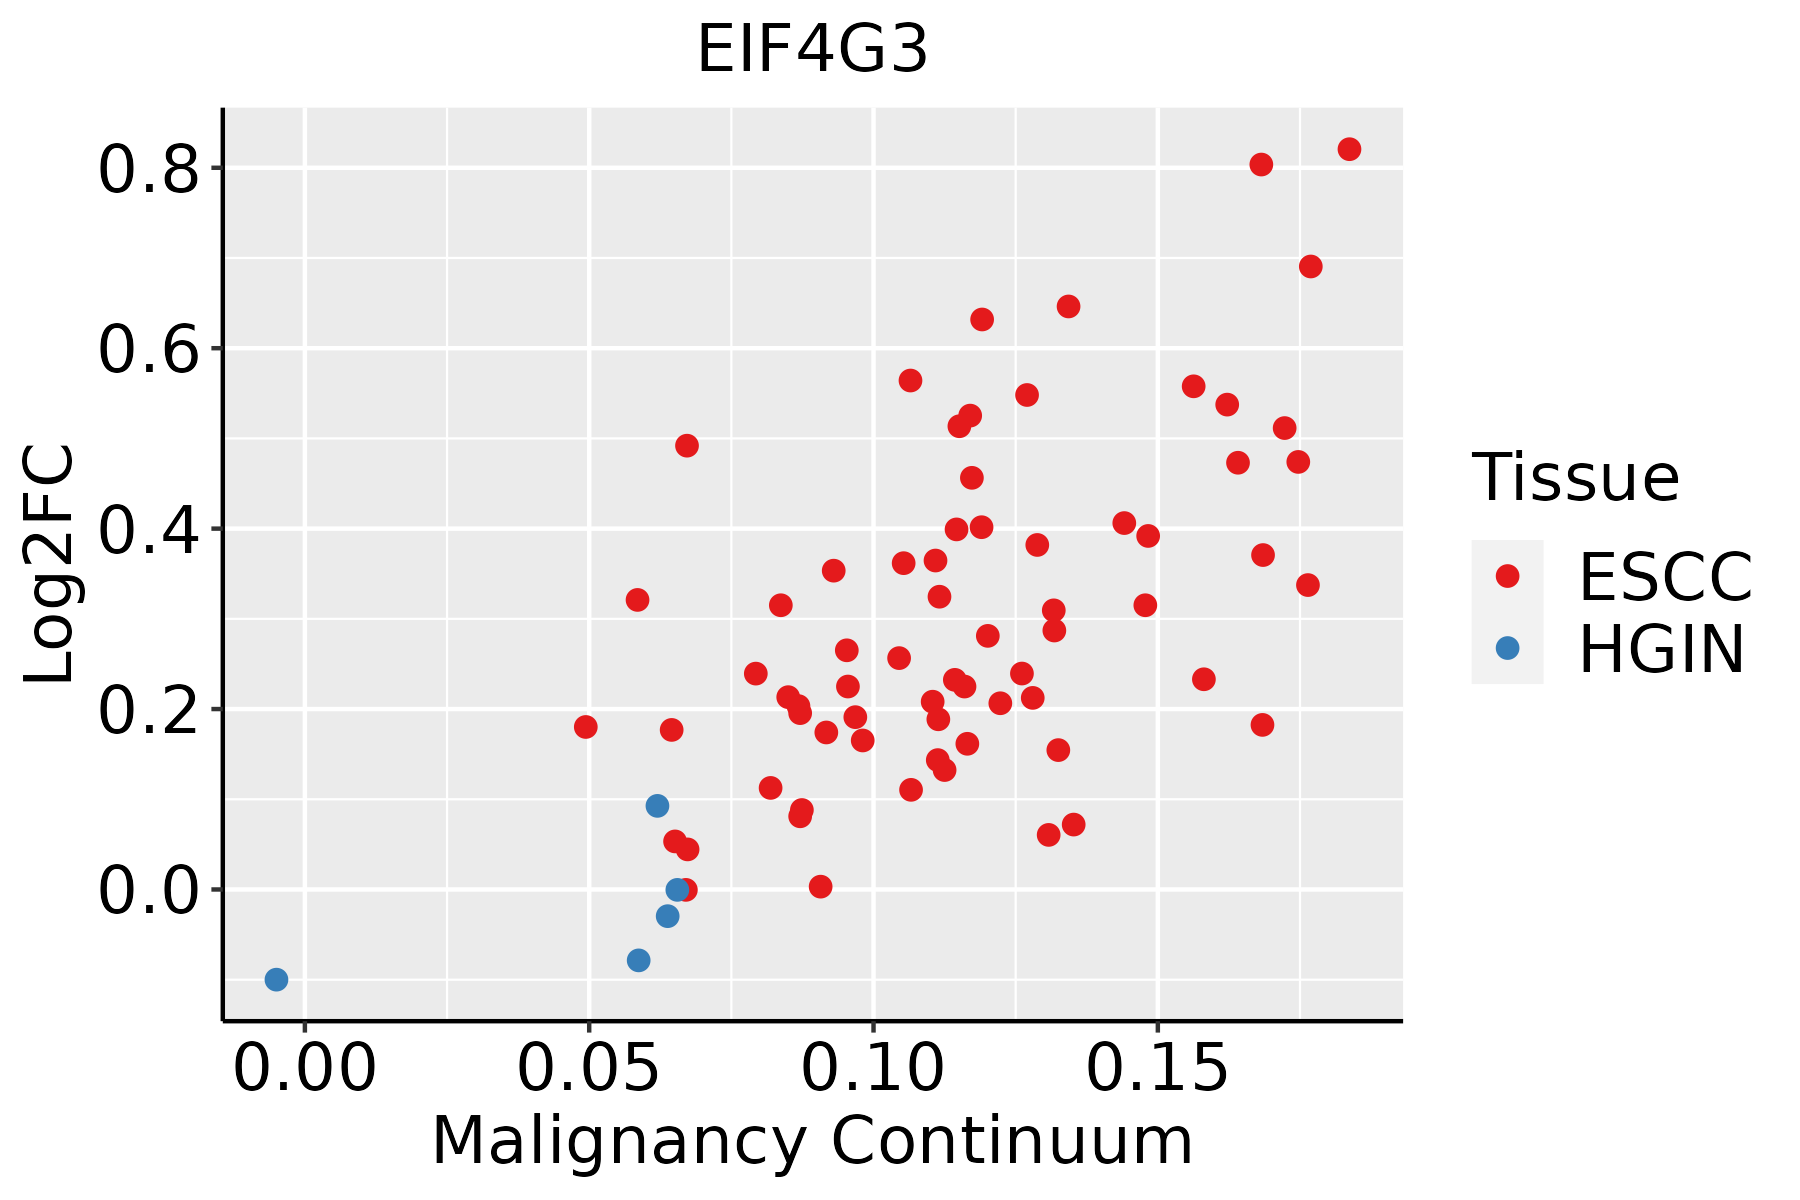 | ESCC: Esophageal squamous cell carcinoma |
| HGIN: High-grade intraepithelial neoplasias | ||
| LGIN: Low-grade intraepithelial neoplasias | ||
| GC | 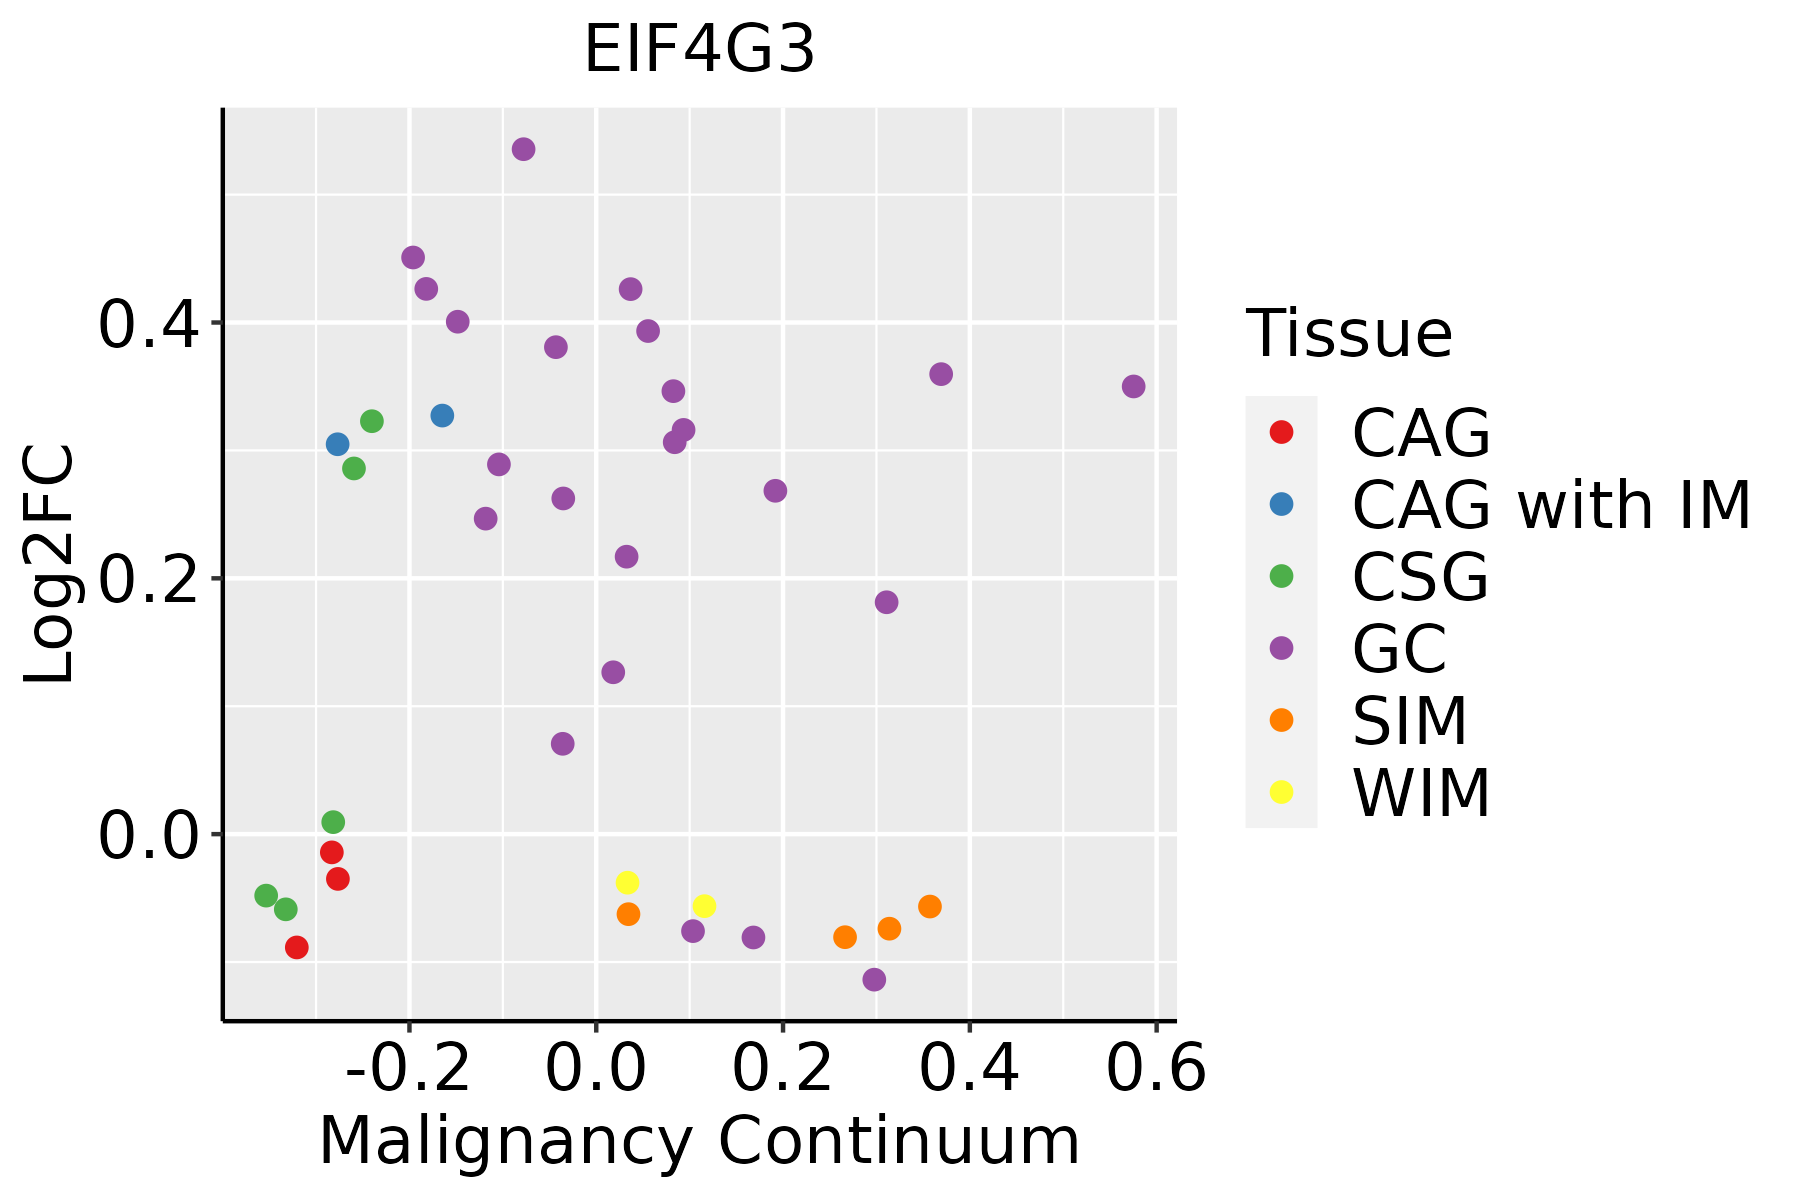 | CAG: Chronic atrophic gastritis |
| CAG with IM: Chronic atrophic gastritis with intestinal metaplasia | ||
| CSG: Chronic superficial gastritis | ||
| GC: Gastric cancer | ||
| SIM: Severe intestinal metaplasia | ||
| WIM: Wild intestinal metaplasia | ||
| Liver | 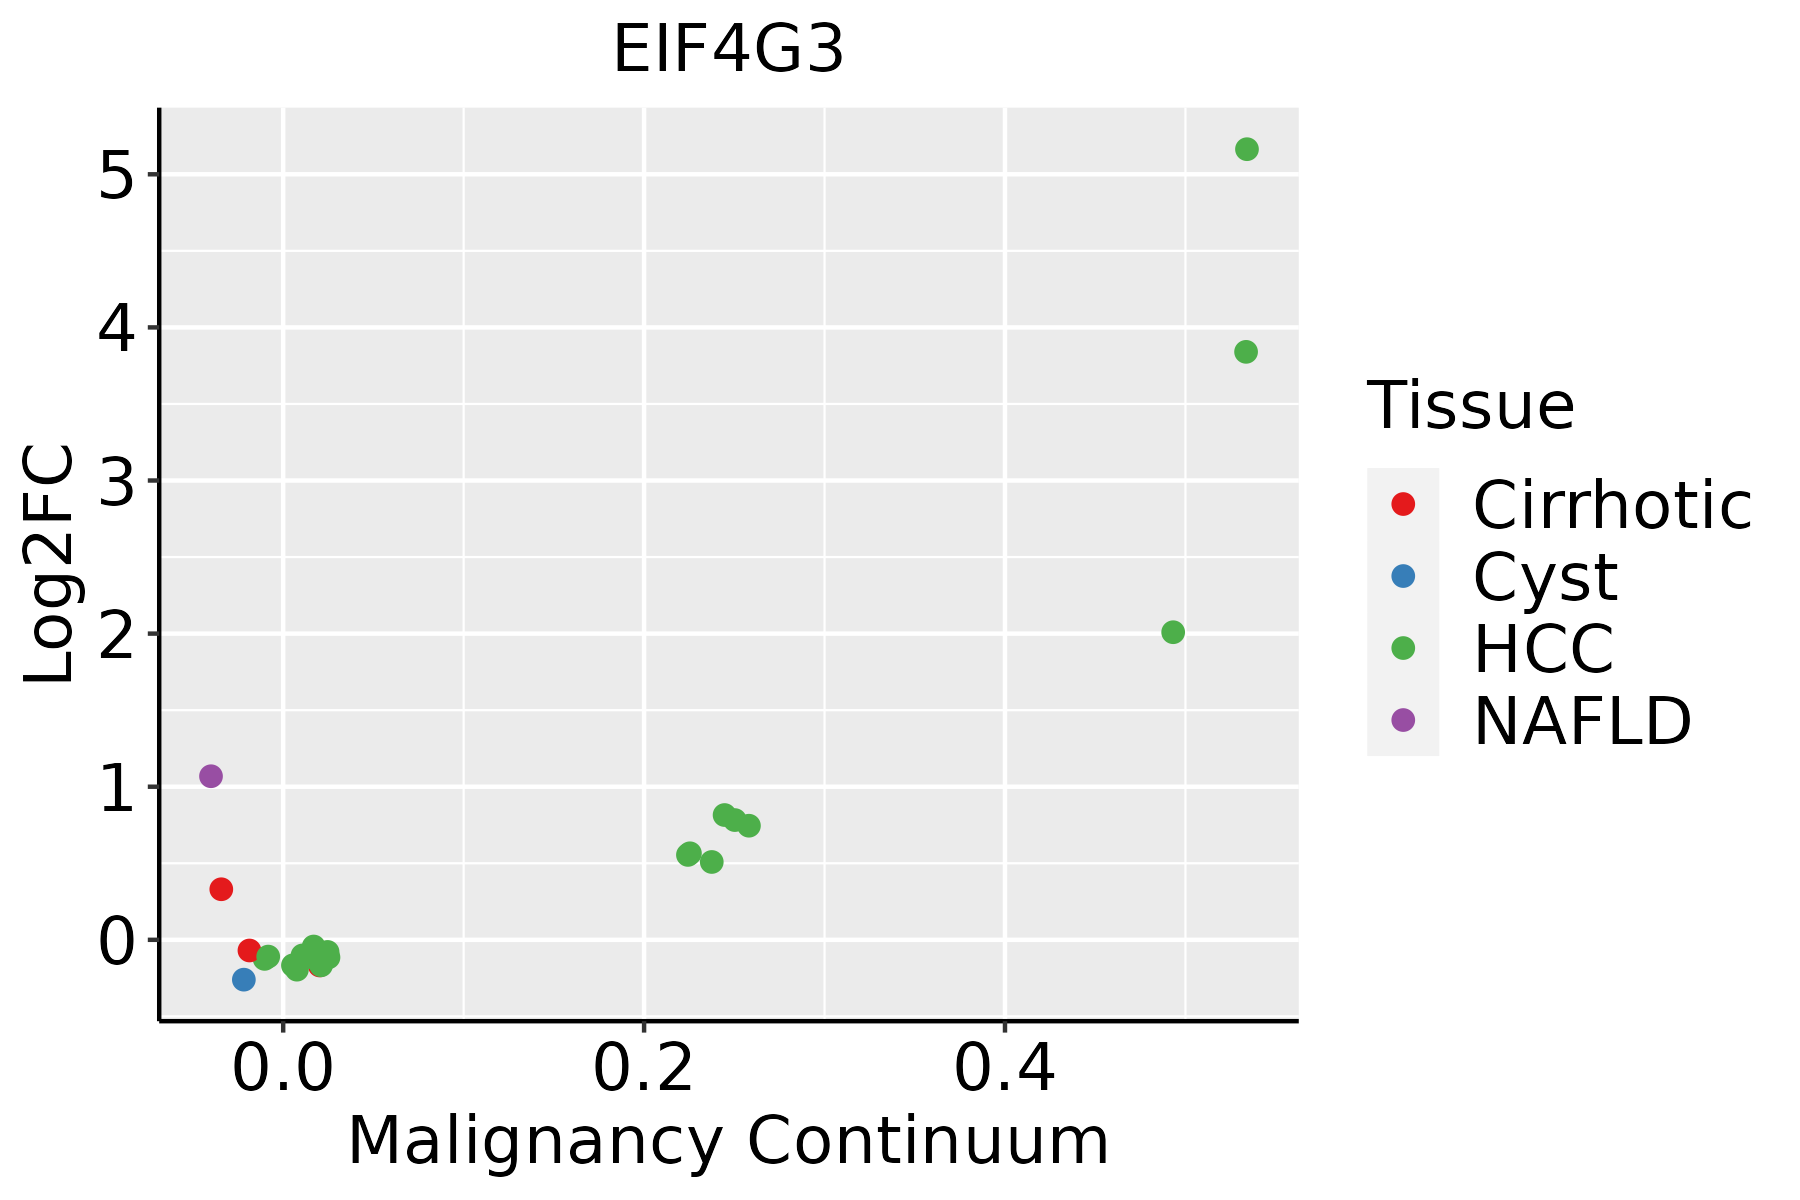 | HCC: Hepatocellular carcinoma |
| NAFLD: Non-alcoholic fatty liver disease | ||
| Lung |  | AAH: Atypical adenomatous hyperplasia |
| AIS: Adenocarcinoma in situ | ||
| IAC: Invasive lung adenocarcinoma | ||
| MIA: Minimally invasive adenocarcinoma | ||
| Oral Cavity | 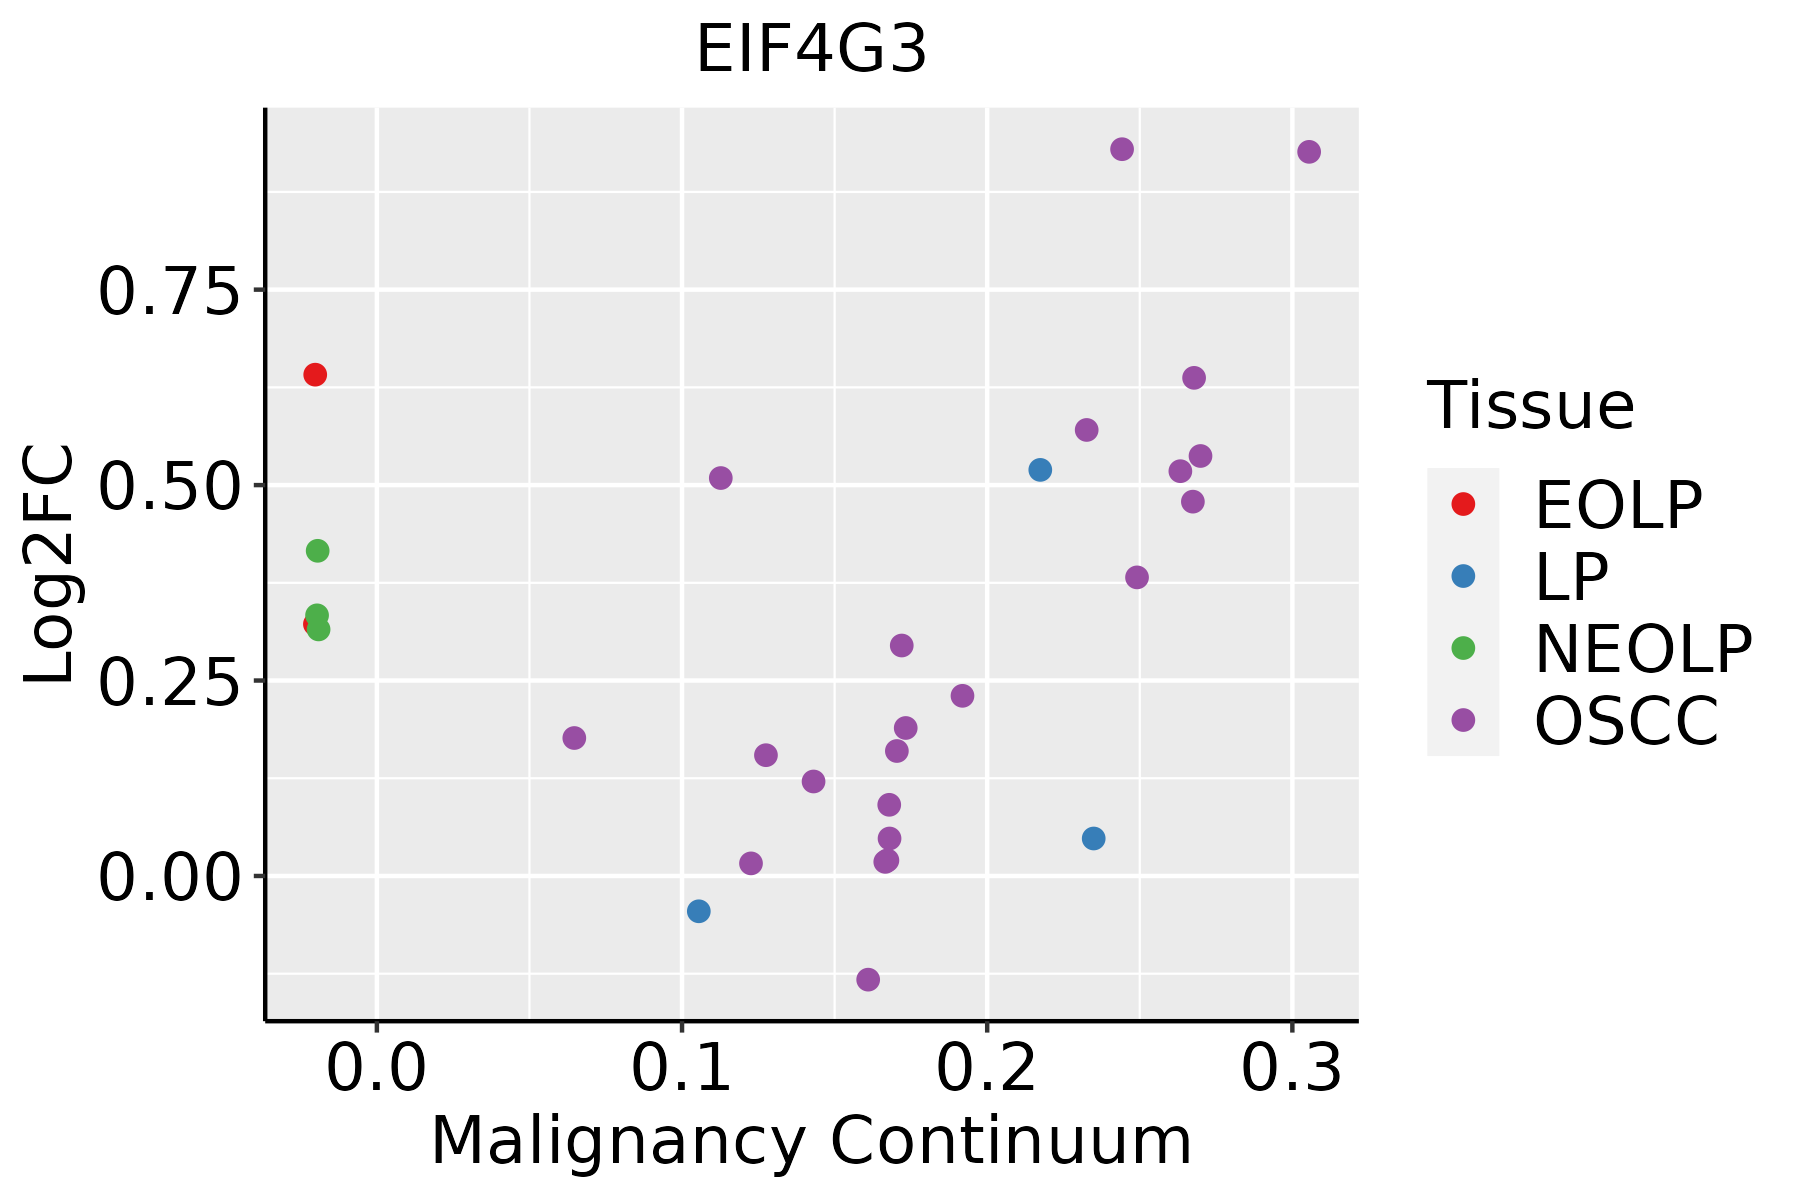 | EOLP: Erosive Oral lichen planus |
| LP: leukoplakia | ||
| NEOLP: Non-erosive oral lichen planus | ||
| OSCC: Oral squamous cell carcinoma | ||
| Prostate |  | BPH: Benign Prostatic Hyperplasia |
| Skin | 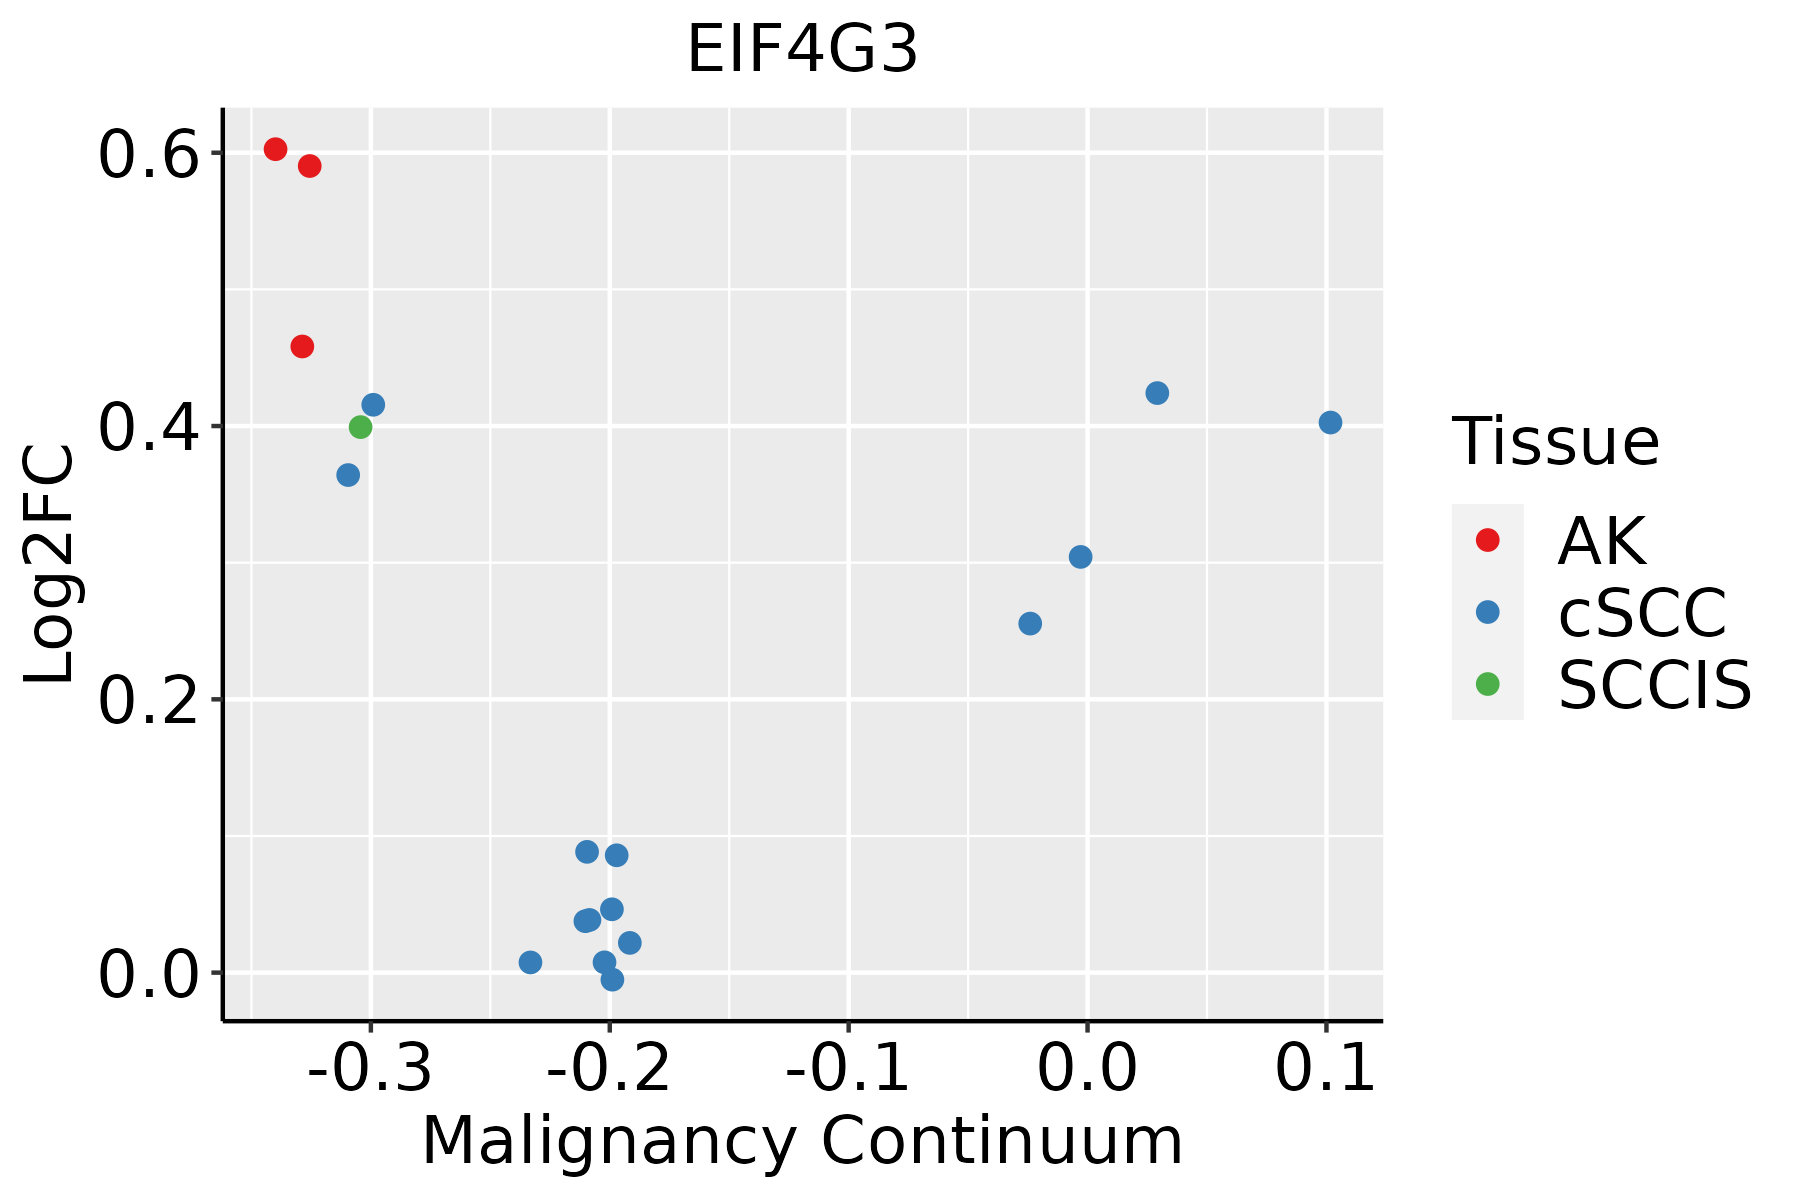 | AK: Actinic keratosis |
| cSCC: Cutaneous squamous cell carcinoma | ||
| SCCIS:squamous cell carcinoma in situ | ||
| Thyroid | 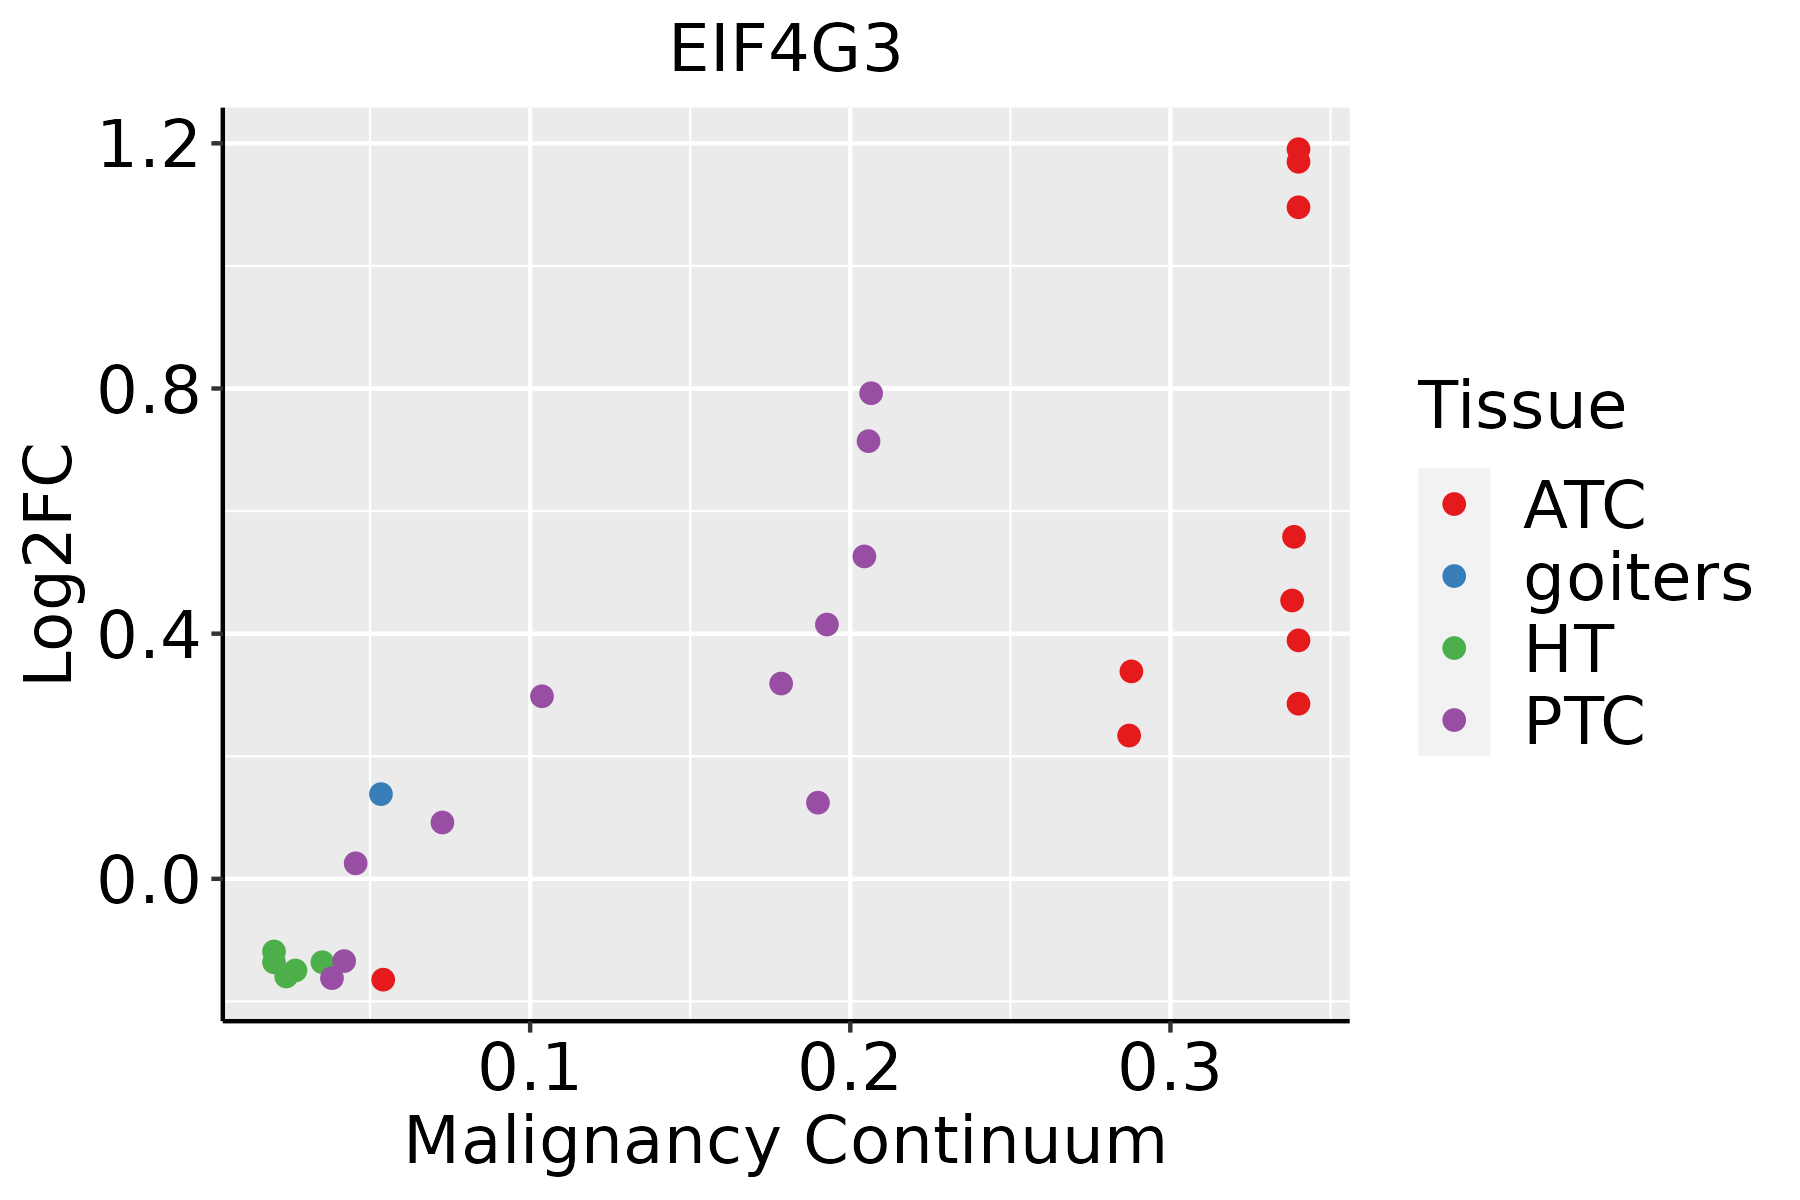 | ATC: Anaplastic thyroid cancer |
| HT: Hashimoto's thyroiditis | ||
| PTC: Papillary thyroid cancer |
| ∗log2FC in expression of this searched gene in stem-like cells from each diseased tissue sample relative to stem-like cells in normal samples in each tissue plotted against the malignancy continuum. Samples are colored based on if they are from different disease stage. |
Top |
Malignant transformation related pathway analysis |
| Find out the enriched GO biological processes and KEGG pathways involved in transition from healthy to precancer to cancer |
| Tissue | Disease Stage | Enriched GO biological Processes |
| Colorectum | AD |  |
| Colorectum | SER |  |
| Colorectum | MSS |  |
| Colorectum | MSI-H |  |
| Colorectum | FAP |  |
| ∗Top 15 enriched GO BP terms are showed in the bar plot of each disease state in each tissue. Each row represents a significant GO biological process which is colored according to the -log10(p.adjust). |
| Page: 1 2 3 4 5 6 7 8 9 |
| GO ID | Tissue | Disease Stage | Description | Gene Ratio | Bg Ratio | pvalue | p.adjust | Count |
| GO:000641710 | Cervix | CC | regulation of translation | 89/2311 | 468/18723 | 1.86e-05 | 3.46e-04 | 89 |
| GO:00064139 | Cervix | CC | translational initiation | 25/2311 | 118/18723 | 4.54e-03 | 2.75e-02 | 25 |
| GO:0006417 | Colorectum | AD | regulation of translation | 141/3918 | 468/18723 | 1.32e-06 | 4.22e-05 | 141 |
| GO:0006413 | Colorectum | AD | translational initiation | 45/3918 | 118/18723 | 1.35e-05 | 2.92e-04 | 45 |
| GO:0006446 | Colorectum | AD | regulation of translational initiation | 28/3918 | 79/18723 | 2.02e-03 | 1.63e-02 | 28 |
| GO:00064131 | Colorectum | SER | translational initiation | 36/2897 | 118/18723 | 2.84e-05 | 7.63e-04 | 36 |
| GO:00064171 | Colorectum | SER | regulation of translation | 100/2897 | 468/18723 | 3.76e-04 | 5.74e-03 | 100 |
| GO:00064172 | Colorectum | MSS | regulation of translation | 134/3467 | 468/18723 | 4.43e-08 | 2.38e-06 | 134 |
| GO:00064132 | Colorectum | MSS | translational initiation | 43/3467 | 118/18723 | 3.19e-06 | 9.38e-05 | 43 |
| GO:00064461 | Colorectum | MSS | regulation of translational initiation | 26/3467 | 79/18723 | 1.56e-03 | 1.42e-02 | 26 |
| GO:00064174 | Colorectum | FAP | regulation of translation | 111/2622 | 468/18723 | 8.47e-09 | 1.13e-06 | 111 |
| GO:00064463 | Colorectum | FAP | regulation of translational initiation | 26/2622 | 79/18723 | 1.54e-05 | 4.01e-04 | 26 |
| GO:00064134 | Colorectum | FAP | translational initiation | 34/2622 | 118/18723 | 2.13e-05 | 5.12e-04 | 34 |
| GO:00064175 | Colorectum | CRC | regulation of translation | 82/2078 | 468/18723 | 1.79e-05 | 5.40e-04 | 82 |
| GO:000641310 | Endometrium | AEH | translational initiation | 42/2100 | 118/18723 | 2.68e-12 | 4.67e-10 | 42 |
| GO:000641716 | Endometrium | AEH | regulation of translation | 94/2100 | 468/18723 | 1.14e-08 | 7.62e-07 | 94 |
| GO:00064467 | Endometrium | AEH | regulation of translational initiation | 25/2100 | 79/18723 | 8.99e-07 | 3.19e-05 | 25 |
| GO:000641315 | Endometrium | EEC | translational initiation | 42/2168 | 118/18723 | 7.65e-12 | 1.24e-09 | 42 |
| GO:000641717 | Endometrium | EEC | regulation of translation | 94/2168 | 468/18723 | 5.37e-08 | 2.88e-06 | 94 |
| GO:000644614 | Endometrium | EEC | regulation of translational initiation | 25/2168 | 79/18723 | 1.62e-06 | 5.03e-05 | 25 |
| Page: 1 2 3 4 |
| Pathway ID | Tissue | Disease Stage | Description | Gene Ratio | Bg Ratio | pvalue | p.adjust | qvalue | Count |
| hsa0541620 | Cervix | CC | Viral myocarditis | 27/1267 | 60/8465 | 2.43e-08 | 3.57e-07 | 2.11e-07 | 27 |
| hsa05416110 | Cervix | CC | Viral myocarditis | 27/1267 | 60/8465 | 2.43e-08 | 3.57e-07 | 2.11e-07 | 27 |
| hsa0541625 | Endometrium | AEH | Viral myocarditis | 27/1197 | 60/8465 | 6.98e-09 | 1.13e-07 | 8.30e-08 | 27 |
| hsa05416111 | Endometrium | AEH | Viral myocarditis | 27/1197 | 60/8465 | 6.98e-09 | 1.13e-07 | 8.30e-08 | 27 |
| hsa0541626 | Endometrium | EEC | Viral myocarditis | 28/1237 | 60/8465 | 2.81e-09 | 5.77e-08 | 4.30e-08 | 28 |
| hsa0541635 | Endometrium | EEC | Viral myocarditis | 28/1237 | 60/8465 | 2.81e-09 | 5.77e-08 | 4.30e-08 | 28 |
| hsa0541630 | Esophagus | ESCC | Viral myocarditis | 41/4205 | 60/8465 | 2.59e-03 | 7.05e-03 | 3.61e-03 | 41 |
| hsa05416114 | Esophagus | ESCC | Viral myocarditis | 41/4205 | 60/8465 | 2.59e-03 | 7.05e-03 | 3.61e-03 | 41 |
| hsa0541614 | Liver | Cirrhotic | Viral myocarditis | 28/2530 | 60/8465 | 4.38e-03 | 1.68e-02 | 1.03e-02 | 28 |
| hsa0541615 | Liver | Cirrhotic | Viral myocarditis | 28/2530 | 60/8465 | 4.38e-03 | 1.68e-02 | 1.03e-02 | 28 |
| hsa0541616 | Lung | IAC | Viral myocarditis | 21/1053 | 60/8465 | 5.30e-06 | 1.57e-04 | 1.04e-04 | 21 |
| hsa0541617 | Lung | IAC | Viral myocarditis | 21/1053 | 60/8465 | 5.30e-06 | 1.57e-04 | 1.04e-04 | 21 |
| hsa0541622 | Lung | AIS | Viral myocarditis | 19/961 | 60/8465 | 2.01e-05 | 4.08e-04 | 2.61e-04 | 19 |
| hsa0541632 | Lung | AIS | Viral myocarditis | 19/961 | 60/8465 | 2.01e-05 | 4.08e-04 | 2.61e-04 | 19 |
| hsa0541661 | Lung | MIAC | Viral myocarditis | 15/507 | 60/8465 | 1.61e-06 | 9.39e-05 | 6.79e-05 | 15 |
| hsa0541671 | Lung | MIAC | Viral myocarditis | 15/507 | 60/8465 | 1.61e-06 | 9.39e-05 | 6.79e-05 | 15 |
| hsa0541629 | Oral cavity | OSCC | Viral myocarditis | 39/3704 | 60/8465 | 7.13e-04 | 2.09e-03 | 1.07e-03 | 39 |
| hsa05416113 | Oral cavity | OSCC | Viral myocarditis | 39/3704 | 60/8465 | 7.13e-04 | 2.09e-03 | 1.07e-03 | 39 |
| hsa0541644 | Oral cavity | EOLP | Viral myocarditis | 24/1218 | 60/8465 | 9.78e-07 | 9.29e-06 | 5.48e-06 | 24 |
| hsa0541654 | Oral cavity | EOLP | Viral myocarditis | 24/1218 | 60/8465 | 9.78e-07 | 9.29e-06 | 5.48e-06 | 24 |
| Page: 1 2 |
Top |
Cell-cell communication analysis |
| Identification of potential cell-cell interactions between two cell types and their ligand-receptor pairs for different disease states |
| Ligand | Receptor | LRpair | Pathway | Tissue | Disease Stage |
| Page: 1 |
Top |
Single-cell gene regulatory network inference analysis |
| Find out the significant the regulons (TFs) and the target genes of each regulon across cell types for different disease states |
| TF | Cell Type | Tissue | Disease Stage | Target Gene | RSS | Regulon Activity |
| ∗The dot plots of a searched regulon are shown for all cell subpopulations in each disease state of each tissue based on the regulon specific score inferred using pySCENIC and by calculating the average expression. |
| Page: 1 |
Top |
Somatic mutation of malignant transformation related genes |
| Annotation of somatic variants for genes involved in malignant transformation |
| Hugo Symbol | Variant Class | Variant Classification | dbSNP RS | HGVSc | HGVSp | HGVSp Short | SWISSPROT | BIOTYPE | SIFT | PolyPhen | Tumor Sample Barcode | Tissue | Histology | Sex | Age | Stage | Therapy Types | Drugs | Outcome |
| EIF4G3 | SNV | Missense_Mutation | novel | c.3234N>C | p.Lys1078Asn | p.K1078N | protein_coding | deleterious(0) | probably_damaging(0.971) | TCGA-5L-AAT0-01 | Breast | breast invasive carcinoma | Female | <65 | I/II | Hormone Therapy | tamoxiphen | SD | |
| EIF4G3 | SNV | Missense_Mutation | rs748539423 | c.1429G>T | p.Asp477Tyr | p.D477Y | protein_coding | deleterious_low_confidence(0) | benign(0.054) | TCGA-AC-A23H-01 | Breast | breast invasive carcinoma | Female | >=65 | I/II | Unknown | Unknown | PD | |
| EIF4G3 | SNV | Missense_Mutation | novel | c.2935N>C | p.Glu979Gln | p.E979Q | protein_coding | deleterious(0) | probably_damaging(1) | TCGA-BH-A0B6-01 | Breast | breast invasive carcinoma | Female | <65 | I/II | Unknown | Unknown | SD | |
| EIF4G3 | SNV | Missense_Mutation | c.350N>T | p.Pro117Leu | p.P117L | protein_coding | deleterious(0.01) | probably_damaging(1) | TCGA-D8-A1Y1-01 | Breast | breast invasive carcinoma | Female | >=65 | III/IV | Hormone Therapy | tamoxiphen | PD | ||
| EIF4G3 | SNV | Missense_Mutation | rs759286296 | c.4378G>A | p.Glu1460Lys | p.E1460K | protein_coding | deleterious(0.01) | benign(0.433) | TCGA-D8-A27V-01 | Breast | breast invasive carcinoma | Female | <65 | I/II | Hormone Therapy | tamoxiphen | SD | |
| EIF4G3 | SNV | Missense_Mutation | c.3802N>A | p.Glu1268Lys | p.E1268K | protein_coding | deleterious(0) | probably_damaging(0.979) | TCGA-E2-A152-01 | Breast | breast invasive carcinoma | Female | <65 | I/II | Targeted Molecular therapy | trastuzumab | PD | ||
| EIF4G3 | SNV | Missense_Mutation | c.3407N>A | p.Arg1136Lys | p.R1136K | protein_coding | deleterious(0.01) | probably_damaging(0.998) | TCGA-EW-A1IZ-01 | Breast | breast invasive carcinoma | Female | <65 | III/IV | Chemotherapy | taxotere | SD | ||
| EIF4G3 | insertion | Frame_Shift_Ins | novel | c.2726_2727insTTCAT | p.Arg909SerfsTer35 | p.R909Sfs*35 | protein_coding | TCGA-A8-A08H-01 | Breast | breast invasive carcinoma | Female | >=65 | I/II | Unknown | Unknown | SD | |||
| EIF4G3 | insertion | Frame_Shift_Ins | novel | c.2725_2726insAAACCTCATCTAGGATTCG | p.Arg909LysfsTer10 | p.R909Kfs*10 | protein_coding | TCGA-A8-A08H-01 | Breast | breast invasive carcinoma | Female | >=65 | I/II | Unknown | Unknown | SD | |||
| EIF4G3 | insertion | Frame_Shift_Ins | novel | c.2262_2263insGAGCTCCGCCTCCTGTCAGATCAGTGGCAGCCCCAGATTC | p.Ser755GlufsTer40 | p.S755Efs*40 | protein_coding | TCGA-AN-A0FX-01 | Breast | breast invasive carcinoma | Female | <65 | I/II | Unknown | Unknown | SD |
| Page: 1 2 3 4 5 6 7 8 9 10 11 12 13 14 15 16 17 |
Top |
Related drugs of malignant transformation related genes |
| Identification of chemicals and drugs interact with genes involved in malignant transfromation |
| (DGIdb 4.0) |
| Entrez ID | Symbol | Category | Interaction Types | Drug Claim Name | Drug Name | PMIDs |
| Page: 1 |

Copyright 2023-Present -The University of Texas Health Science Center at Houston |