
|
|||||
|
 | |
| |
| |
| |
| |
| |
|
Gene: EIF4G2 |
Gene summary for EIF4G2 |
| Gene information | Species | Human | Gene symbol | EIF4G2 | Gene ID | 1982 |
| Gene name | eukaryotic translation initiation factor 4 gamma 2 | |
| Gene Alias | AAG1 | |
| Cytomap | 11p15.4 | |
| Gene Type | protein-coding | GO ID | GO:0000902 | UniProtAcc | P78344 |
Top |
Malignant transformation analysis |
| Identification of the aberrant gene expression in precancerous and cancerous lesions by comparing the gene expression of stem-like cells in diseased tissues with normal stem cells |
| Entrez ID | Symbol | Replicates | Species | Organ | Tissue | Adj P-value | Log2FC | Malignancy |
| 1982 | EIF4G2 | GSM4909282 | Human | Breast | IDC | 4.87e-08 | -3.43e-01 | -0.0288 |
| 1982 | EIF4G2 | GSM4909285 | Human | Breast | IDC | 5.26e-16 | -4.01e-01 | 0.21 |
| 1982 | EIF4G2 | GSM4909286 | Human | Breast | IDC | 4.27e-13 | -3.49e-01 | 0.1081 |
| 1982 | EIF4G2 | GSM4909294 | Human | Breast | IDC | 4.97e-05 | -2.26e-01 | 0.2022 |
| 1982 | EIF4G2 | GSM4909296 | Human | Breast | IDC | 1.31e-16 | -4.15e-01 | 0.1524 |
| 1982 | EIF4G2 | GSM4909297 | Human | Breast | IDC | 4.41e-17 | -2.94e-01 | 0.1517 |
| 1982 | EIF4G2 | GSM4909301 | Human | Breast | IDC | 8.12e-06 | -2.58e-01 | 0.1577 |
| 1982 | EIF4G2 | GSM4909302 | Human | Breast | IDC | 3.13e-02 | -3.09e-01 | 0.1545 |
| 1982 | EIF4G2 | GSM4909311 | Human | Breast | IDC | 3.16e-42 | -5.67e-01 | 0.1534 |
| 1982 | EIF4G2 | GSM4909312 | Human | Breast | IDC | 3.21e-15 | -1.29e-01 | 0.1552 |
| 1982 | EIF4G2 | GSM4909315 | Human | Breast | IDC | 3.60e-05 | -2.83e-01 | 0.21 |
| 1982 | EIF4G2 | GSM4909317 | Human | Breast | IDC | 5.71e-03 | 2.63e-01 | 0.1355 |
| 1982 | EIF4G2 | GSM4909319 | Human | Breast | IDC | 2.37e-51 | -6.62e-01 | 0.1563 |
| 1982 | EIF4G2 | GSM4909320 | Human | Breast | IDC | 4.13e-07 | -5.72e-01 | 0.1575 |
| 1982 | EIF4G2 | GSM4909321 | Human | Breast | IDC | 4.27e-29 | -5.39e-01 | 0.1559 |
| 1982 | EIF4G2 | brca2 | Human | Breast | Precancer | 3.78e-04 | 3.01e-01 | -0.024 |
| 1982 | EIF4G2 | brca3 | Human | Breast | Precancer | 2.17e-05 | 3.19e-01 | -0.0263 |
| 1982 | EIF4G2 | M2 | Human | Breast | IDC | 1.48e-06 | 3.00e-01 | 0.21 |
| 1982 | EIF4G2 | NCCBC14 | Human | Breast | DCIS | 4.39e-12 | 1.01e-01 | 0.2021 |
| 1982 | EIF4G2 | NCCBC2 | Human | Breast | DCIS | 6.72e-04 | 8.17e-02 | 0.1554 |
| Page: 1 2 3 4 5 6 7 8 9 10 11 12 13 14 15 16 |
| Tissue | Expression Dynamics | Abbreviation |
| Breast | 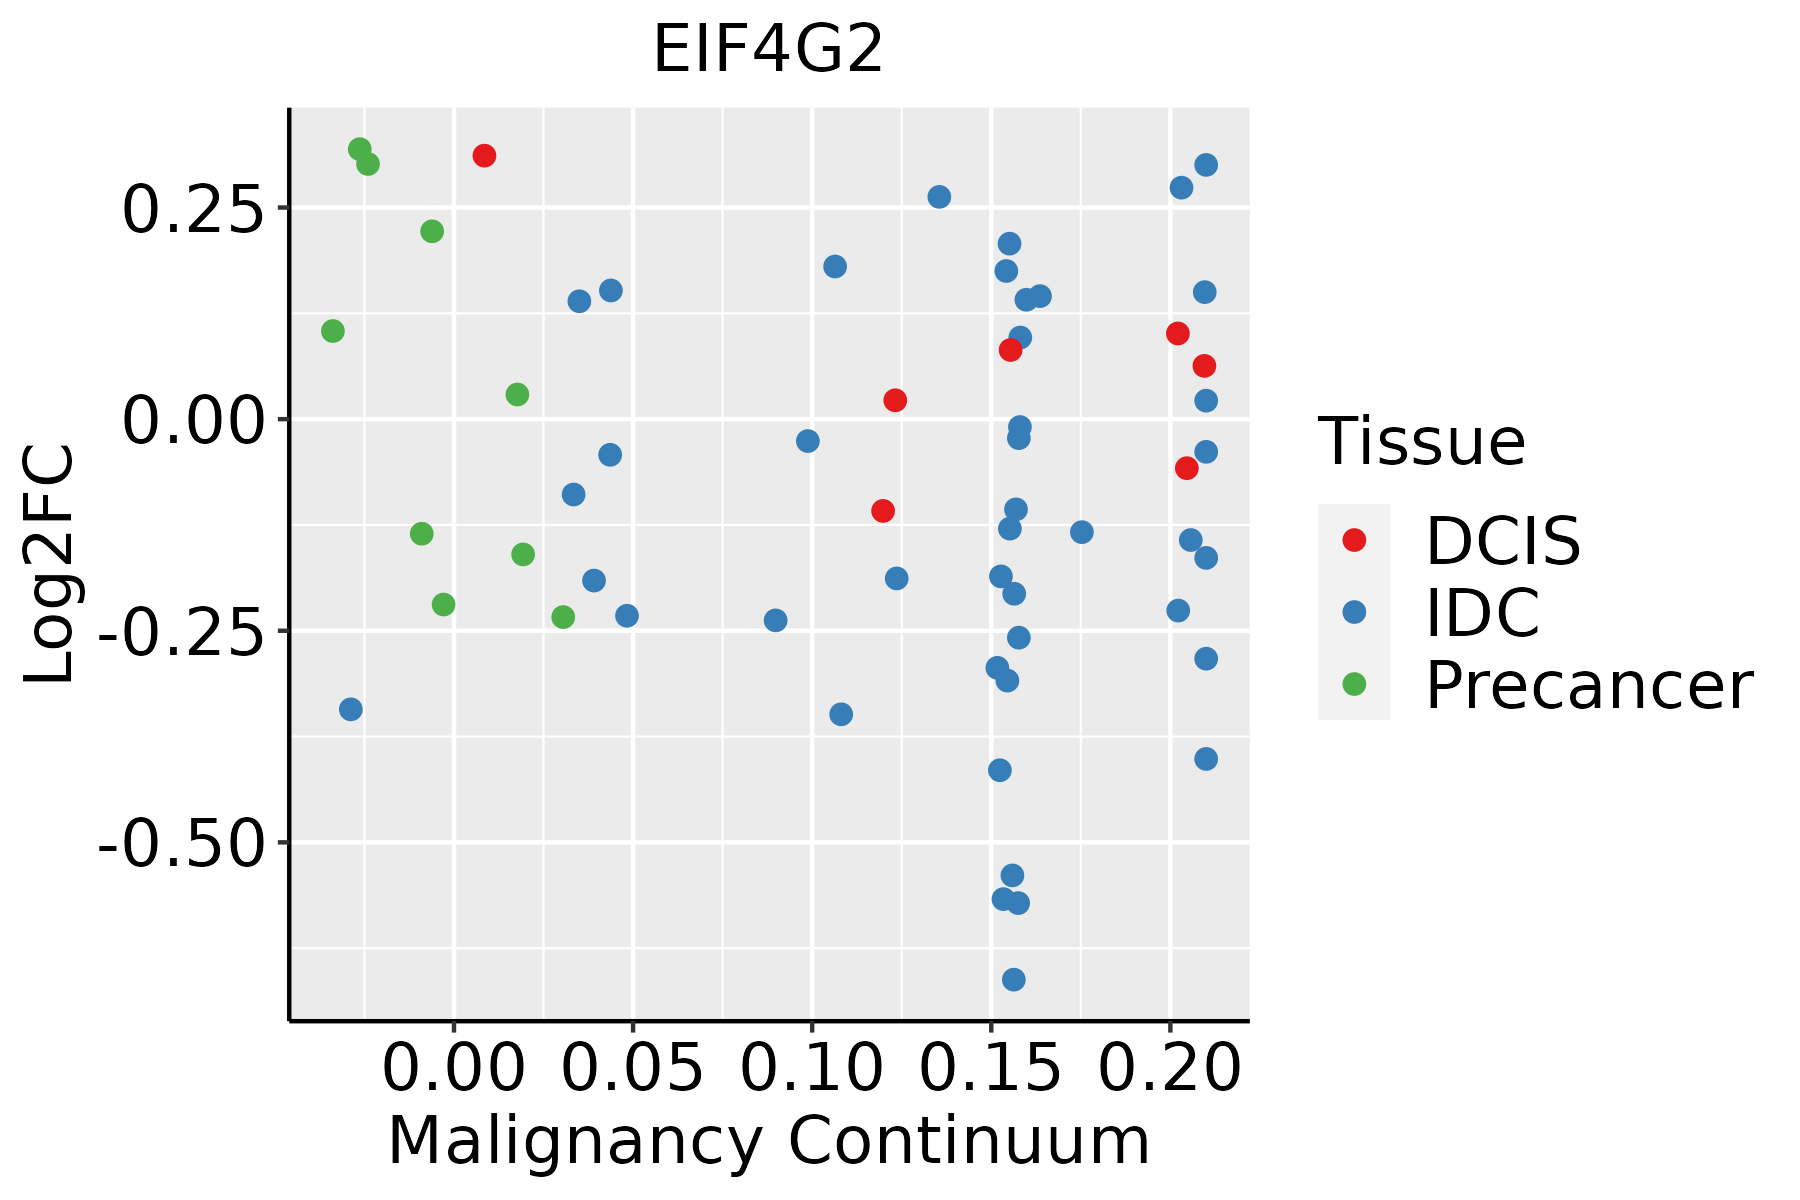 | IDC: Invasive ductal carcinoma |
| DCIS: Ductal carcinoma in situ | ||
| Precancer(BRCA1-mut): Precancerous lesion from BRCA1 mutation carriers | ||
| Cervix | 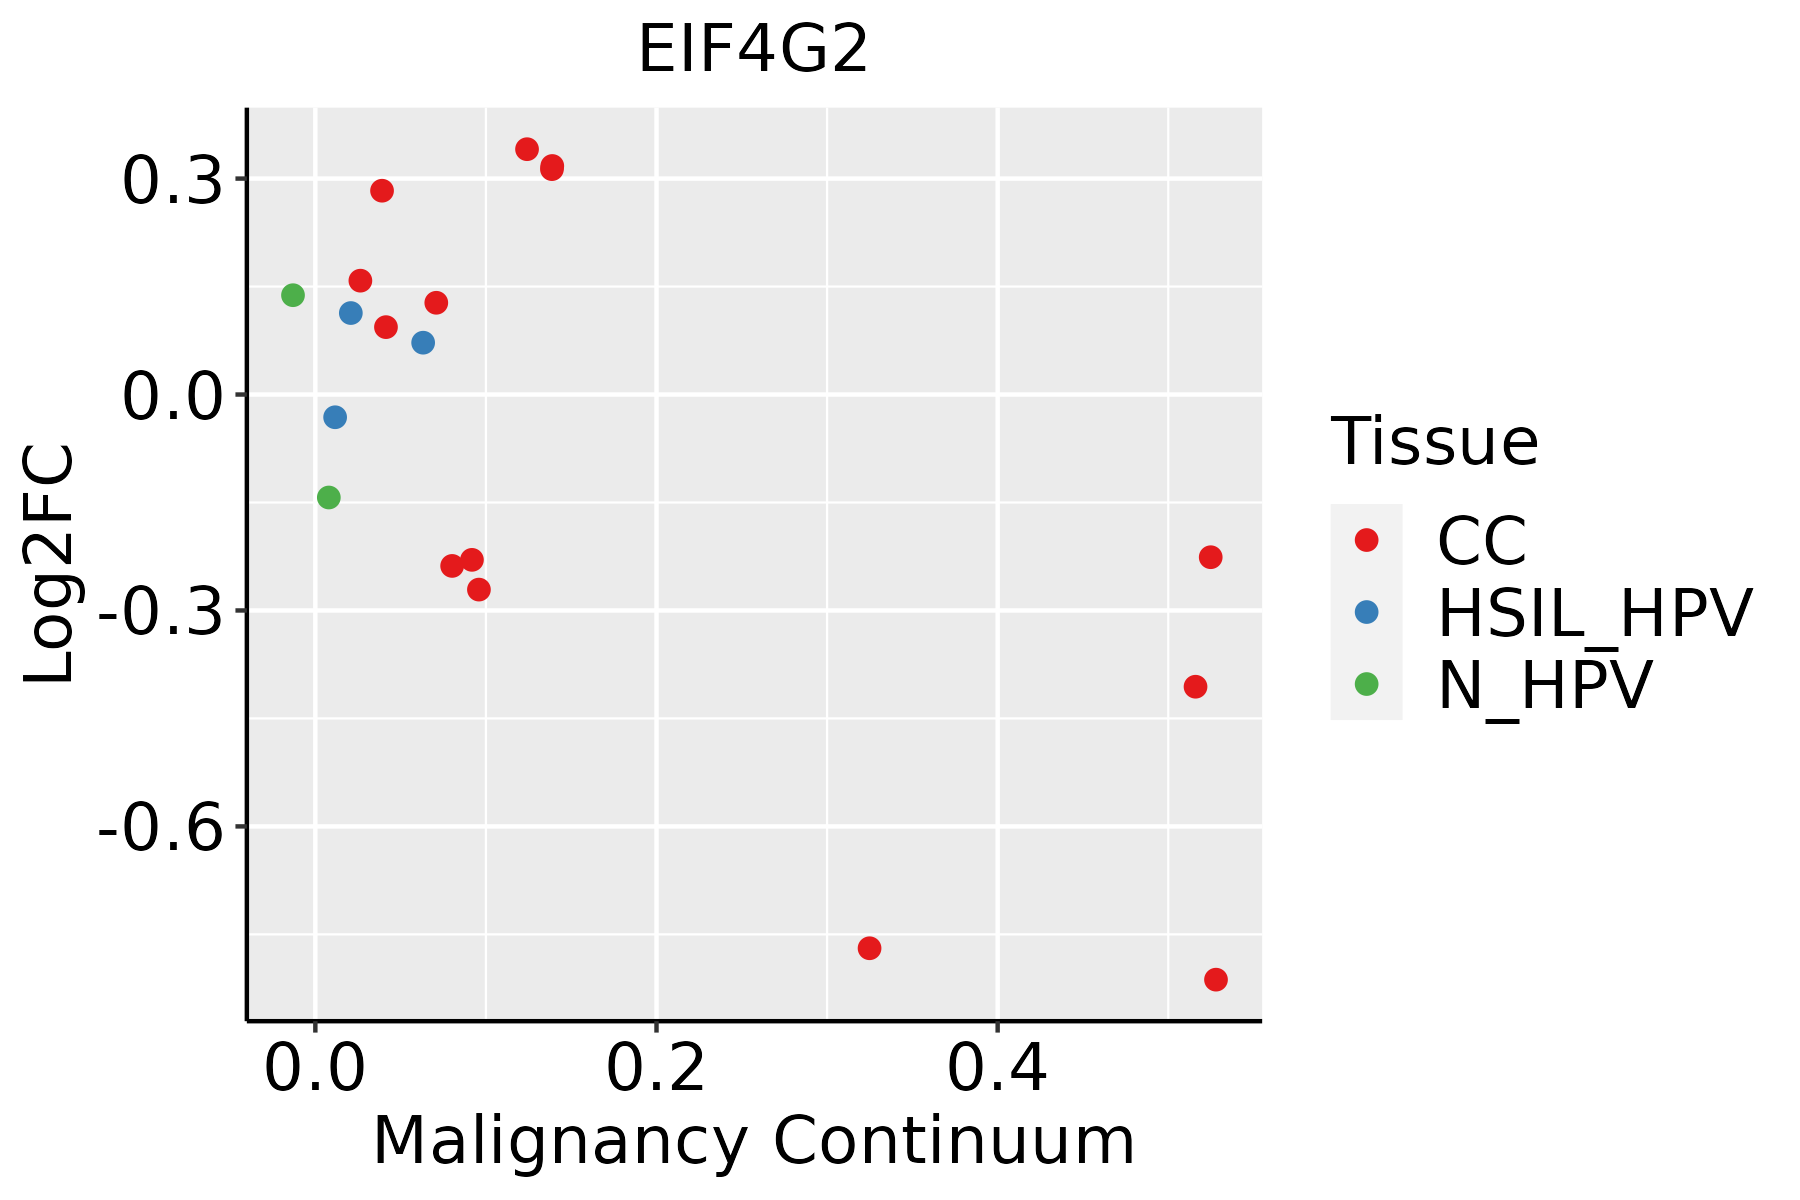 | CC: Cervix cancer |
| HSIL_HPV: HPV-infected high-grade squamous intraepithelial lesions | ||
| N_HPV: HPV-infected normal cervix | ||
| Colorectum (GSE201348) |  | FAP: Familial adenomatous polyposis |
| CRC: Colorectal cancer | ||
| Colorectum (HTA11) |  | AD: Adenomas |
| SER: Sessile serrated lesions | ||
| MSI-H: Microsatellite-high colorectal cancer | ||
| MSS: Microsatellite stable colorectal cancer | ||
| Endometrium |  | AEH: Atypical endometrial hyperplasia |
| EEC: Endometrioid Cancer | ||
| Esophagus | 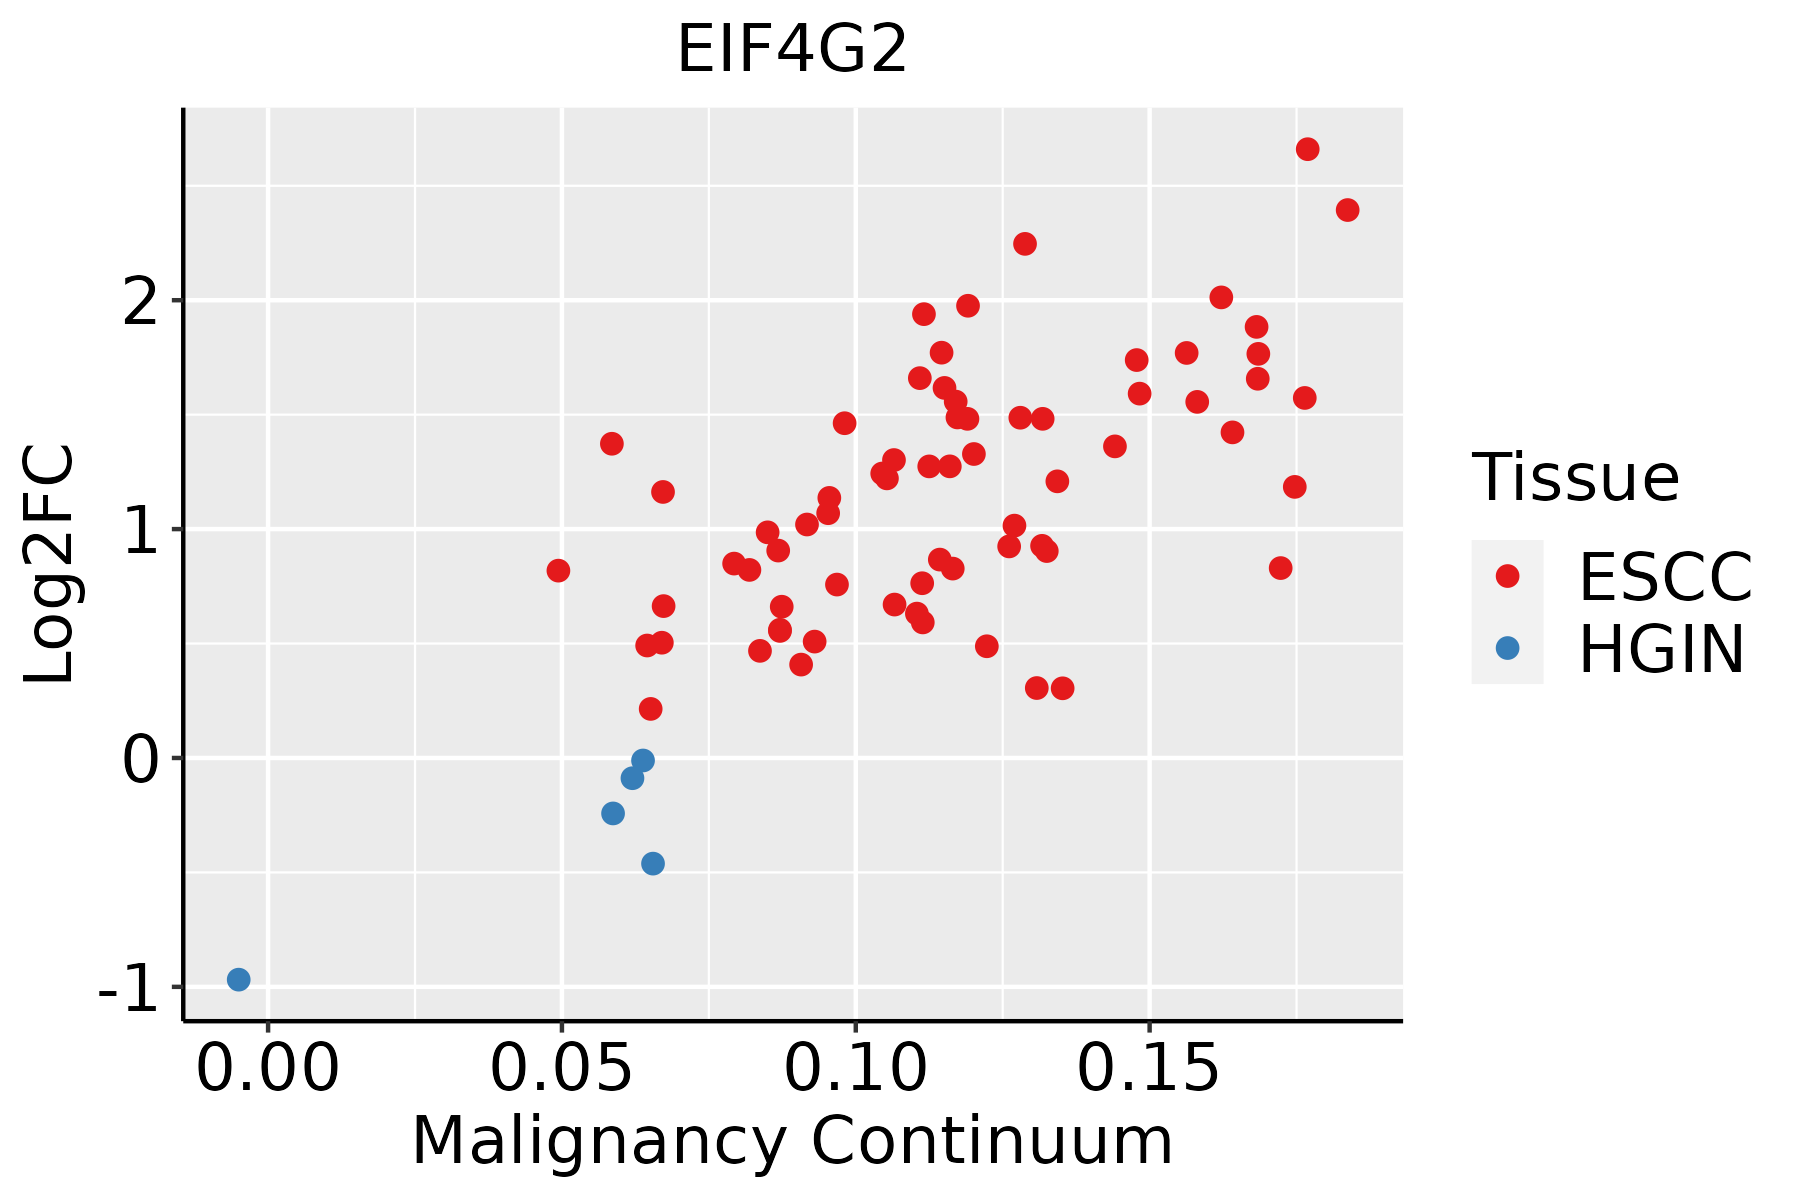 | ESCC: Esophageal squamous cell carcinoma |
| HGIN: High-grade intraepithelial neoplasias | ||
| LGIN: Low-grade intraepithelial neoplasias | ||
| GC | 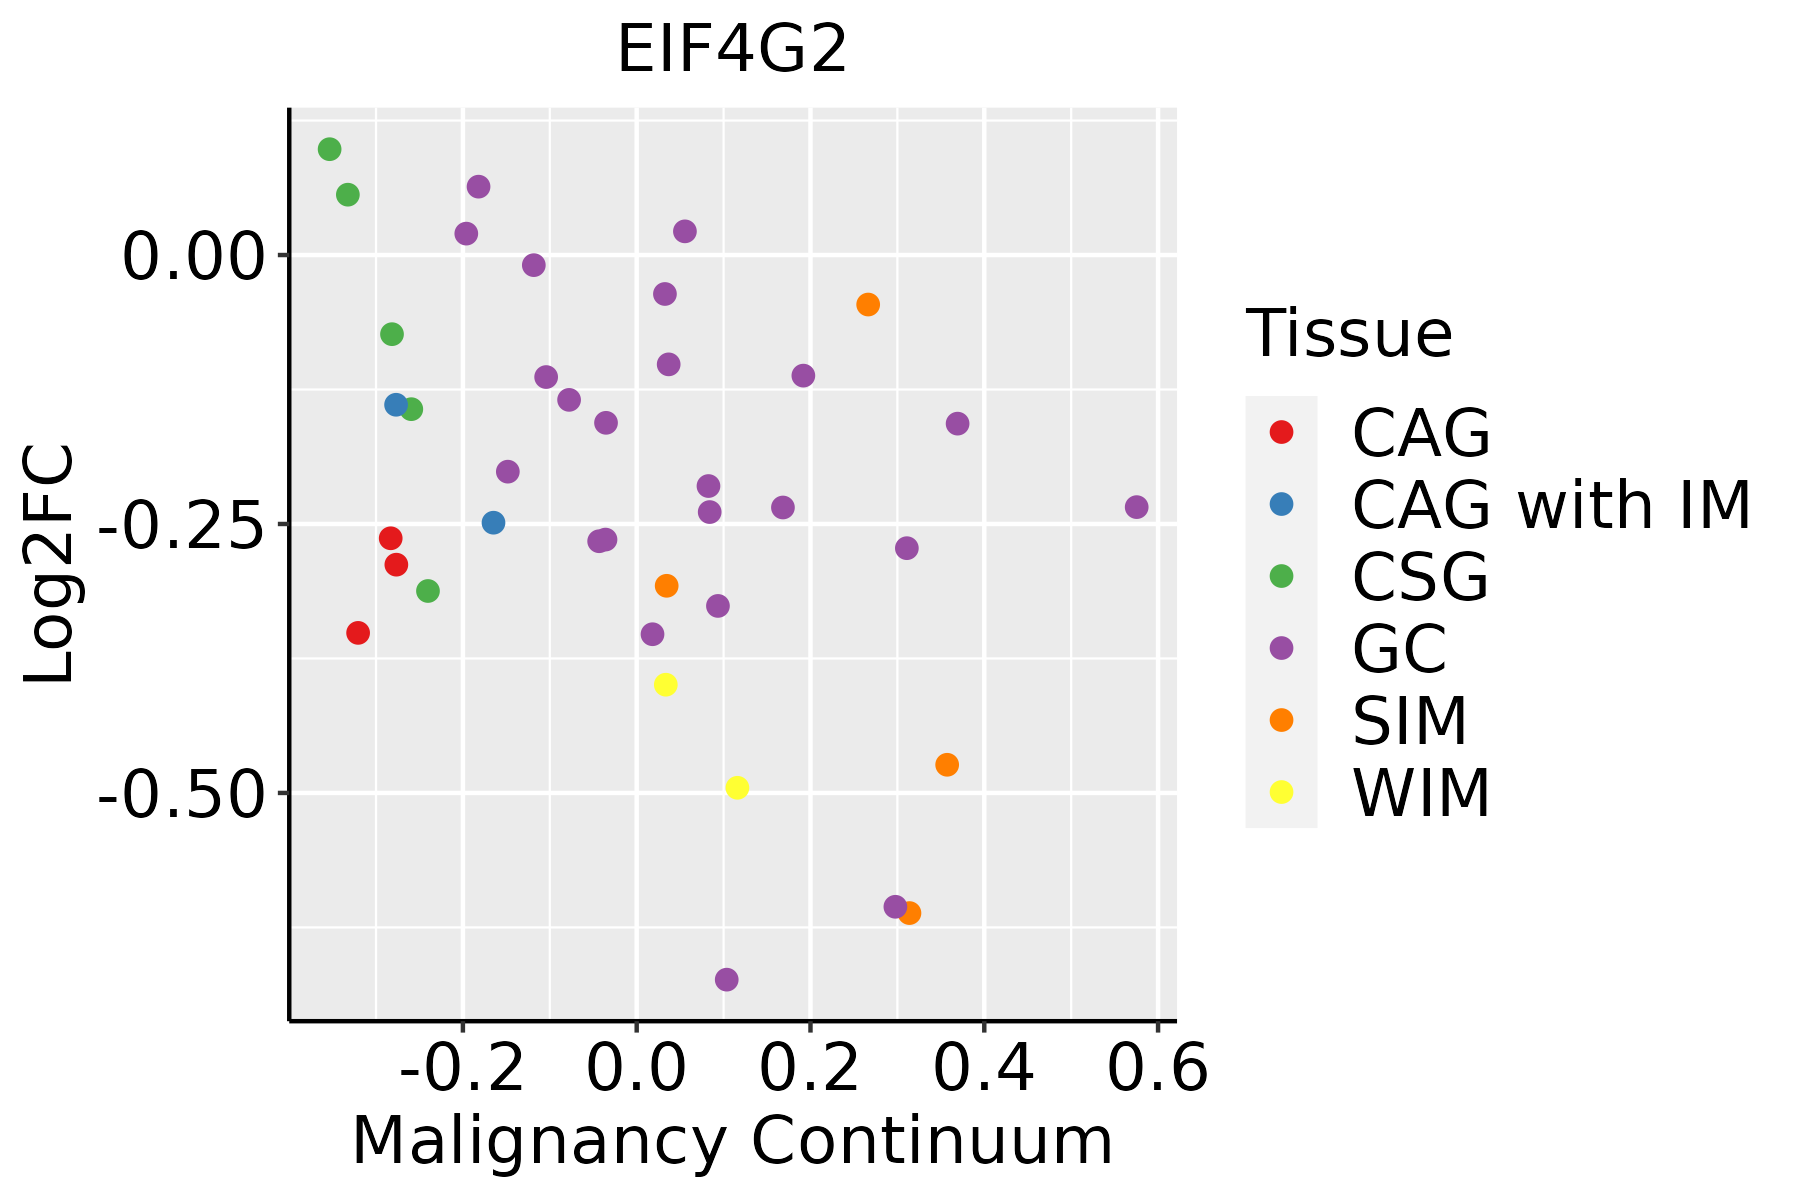 | CAG: Chronic atrophic gastritis |
| CAG with IM: Chronic atrophic gastritis with intestinal metaplasia | ||
| CSG: Chronic superficial gastritis | ||
| GC: Gastric cancer | ||
| SIM: Severe intestinal metaplasia | ||
| WIM: Wild intestinal metaplasia | ||
| Liver | 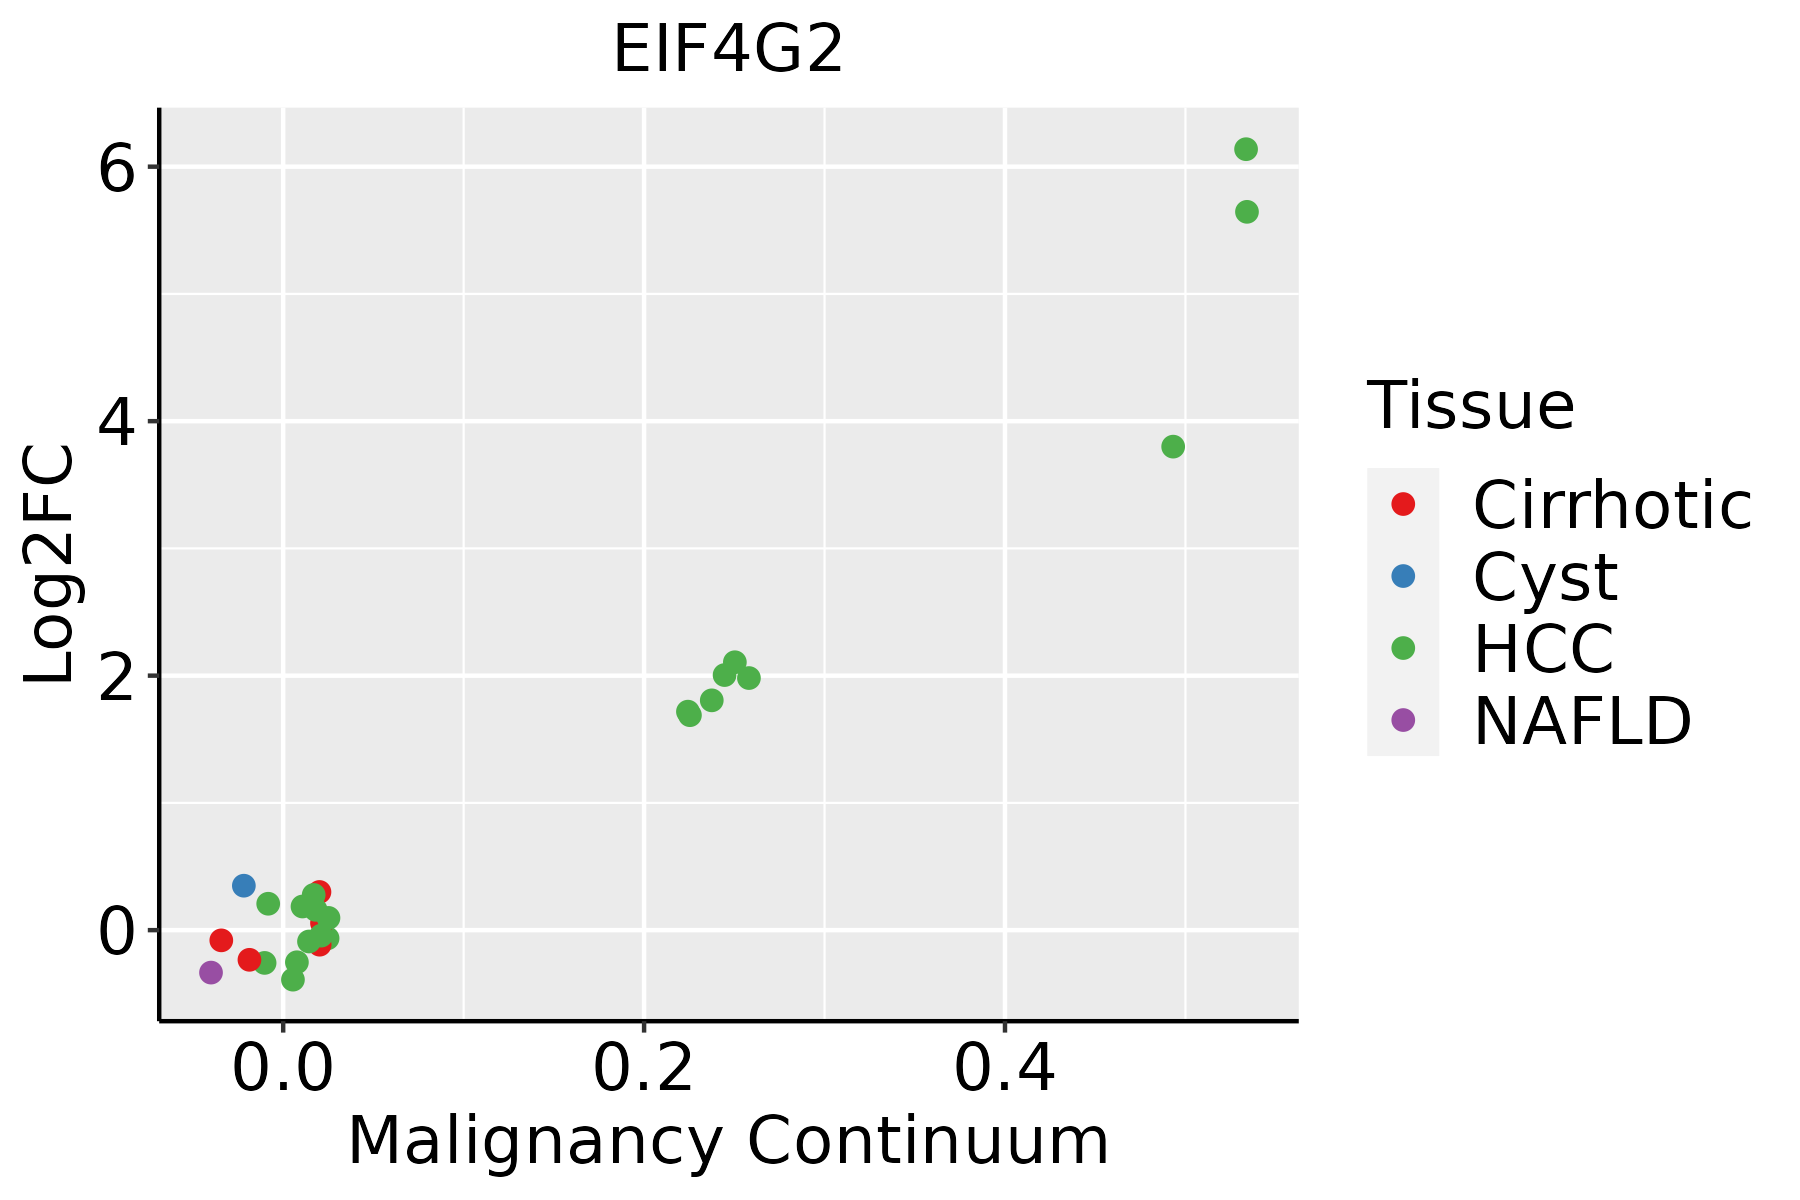 | HCC: Hepatocellular carcinoma |
| NAFLD: Non-alcoholic fatty liver disease | ||
| Lung |  | AAH: Atypical adenomatous hyperplasia |
| AIS: Adenocarcinoma in situ | ||
| IAC: Invasive lung adenocarcinoma | ||
| MIA: Minimally invasive adenocarcinoma | ||
| Oral Cavity | 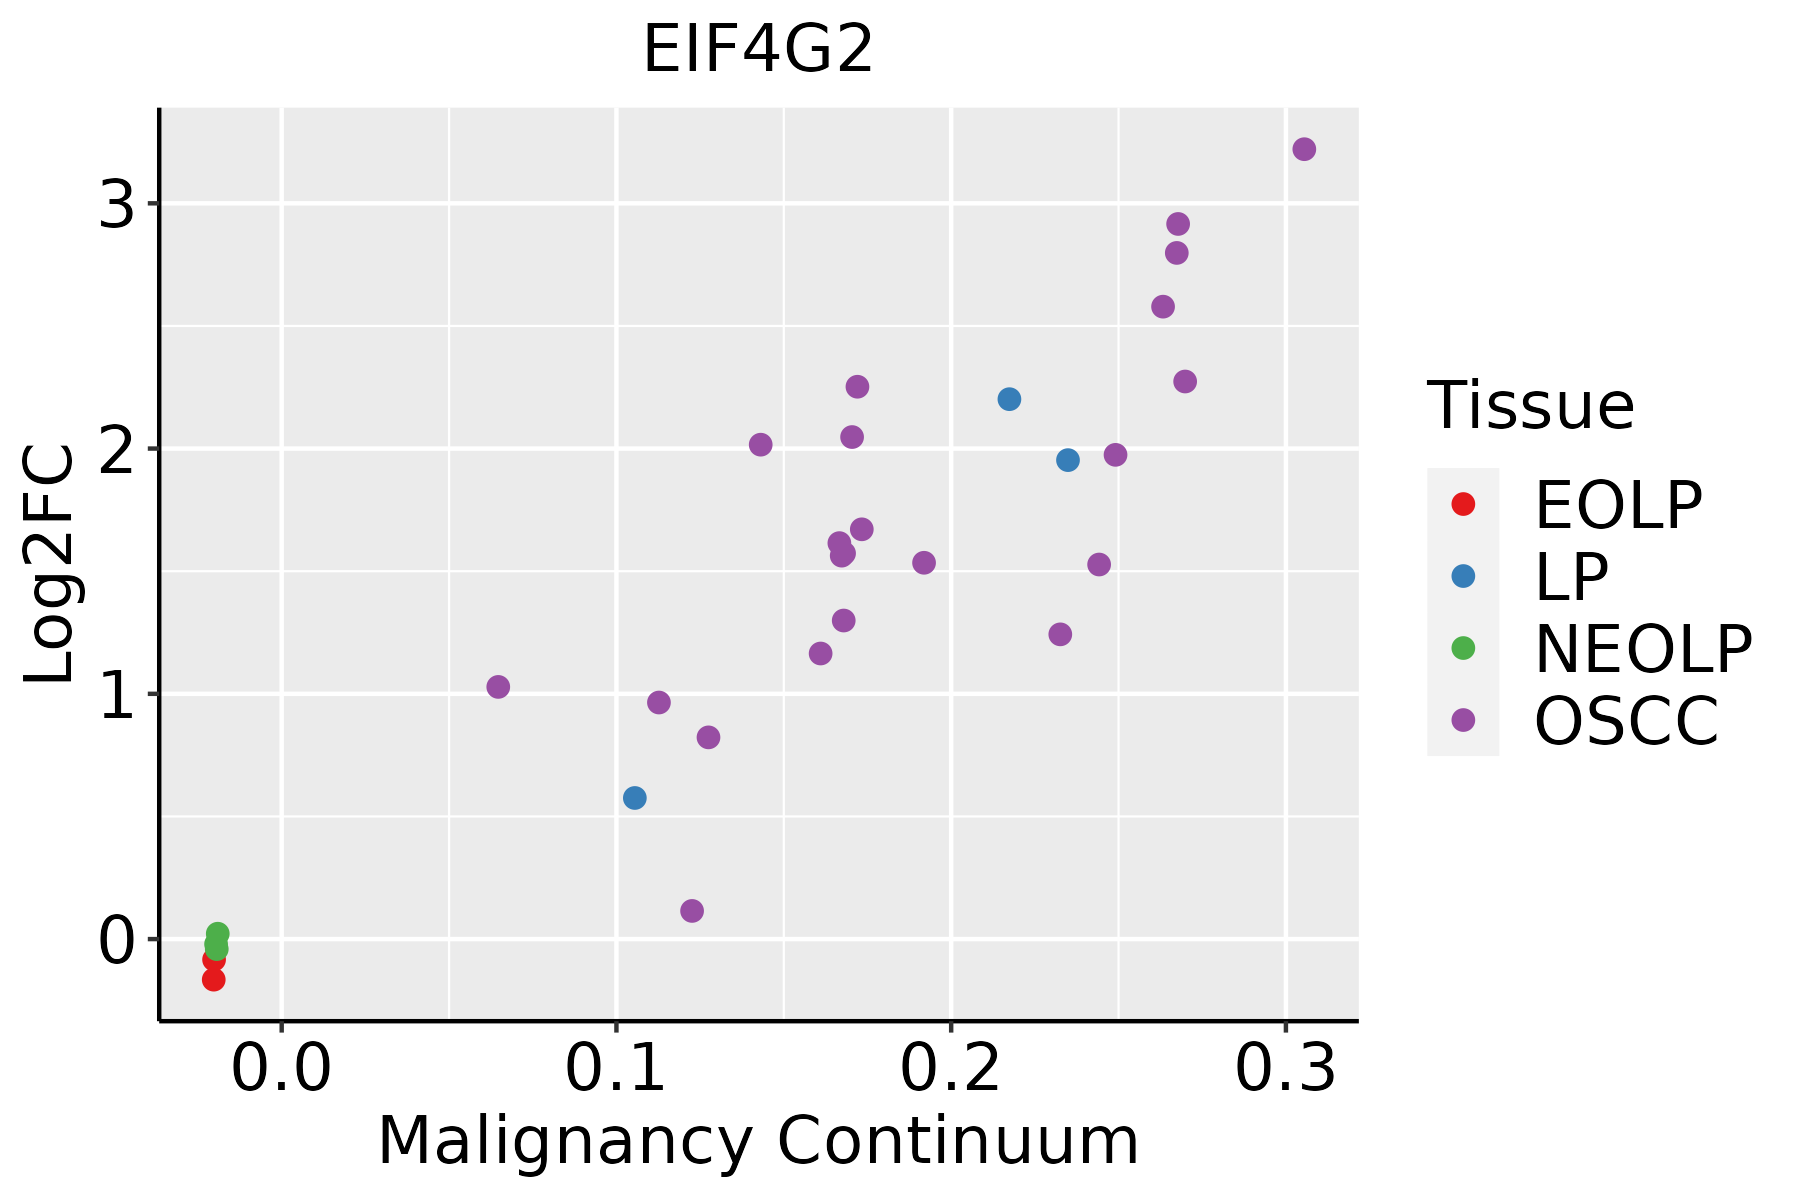 | EOLP: Erosive Oral lichen planus |
| LP: leukoplakia | ||
| NEOLP: Non-erosive oral lichen planus | ||
| OSCC: Oral squamous cell carcinoma | ||
| Prostate | 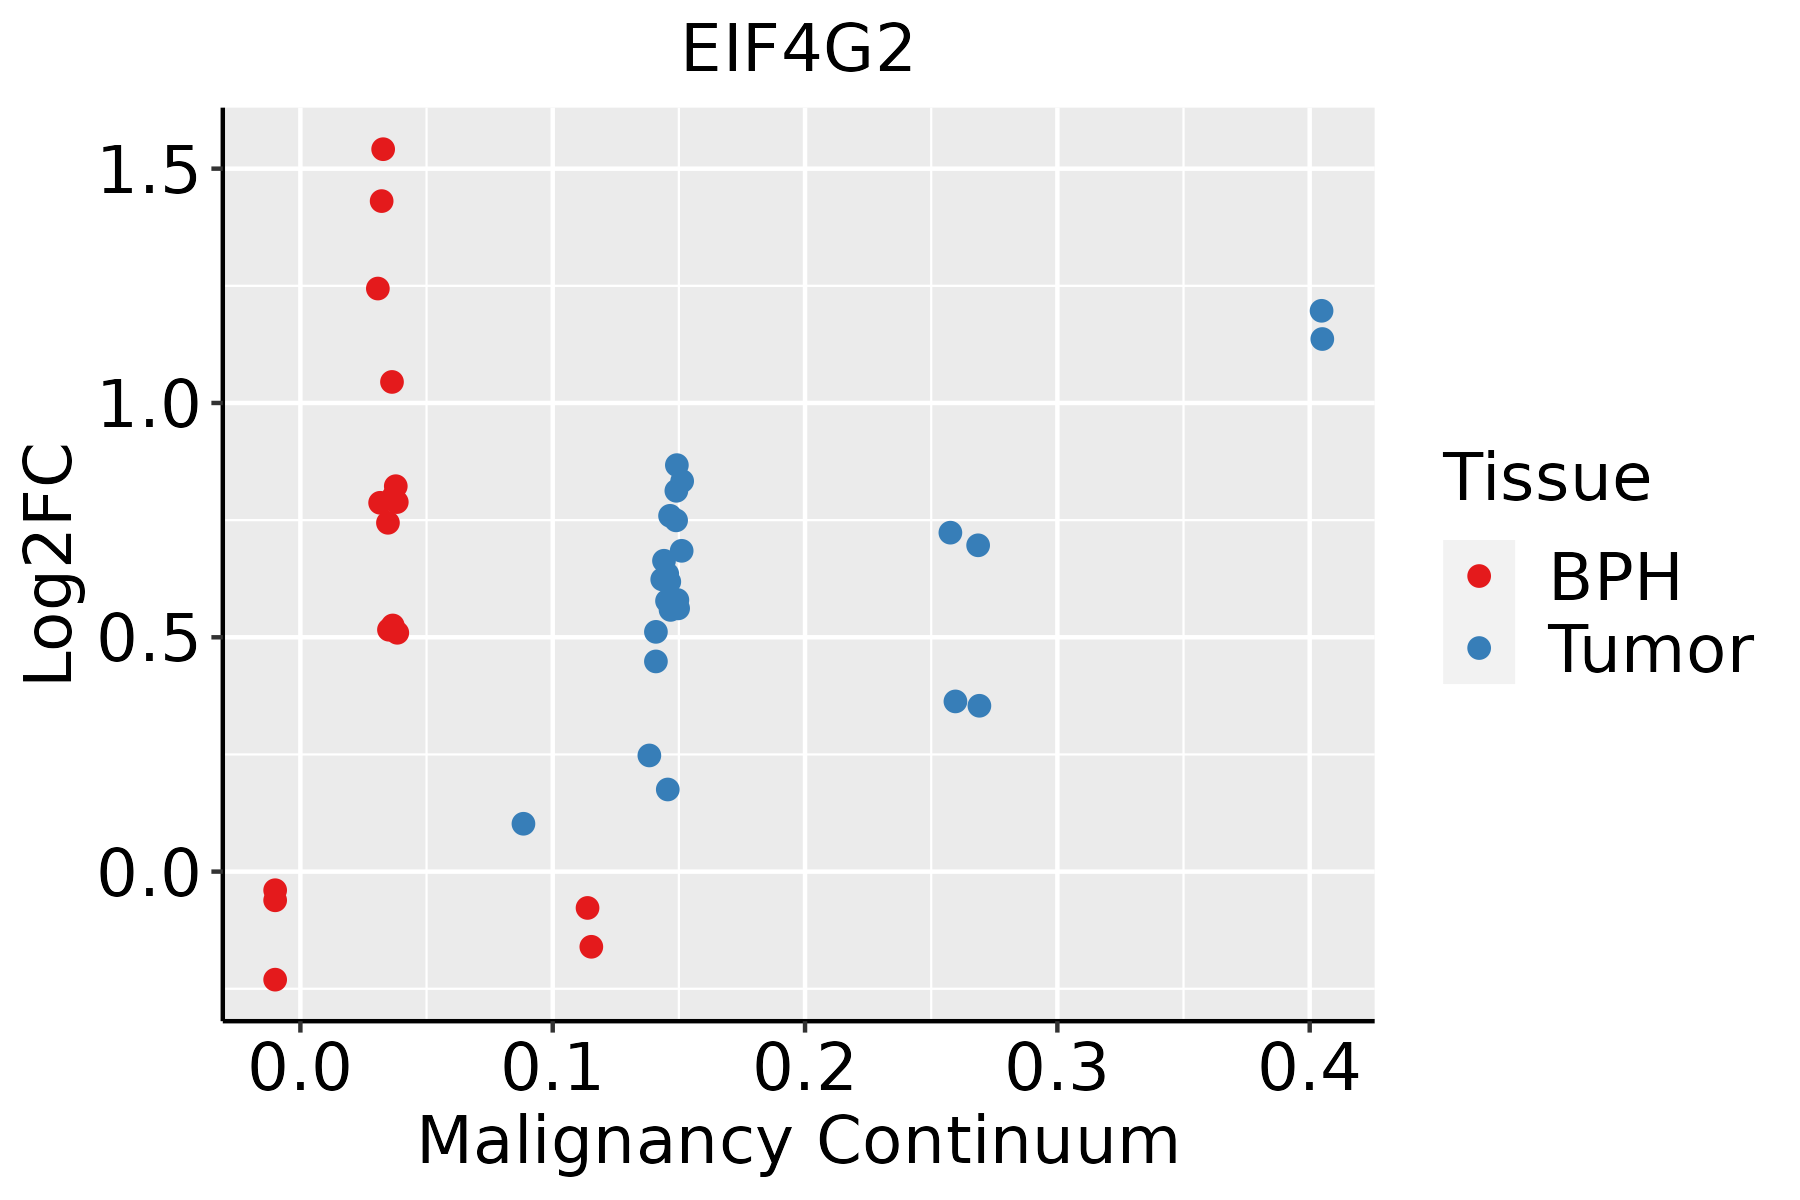 | BPH: Benign Prostatic Hyperplasia |
| Skin |  | AK: Actinic keratosis |
| cSCC: Cutaneous squamous cell carcinoma | ||
| SCCIS:squamous cell carcinoma in situ | ||
| Thyroid | 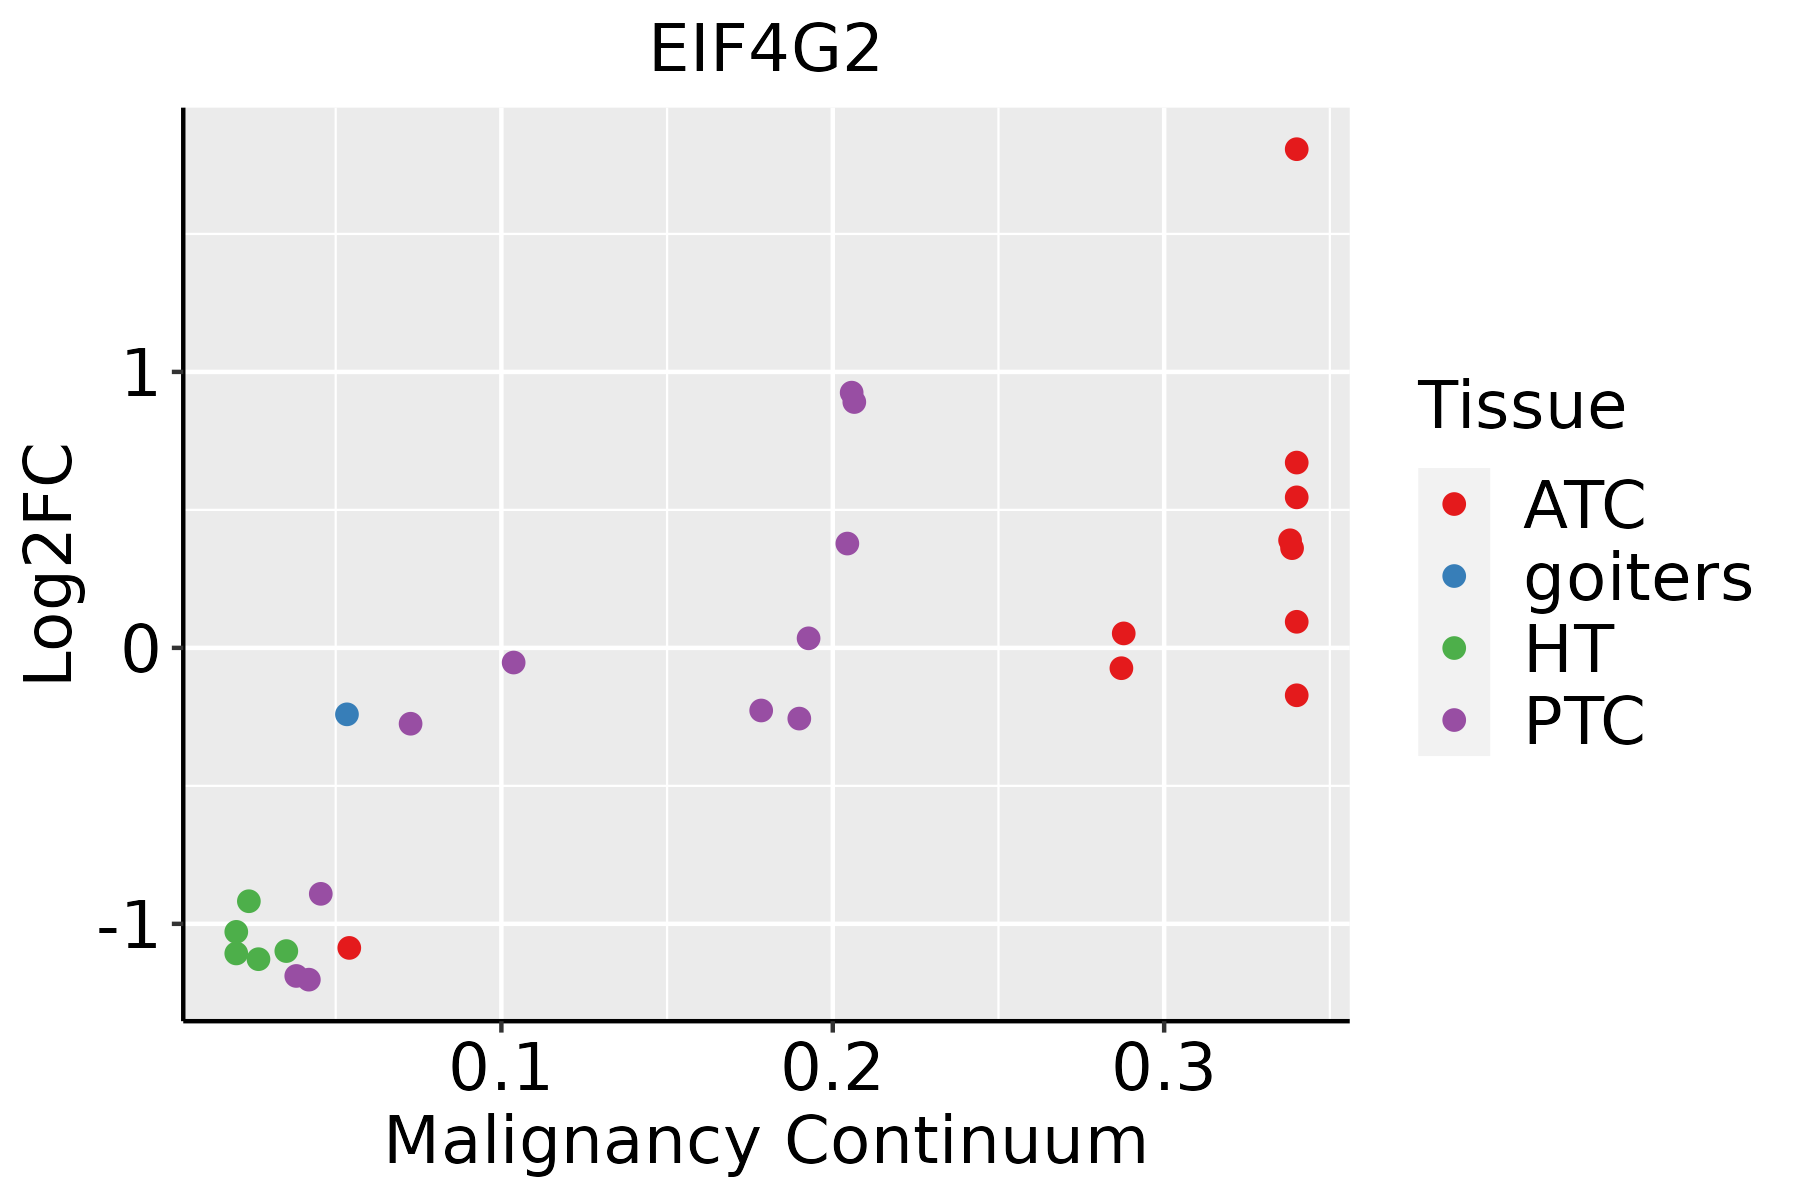 | ATC: Anaplastic thyroid cancer |
| HT: Hashimoto's thyroiditis | ||
| PTC: Papillary thyroid cancer |
| ∗log2FC in expression of this searched gene in stem-like cells from each diseased tissue sample relative to stem-like cells in normal samples in each tissue plotted against the malignancy continuum. Samples are colored based on if they are from different disease stage. |
Top |
Malignant transformation related pathway analysis |
| Find out the enriched GO biological processes and KEGG pathways involved in transition from healthy to precancer to cancer |
| Tissue | Disease Stage | Enriched GO biological Processes |
| Colorectum | AD |  |
| Colorectum | SER |  |
| Colorectum | MSS |  |
| Colorectum | MSI-H |  |
| Colorectum | FAP |  |
| ∗Top 15 enriched GO BP terms are showed in the bar plot of each disease state in each tissue. Each row represents a significant GO biological process which is colored according to the -log10(p.adjust). |
| Page: 1 2 3 4 5 6 7 8 9 |
| GO ID | Tissue | Disease Stage | Description | Gene Ratio | Bg Ratio | pvalue | p.adjust | Count |
| GO:00064138 | Breast | Precancer | translational initiation | 30/1080 | 118/18723 | 3.23e-12 | 5.58e-10 | 30 |
| GO:00064179 | Breast | Precancer | regulation of translation | 67/1080 | 468/18723 | 4.71e-12 | 7.64e-10 | 67 |
| GO:00457279 | Breast | Precancer | positive regulation of translation | 32/1080 | 136/18723 | 5.89e-12 | 9.27e-10 | 32 |
| GO:00342509 | Breast | Precancer | positive regulation of cellular amide metabolic process | 33/1080 | 162/18723 | 1.72e-10 | 1.77e-08 | 33 |
| GO:00064466 | Breast | Precancer | regulation of translational initiation | 19/1080 | 79/18723 | 7.99e-08 | 4.60e-06 | 19 |
| GO:00313309 | Breast | Precancer | negative regulation of cellular catabolic process | 34/1080 | 262/18723 | 8.16e-06 | 2.20e-04 | 34 |
| GO:00098959 | Breast | Precancer | negative regulation of catabolic process | 36/1080 | 320/18723 | 9.92e-05 | 1.83e-03 | 36 |
| GO:00160497 | Breast | Precancer | cell growth | 46/1080 | 482/18723 | 5.63e-04 | 7.16e-03 | 46 |
| GO:00015587 | Breast | Precancer | regulation of cell growth | 39/1080 | 414/18723 | 1.81e-03 | 1.78e-02 | 39 |
| GO:000641313 | Breast | IDC | translational initiation | 31/1434 | 118/18723 | 7.29e-10 | 7.52e-08 | 31 |
| GO:000641714 | Breast | IDC | regulation of translation | 74/1434 | 468/18723 | 1.67e-09 | 1.53e-07 | 74 |
| GO:004572714 | Breast | IDC | positive regulation of translation | 33/1434 | 136/18723 | 1.92e-09 | 1.73e-07 | 33 |
| GO:003425014 | Breast | IDC | positive regulation of cellular amide metabolic process | 35/1434 | 162/18723 | 1.63e-08 | 1.16e-06 | 35 |
| GO:000644613 | Breast | IDC | regulation of translational initiation | 20/1434 | 79/18723 | 1.40e-06 | 6.00e-05 | 20 |
| GO:003133014 | Breast | IDC | negative regulation of cellular catabolic process | 37/1434 | 262/18723 | 2.20e-04 | 3.52e-03 | 37 |
| GO:001604913 | Breast | IDC | cell growth | 56/1434 | 482/18723 | 1.16e-03 | 1.26e-02 | 56 |
| GO:000989514 | Breast | IDC | negative regulation of catabolic process | 40/1434 | 320/18723 | 1.49e-03 | 1.50e-02 | 40 |
| GO:000155813 | Breast | IDC | regulation of cell growth | 49/1434 | 414/18723 | 1.55e-03 | 1.55e-02 | 49 |
| GO:00325358 | Breast | IDC | regulation of cellular component size | 45/1434 | 383/18723 | 2.72e-03 | 2.41e-02 | 45 |
| GO:000641323 | Breast | DCIS | translational initiation | 30/1390 | 118/18723 | 1.53e-09 | 1.43e-07 | 30 |
| Page: 1 2 3 4 5 6 7 8 9 10 11 12 13 14 15 16 17 18 19 20 21 22 23 24 25 26 27 28 29 30 31 32 33 34 35 36 37 38 |
| Pathway ID | Tissue | Disease Stage | Description | Gene Ratio | Bg Ratio | pvalue | p.adjust | qvalue | Count |
| hsa0541618 | Breast | Precancer | Viral myocarditis | 14/684 | 60/8465 | 2.32e-04 | 1.98e-03 | 1.52e-03 | 14 |
| hsa0541619 | Breast | Precancer | Viral myocarditis | 14/684 | 60/8465 | 2.32e-04 | 1.98e-03 | 1.52e-03 | 14 |
| hsa0541623 | Breast | IDC | Viral myocarditis | 18/867 | 60/8465 | 1.85e-05 | 2.01e-04 | 1.50e-04 | 18 |
| hsa0541633 | Breast | IDC | Viral myocarditis | 18/867 | 60/8465 | 1.85e-05 | 2.01e-04 | 1.50e-04 | 18 |
| hsa0541642 | Breast | DCIS | Viral myocarditis | 19/846 | 60/8465 | 3.12e-06 | 4.20e-05 | 3.09e-05 | 19 |
| hsa0541652 | Breast | DCIS | Viral myocarditis | 19/846 | 60/8465 | 3.12e-06 | 4.20e-05 | 3.09e-05 | 19 |
| hsa0541620 | Cervix | CC | Viral myocarditis | 27/1267 | 60/8465 | 2.43e-08 | 3.57e-07 | 2.11e-07 | 27 |
| hsa05416110 | Cervix | CC | Viral myocarditis | 27/1267 | 60/8465 | 2.43e-08 | 3.57e-07 | 2.11e-07 | 27 |
| hsa05416 | Colorectum | MSI-H | Viral myocarditis | 14/797 | 60/8465 | 1.09e-03 | 1.20e-02 | 1.01e-02 | 14 |
| hsa054161 | Colorectum | MSI-H | Viral myocarditis | 14/797 | 60/8465 | 1.09e-03 | 1.20e-02 | 1.01e-02 | 14 |
| hsa0541625 | Endometrium | AEH | Viral myocarditis | 27/1197 | 60/8465 | 6.98e-09 | 1.13e-07 | 8.30e-08 | 27 |
| hsa05416111 | Endometrium | AEH | Viral myocarditis | 27/1197 | 60/8465 | 6.98e-09 | 1.13e-07 | 8.30e-08 | 27 |
| hsa0541626 | Endometrium | EEC | Viral myocarditis | 28/1237 | 60/8465 | 2.81e-09 | 5.77e-08 | 4.30e-08 | 28 |
| hsa0541635 | Endometrium | EEC | Viral myocarditis | 28/1237 | 60/8465 | 2.81e-09 | 5.77e-08 | 4.30e-08 | 28 |
| hsa0541630 | Esophagus | ESCC | Viral myocarditis | 41/4205 | 60/8465 | 2.59e-03 | 7.05e-03 | 3.61e-03 | 41 |
| hsa05416114 | Esophagus | ESCC | Viral myocarditis | 41/4205 | 60/8465 | 2.59e-03 | 7.05e-03 | 3.61e-03 | 41 |
| hsa0541614 | Liver | Cirrhotic | Viral myocarditis | 28/2530 | 60/8465 | 4.38e-03 | 1.68e-02 | 1.03e-02 | 28 |
| hsa0541615 | Liver | Cirrhotic | Viral myocarditis | 28/2530 | 60/8465 | 4.38e-03 | 1.68e-02 | 1.03e-02 | 28 |
| hsa0541616 | Lung | IAC | Viral myocarditis | 21/1053 | 60/8465 | 5.30e-06 | 1.57e-04 | 1.04e-04 | 21 |
| hsa0541617 | Lung | IAC | Viral myocarditis | 21/1053 | 60/8465 | 5.30e-06 | 1.57e-04 | 1.04e-04 | 21 |
| Page: 1 2 3 |
Top |
Cell-cell communication analysis |
| Identification of potential cell-cell interactions between two cell types and their ligand-receptor pairs for different disease states |
| Ligand | Receptor | LRpair | Pathway | Tissue | Disease Stage |
| Page: 1 |
Top |
Single-cell gene regulatory network inference analysis |
| Find out the significant the regulons (TFs) and the target genes of each regulon across cell types for different disease states |
| TF | Cell Type | Tissue | Disease Stage | Target Gene | RSS | Regulon Activity |
| ∗The dot plots of a searched regulon are shown for all cell subpopulations in each disease state of each tissue based on the regulon specific score inferred using pySCENIC and by calculating the average expression. |
| Page: 1 |
Top |
Somatic mutation of malignant transformation related genes |
| Annotation of somatic variants for genes involved in malignant transformation |
| Hugo Symbol | Variant Class | Variant Classification | dbSNP RS | HGVSc | HGVSp | HGVSp Short | SWISSPROT | BIOTYPE | SIFT | PolyPhen | Tumor Sample Barcode | Tissue | Histology | Sex | Age | Stage | Therapy Types | Drugs | Outcome |
| EIF4G2 | SNV | Missense_Mutation | c.287N>C | p.Leu96Pro | p.L96P | protein_coding | deleterious(0) | probably_damaging(0.999) | TCGA-AR-A0TP-01 | Breast | breast invasive carcinoma | Female | <65 | I/II | Chemotherapy | doxorubicin | SD | ||
| EIF4G2 | SNV | Missense_Mutation | c.823G>T | p.Asp275Tyr | p.D275Y | protein_coding | deleterious(0) | probably_damaging(0.998) | TCGA-AR-A250-01 | Breast | breast invasive carcinoma | Female | <65 | I/II | Chemotherapy | doxorubicin | SD | ||
| EIF4G2 | SNV | Missense_Mutation | c.154N>T | p.Pro52Ser | p.P52S | protein_coding | deleterious(0) | probably_damaging(0.996) | TCGA-B6-A0RE-01 | Breast | breast invasive carcinoma | Female | <65 | I/II | Unknown | Unknown | SD | ||
| EIF4G2 | SNV | Missense_Mutation | rs377433815 | c.583N>A | p.Glu195Lys | p.E195K | protein_coding | tolerated(0.07) | probably_damaging(0.976) | TCGA-BH-A0B6-01 | Breast | breast invasive carcinoma | Female | <65 | I/II | Unknown | Unknown | SD | |
| EIF4G2 | insertion | Nonsense_Mutation | novel | c.916_917insCTTAATGCAGATGAGGTACATTTGCCTATGTTACTTATATACCAT | p.Glu306delinsAlaTerCysArgTerGlyThrPheAlaTyrValThrTyrIleProTer | p.E306delinsA*CR*GTFAYVTYIP* | protein_coding | TCGA-AR-A0TY-01 | Breast | breast invasive carcinoma | Female | <65 | I/II | Unspecific | Paclitaxel | PD | |||
| EIF4G2 | deletion | Frame_Shift_Del | novel | c.1477delC | p.Gln493ArgfsTer2 | p.Q493Rfs*2 | protein_coding | TCGA-EW-A2FV-01 | Breast | breast invasive carcinoma | Female | <65 | III/IV | Chemotherapy | docetaxel | SD | |||
| EIF4G2 | SNV | Missense_Mutation | novel | c.1987N>A | p.Gln663Lys | p.Q663K | protein_coding | tolerated(0.76) | benign(0.022) | TCGA-C5-A8XH-01 | Cervix | cervical & endocervical cancer | Female | <65 | I/II | Unknown | Unknown | SD | |
| EIF4G2 | SNV | Missense_Mutation | c.533G>A | p.Arg178Gln | p.R178Q | protein_coding | deleterious(0) | possibly_damaging(0.809) | TCGA-EA-A3HS-01 | Cervix | cervical & endocervical cancer | Female | <65 | I/II | Unknown | Unknown | SD | ||
| EIF4G2 | SNV | Missense_Mutation | novel | c.1938N>G | p.Phe646Leu | p.F646L | protein_coding | tolerated(0.51) | possibly_damaging(0.782) | TCGA-IR-A3LI-01 | Cervix | cervical & endocervical cancer | Female | <65 | I/II | Chemotherapy | cisplatin | CR | |
| EIF4G2 | SNV | Missense_Mutation | novel | c.753N>C | p.Leu251Phe | p.L251F | protein_coding | deleterious(0.01) | probably_damaging(0.99) | TCGA-JW-A5VL-01 | Cervix | cervical & endocervical cancer | Female | <65 | I/II | Unknown | Unknown | SD |
| Page: 1 2 3 4 5 6 7 8 9 10 |
Top |
Related drugs of malignant transformation related genes |
| Identification of chemicals and drugs interact with genes involved in malignant transfromation |
| (DGIdb 4.0) |
| Entrez ID | Symbol | Category | Interaction Types | Drug Claim Name | Drug Name | PMIDs |
| Page: 1 |

Copyright 2023-Present -The University of Texas Health Science Center at Houston |