
|
|||||
|
 | |
| |
| |
| |
| |
| |
|
Gene: EIF4EBP2 |
Gene summary for EIF4EBP2 |
| Gene information | Species | Human | Gene symbol | EIF4EBP2 | Gene ID | 1979 |
| Gene name | eukaryotic translation initiation factor 4E binding protein 2 | |
| Gene Alias | 4EBP2 | |
| Cytomap | 10q22.1 | |
| Gene Type | protein-coding | GO ID | GO:0003008 | UniProtAcc | A0A024QZM3 |
Top |
Malignant transformation analysis |
| Identification of the aberrant gene expression in precancerous and cancerous lesions by comparing the gene expression of stem-like cells in diseased tissues with normal stem cells |
| Entrez ID | Symbol | Replicates | Species | Organ | Tissue | Adj P-value | Log2FC | Malignancy |
| 1979 | EIF4EBP2 | HTA11_3410_2000001011 | Human | Colorectum | AD | 2.71e-03 | 2.09e-01 | 0.0155 |
| 1979 | EIF4EBP2 | HTA11_2487_2000001011 | Human | Colorectum | SER | 2.73e-12 | 7.38e-01 | -0.1808 |
| 1979 | EIF4EBP2 | HTA11_1938_2000001011 | Human | Colorectum | AD | 8.69e-08 | 5.66e-01 | -0.0811 |
| 1979 | EIF4EBP2 | HTA11_78_2000001011 | Human | Colorectum | AD | 5.88e-24 | 9.05e-01 | -0.1088 |
| 1979 | EIF4EBP2 | HTA11_347_2000001011 | Human | Colorectum | AD | 3.91e-39 | 9.61e-01 | -0.1954 |
| 1979 | EIF4EBP2 | HTA11_411_2000001011 | Human | Colorectum | SER | 5.14e-10 | 1.30e+00 | -0.2602 |
| 1979 | EIF4EBP2 | HTA11_3361_2000001011 | Human | Colorectum | AD | 9.63e-06 | 5.14e-01 | -0.1207 |
| 1979 | EIF4EBP2 | HTA11_83_2000001011 | Human | Colorectum | SER | 1.33e-06 | 5.45e-01 | -0.1526 |
| 1979 | EIF4EBP2 | HTA11_696_2000001011 | Human | Colorectum | AD | 1.70e-09 | 4.49e-01 | -0.1464 |
| 1979 | EIF4EBP2 | HTA11_866_2000001011 | Human | Colorectum | AD | 1.51e-04 | 3.06e-01 | -0.1001 |
| 1979 | EIF4EBP2 | HTA11_1391_2000001011 | Human | Colorectum | AD | 1.62e-12 | 5.82e-01 | -0.059 |
| 1979 | EIF4EBP2 | HTA11_2992_2000001011 | Human | Colorectum | SER | 7.30e-09 | 7.96e-01 | -0.1706 |
| 1979 | EIF4EBP2 | HTA11_5212_2000001011 | Human | Colorectum | AD | 4.90e-17 | 1.20e+00 | -0.2061 |
| 1979 | EIF4EBP2 | HTA11_5216_2000001011 | Human | Colorectum | SER | 3.79e-02 | 7.04e-01 | -0.1462 |
| 1979 | EIF4EBP2 | HTA11_7862_2000001011 | Human | Colorectum | AD | 2.24e-02 | 4.24e-01 | -0.0179 |
| 1979 | EIF4EBP2 | HTA11_866_3004761011 | Human | Colorectum | AD | 5.54e-09 | 4.67e-01 | 0.096 |
| 1979 | EIF4EBP2 | HTA11_4255_2000001011 | Human | Colorectum | SER | 4.04e-02 | 3.73e-01 | 0.0446 |
| 1979 | EIF4EBP2 | HTA11_7663_2000001011 | Human | Colorectum | SER | 8.22e-06 | 7.30e-01 | 0.0131 |
| 1979 | EIF4EBP2 | HTA11_10623_2000001011 | Human | Colorectum | AD | 1.16e-04 | 4.89e-01 | -0.0177 |
| 1979 | EIF4EBP2 | HTA11_6801_2000001011 | Human | Colorectum | SER | 3.34e-04 | 6.75e-01 | 0.0171 |
| Page: 1 2 3 4 5 6 7 |
| Tissue | Expression Dynamics | Abbreviation |
| Colorectum (GSE201348) |  | FAP: Familial adenomatous polyposis |
| CRC: Colorectal cancer | ||
| Colorectum (HTA11) |  | AD: Adenomas |
| SER: Sessile serrated lesions | ||
| MSI-H: Microsatellite-high colorectal cancer | ||
| MSS: Microsatellite stable colorectal cancer | ||
| Esophagus | 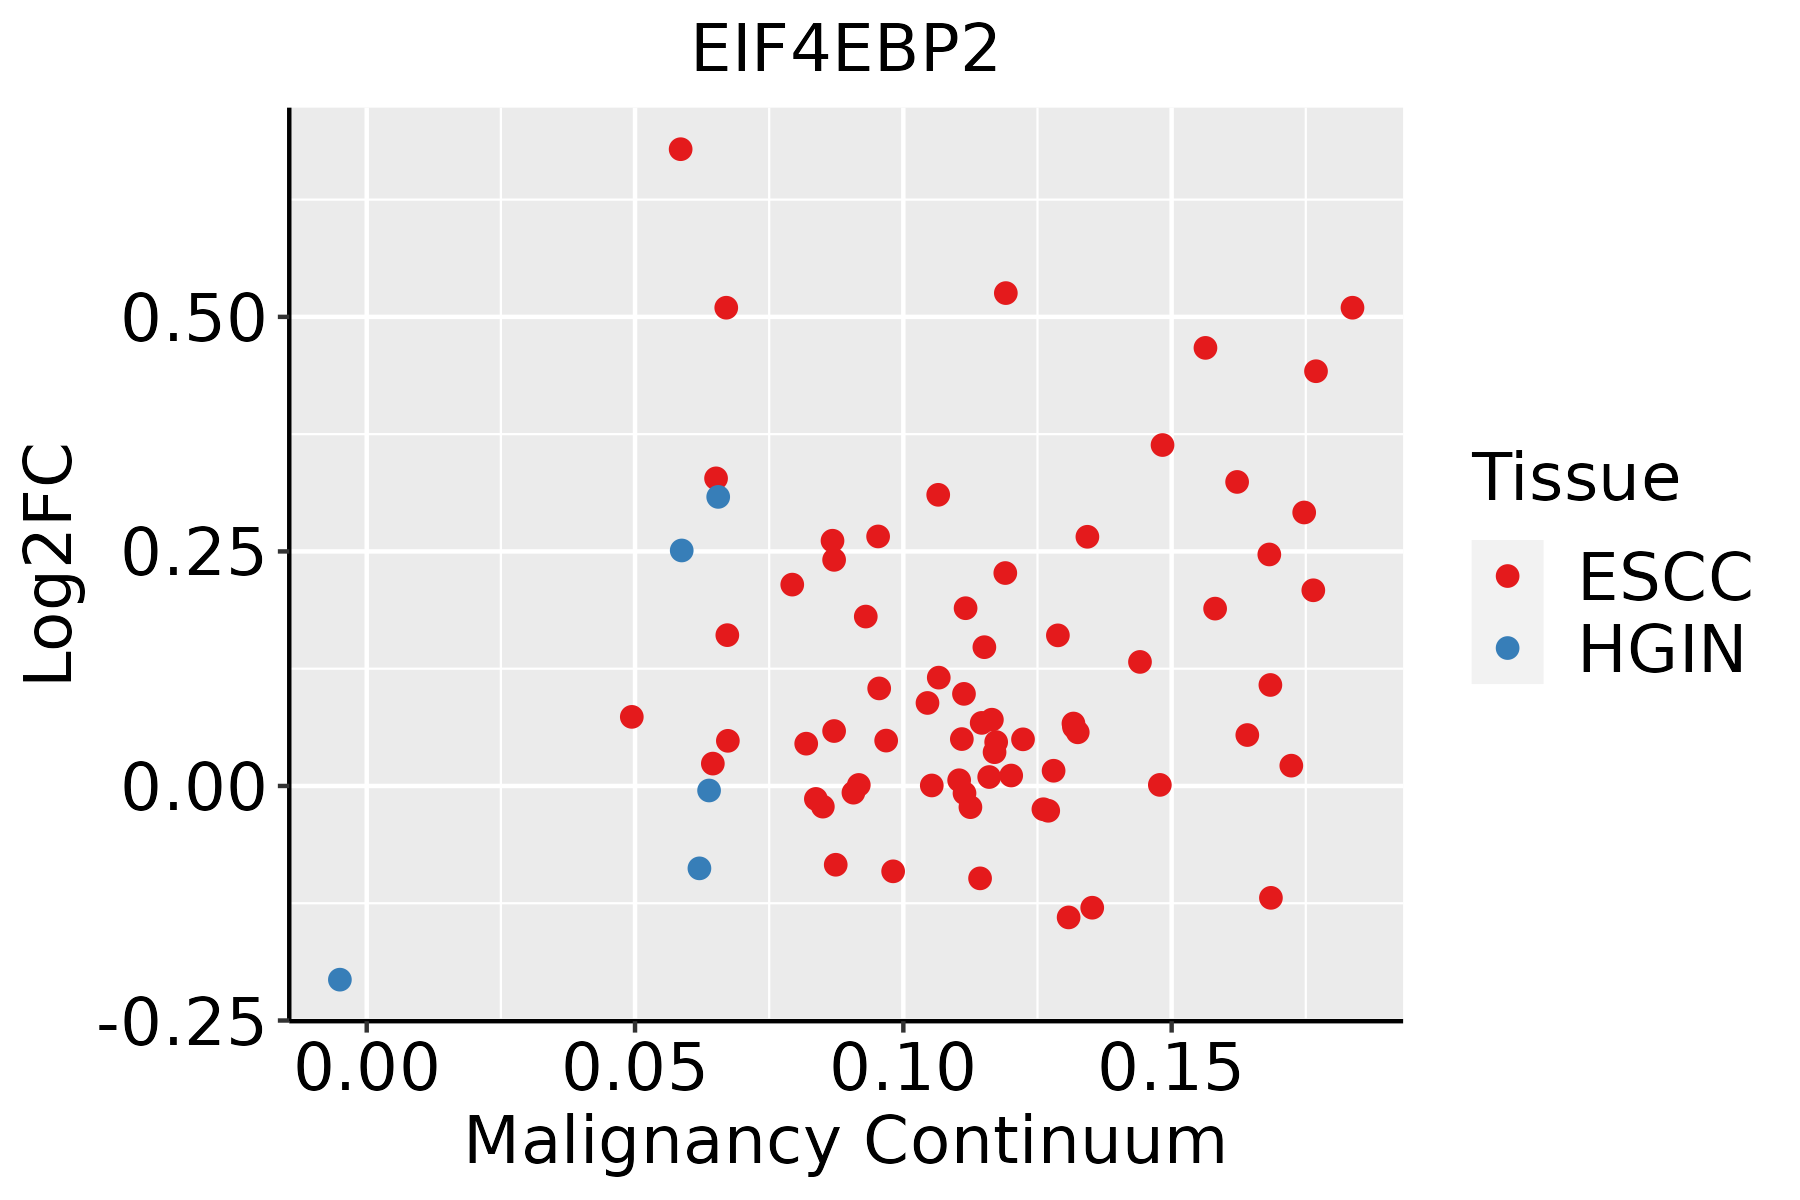 | ESCC: Esophageal squamous cell carcinoma |
| HGIN: High-grade intraepithelial neoplasias | ||
| LGIN: Low-grade intraepithelial neoplasias | ||
| Liver | 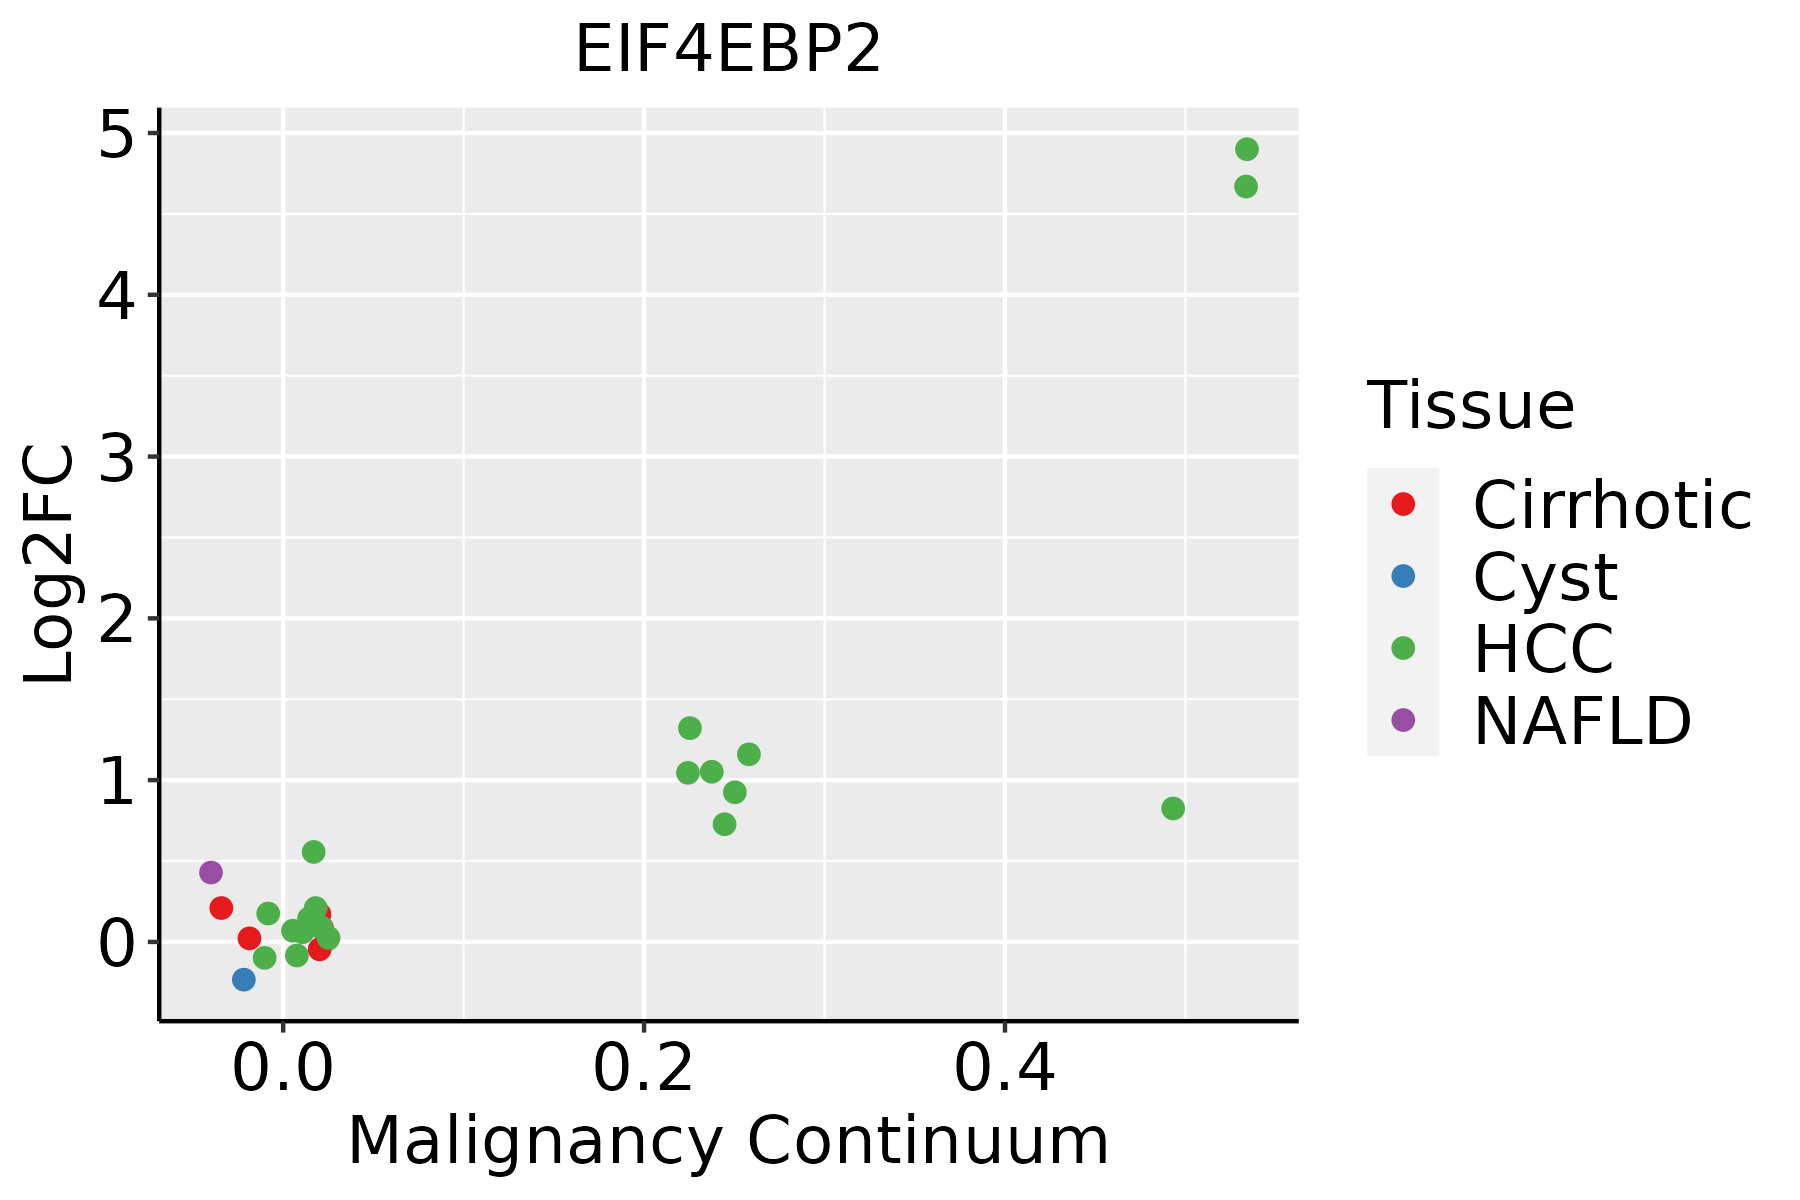 | HCC: Hepatocellular carcinoma |
| NAFLD: Non-alcoholic fatty liver disease | ||
| Oral Cavity |  | EOLP: Erosive Oral lichen planus |
| LP: leukoplakia | ||
| NEOLP: Non-erosive oral lichen planus | ||
| OSCC: Oral squamous cell carcinoma | ||
| Prostate | 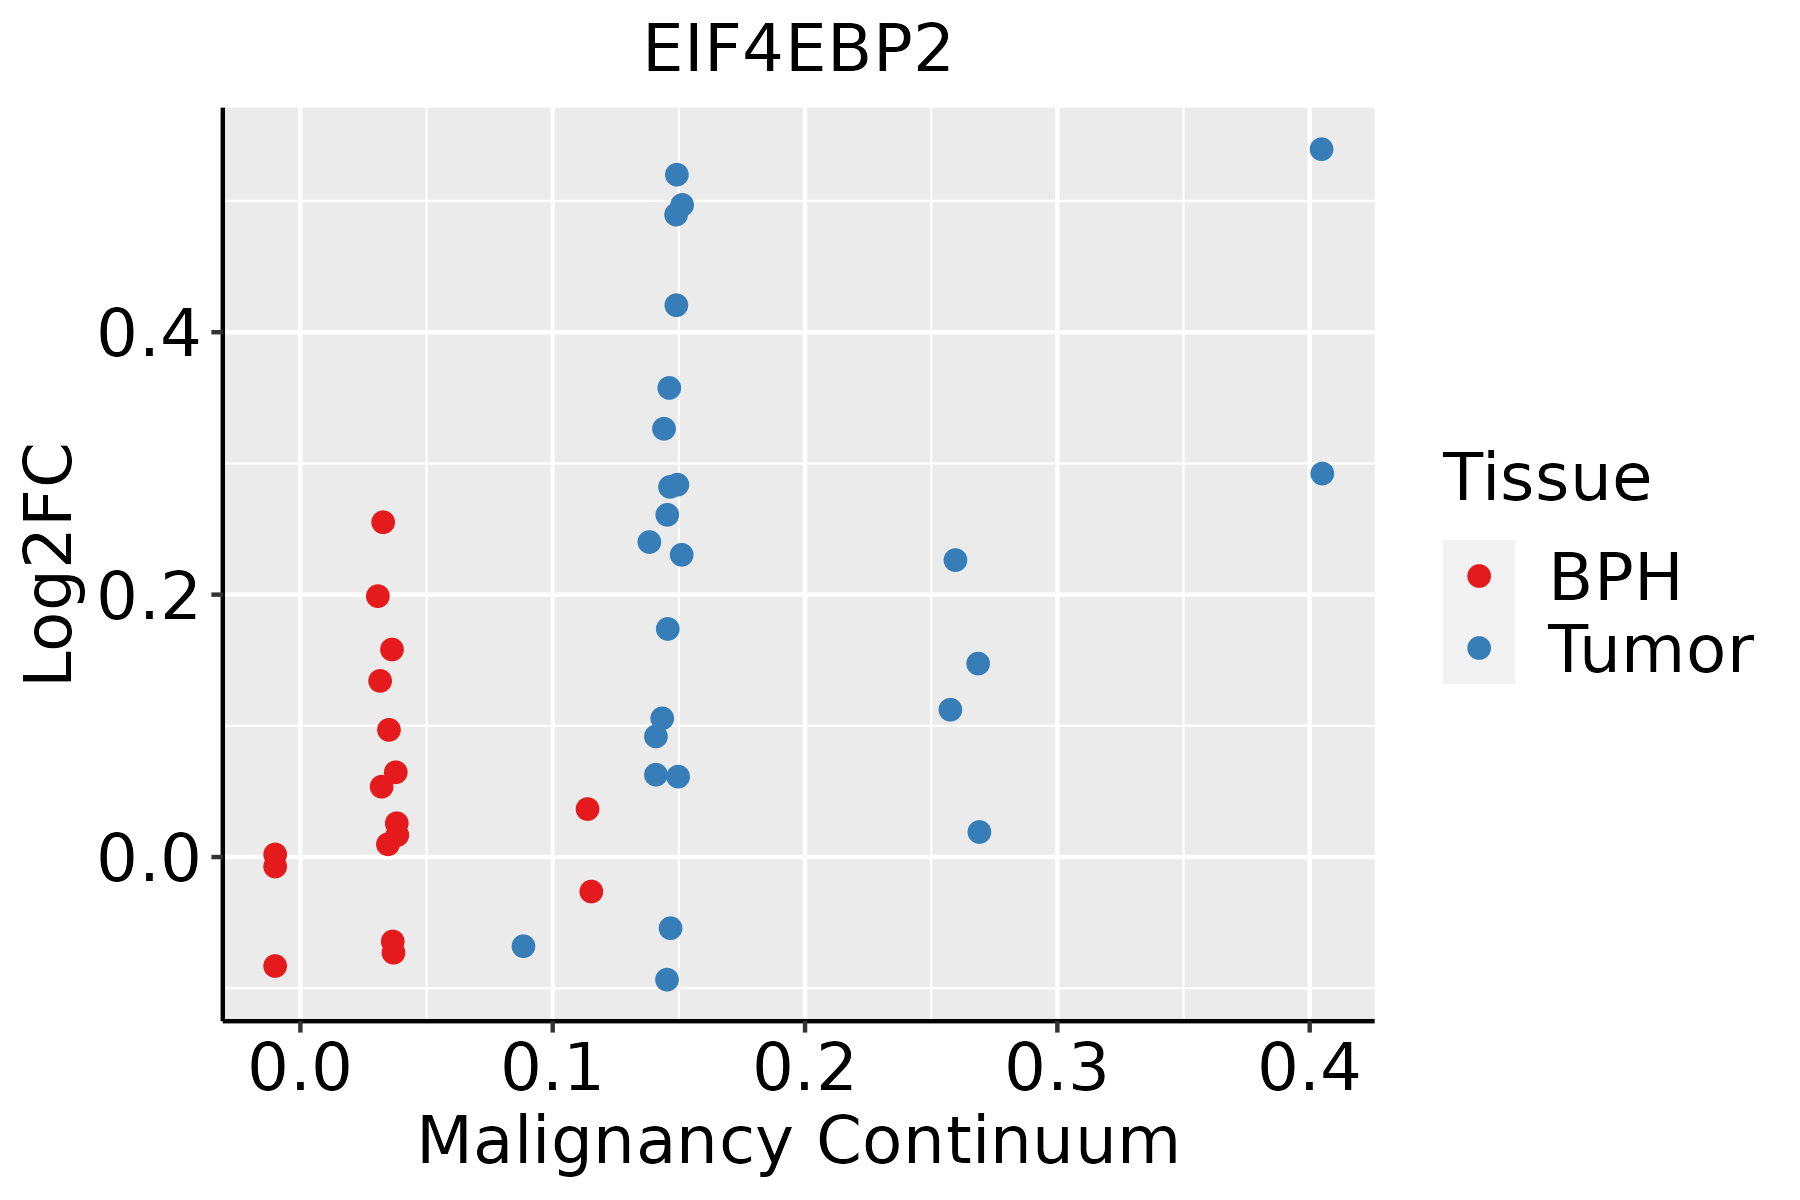 | BPH: Benign Prostatic Hyperplasia |
| Skin | 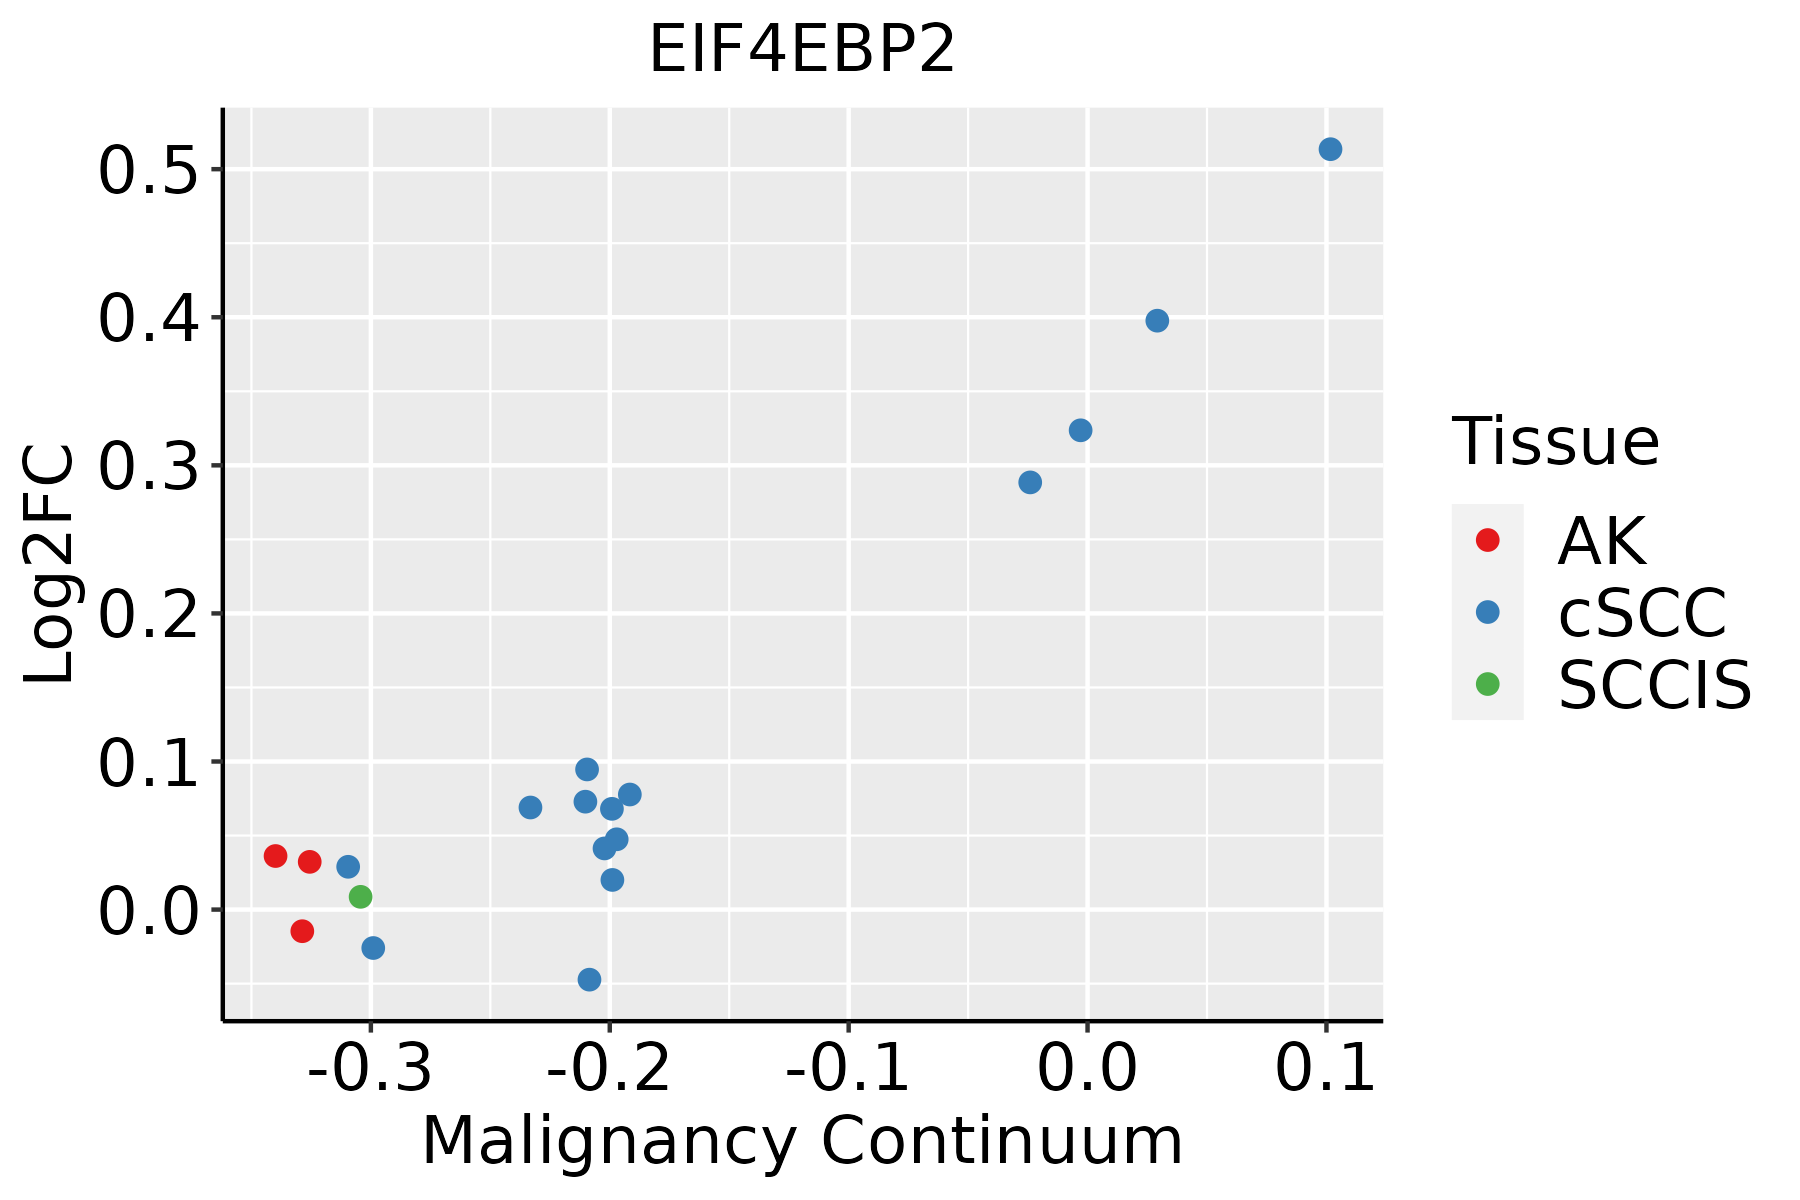 | AK: Actinic keratosis |
| cSCC: Cutaneous squamous cell carcinoma | ||
| SCCIS:squamous cell carcinoma in situ | ||
| Thyroid |  | ATC: Anaplastic thyroid cancer |
| HT: Hashimoto's thyroiditis | ||
| PTC: Papillary thyroid cancer |
| ∗log2FC in expression of this searched gene in stem-like cells from each diseased tissue sample relative to stem-like cells in normal samples in each tissue plotted against the malignancy continuum. Samples are colored based on if they are from different disease stage. |
Top |
Malignant transformation related pathway analysis |
| Find out the enriched GO biological processes and KEGG pathways involved in transition from healthy to precancer to cancer |
| Tissue | Disease Stage | Enriched GO biological Processes |
| Colorectum | AD |  |
| Colorectum | SER |  |
| Colorectum | MSS |  |
| Colorectum | MSI-H |  |
| Colorectum | FAP |  |
| ∗Top 15 enriched GO BP terms are showed in the bar plot of each disease state in each tissue. Each row represents a significant GO biological process which is colored according to the -log10(p.adjust). |
| Page: 1 2 3 4 5 6 7 8 9 |
| GO ID | Tissue | Disease Stage | Description | Gene Ratio | Bg Ratio | pvalue | p.adjust | Count |
| GO:0032868 | Colorectum | AD | response to insulin | 91/3918 | 264/18723 | 2.02e-07 | 8.48e-06 | 91 |
| GO:1901653 | Colorectum | AD | cellular response to peptide | 114/3918 | 359/18723 | 8.32e-07 | 2.88e-05 | 114 |
| GO:0032869 | Colorectum | AD | cellular response to insulin stimulus | 72/3918 | 203/18723 | 1.10e-06 | 3.68e-05 | 72 |
| GO:0006417 | Colorectum | AD | regulation of translation | 141/3918 | 468/18723 | 1.32e-06 | 4.22e-05 | 141 |
| GO:0071375 | Colorectum | AD | cellular response to peptide hormone stimulus | 95/3918 | 290/18723 | 1.50e-06 | 4.66e-05 | 95 |
| GO:0043434 | Colorectum | AD | response to peptide hormone | 126/3918 | 414/18723 | 2.70e-06 | 7.86e-05 | 126 |
| GO:0006413 | Colorectum | AD | translational initiation | 45/3918 | 118/18723 | 1.35e-05 | 2.92e-04 | 45 |
| GO:0006446 | Colorectum | AD | regulation of translational initiation | 28/3918 | 79/18723 | 2.02e-03 | 1.63e-02 | 28 |
| GO:00064131 | Colorectum | SER | translational initiation | 36/2897 | 118/18723 | 2.84e-05 | 7.63e-04 | 36 |
| GO:00328681 | Colorectum | SER | response to insulin | 65/2897 | 264/18723 | 6.70e-05 | 1.53e-03 | 65 |
| GO:19016531 | Colorectum | SER | cellular response to peptide | 83/2897 | 359/18723 | 8.03e-05 | 1.77e-03 | 83 |
| GO:00434341 | Colorectum | SER | response to peptide hormone | 93/2897 | 414/18723 | 9.61e-05 | 2.04e-03 | 93 |
| GO:00713751 | Colorectum | SER | cellular response to peptide hormone stimulus | 68/2897 | 290/18723 | 2.20e-04 | 3.89e-03 | 68 |
| GO:00328691 | Colorectum | SER | cellular response to insulin stimulus | 51/2897 | 203/18723 | 2.30e-04 | 3.96e-03 | 51 |
| GO:00064171 | Colorectum | SER | regulation of translation | 100/2897 | 468/18723 | 3.76e-04 | 5.74e-03 | 100 |
| GO:00064172 | Colorectum | MSS | regulation of translation | 134/3467 | 468/18723 | 4.43e-08 | 2.38e-06 | 134 |
| GO:00064132 | Colorectum | MSS | translational initiation | 43/3467 | 118/18723 | 3.19e-06 | 9.38e-05 | 43 |
| GO:00434342 | Colorectum | MSS | response to peptide hormone | 104/3467 | 414/18723 | 4.58e-04 | 5.43e-03 | 104 |
| GO:19016532 | Colorectum | MSS | cellular response to peptide | 91/3467 | 359/18723 | 7.38e-04 | 7.88e-03 | 91 |
| GO:00328692 | Colorectum | MSS | cellular response to insulin stimulus | 56/3467 | 203/18723 | 9.41e-04 | 9.50e-03 | 56 |
| Page: 1 2 3 4 5 6 7 8 9 10 |
| Pathway ID | Tissue | Disease Stage | Description | Gene Ratio | Bg Ratio | pvalue | p.adjust | qvalue | Count |
| hsa04213 | Colorectum | AD | Longevity regulating pathway - multiple species | 27/2092 | 62/8465 | 8.72e-04 | 5.96e-03 | 3.80e-03 | 27 |
| hsa042131 | Colorectum | AD | Longevity regulating pathway - multiple species | 27/2092 | 62/8465 | 8.72e-04 | 5.96e-03 | 3.80e-03 | 27 |
| hsa042132 | Colorectum | SER | Longevity regulating pathway - multiple species | 20/1580 | 62/8465 | 7.15e-03 | 3.77e-02 | 2.74e-02 | 20 |
| hsa042133 | Colorectum | SER | Longevity regulating pathway - multiple species | 20/1580 | 62/8465 | 7.15e-03 | 3.77e-02 | 2.74e-02 | 20 |
| hsa042134 | Colorectum | MSS | Longevity regulating pathway - multiple species | 27/1875 | 62/8465 | 1.33e-04 | 1.17e-03 | 7.18e-04 | 27 |
| hsa042135 | Colorectum | MSS | Longevity regulating pathway - multiple species | 27/1875 | 62/8465 | 1.33e-04 | 1.17e-03 | 7.18e-04 | 27 |
| hsa042138 | Liver | HCC | Longevity regulating pathway - multiple species | 41/4020 | 62/8465 | 2.30e-03 | 7.86e-03 | 4.37e-03 | 41 |
| hsa0421311 | Liver | HCC | Longevity regulating pathway - multiple species | 41/4020 | 62/8465 | 2.30e-03 | 7.86e-03 | 4.37e-03 | 41 |
| hsa0421310 | Oral cavity | OSCC | Longevity regulating pathway - multiple species | 38/3704 | 62/8465 | 3.97e-03 | 9.86e-03 | 5.02e-03 | 38 |
| hsa0421313 | Oral cavity | OSCC | Longevity regulating pathway - multiple species | 38/3704 | 62/8465 | 3.97e-03 | 9.86e-03 | 5.02e-03 | 38 |
| hsa042139 | Prostate | BPH | Longevity regulating pathway - multiple species | 20/1718 | 62/8465 | 1.78e-02 | 4.98e-02 | 3.08e-02 | 20 |
| hsa0421312 | Prostate | BPH | Longevity regulating pathway - multiple species | 20/1718 | 62/8465 | 1.78e-02 | 4.98e-02 | 3.08e-02 | 20 |
| Page: 1 |
Top |
Cell-cell communication analysis |
| Identification of potential cell-cell interactions between two cell types and their ligand-receptor pairs for different disease states |
| Ligand | Receptor | LRpair | Pathway | Tissue | Disease Stage |
| Page: 1 |
Top |
Single-cell gene regulatory network inference analysis |
| Find out the significant the regulons (TFs) and the target genes of each regulon across cell types for different disease states |
| TF | Cell Type | Tissue | Disease Stage | Target Gene | RSS | Regulon Activity |
| ∗The dot plots of a searched regulon are shown for all cell subpopulations in each disease state of each tissue based on the regulon specific score inferred using pySCENIC and by calculating the average expression. |
| Page: 1 |
Top |
Somatic mutation of malignant transformation related genes |
| Annotation of somatic variants for genes involved in malignant transformation |
| Hugo Symbol | Variant Class | Variant Classification | dbSNP RS | HGVSc | HGVSp | HGVSp Short | SWISSPROT | BIOTYPE | SIFT | PolyPhen | Tumor Sample Barcode | Tissue | Histology | Sex | Age | Stage | Therapy Types | Drugs | Outcome |
| EIF4EBP2 | SNV | Missense_Mutation | c.163N>T | p.Asp55Tyr | p.D55Y | Q13542 | protein_coding | deleterious(0) | possibly_damaging(0.761) | TCGA-A2-A25A-01 | Breast | breast invasive carcinoma | Female | <65 | I/II | Unspecific | Cytoxan | SD | |
| EIF4EBP2 | SNV | Missense_Mutation | rs201115758 | c.152N>A | p.Arg51Gln | p.R51Q | Q13542 | protein_coding | deleterious(0.02) | benign(0.038) | TCGA-AN-A046-01 | Breast | breast invasive carcinoma | Female | >=65 | I/II | Unknown | Unknown | SD |
| EIF4EBP2 | insertion | Frame_Shift_Ins | novel | c.351_352insC | p.Met118HisfsTer17 | p.M118Hfs*17 | Q13542 | protein_coding | TCGA-A2-A0EV-01 | Breast | breast invasive carcinoma | Female | >=65 | I/II | Unknown | Unknown | SD | ||
| EIF4EBP2 | insertion | Nonsense_Mutation | novel | c.352_353insAATAGACCTTGTTTCTTTTGTTTTGTTT | p.Met118LysfsTer2 | p.M118Kfs*2 | Q13542 | protein_coding | TCGA-A2-A0EV-01 | Breast | breast invasive carcinoma | Female | >=65 | I/II | Unknown | Unknown | SD | ||
| EIF4EBP2 | SNV | Missense_Mutation | novel | c.194N>A | p.Ser65Tyr | p.S65Y | Q13542 | protein_coding | deleterious(0) | probably_damaging(0.998) | TCGA-CA-6717-01 | Colorectum | colon adenocarcinoma | Male | <65 | I/II | Chemotherapy | oxaliplatin | CR |
| EIF4EBP2 | SNV | Missense_Mutation | c.185N>C | p.Arg62Pro | p.R62P | Q13542 | protein_coding | deleterious(0.03) | possibly_damaging(0.856) | TCGA-D5-6537-01 | Colorectum | colon adenocarcinoma | Male | <65 | III/IV | Unknown | Unknown | PD | |
| EIF4EBP2 | SNV | Missense_Mutation | c.277N>T | p.Val93Leu | p.V93L | Q13542 | protein_coding | tolerated(0.34) | benign(0.171) | TCGA-AG-A002-01 | Colorectum | rectum adenocarcinoma | Male | <65 | I/II | Unknown | Unknown | SD | |
| EIF4EBP2 | insertion | Frame_Shift_Ins | rs751644163 | c.114_115insG | p.Thr41AspfsTer15 | p.T41Dfs*15 | Q13542 | protein_coding | TCGA-F4-6856-01 | Colorectum | colon adenocarcinoma | Male | <65 | I/II | Ancillary | leucovorin | CR | ||
| EIF4EBP2 | SNV | Missense_Mutation | rs750591080 | c.188N>A | p.Arg63His | p.R63H | Q13542 | protein_coding | deleterious(0) | possibly_damaging(0.895) | TCGA-A5-A0G2-01 | Endometrium | uterine corpus endometrioid carcinoma | Female | <65 | III/IV | Unknown | Unknown | SD |
| EIF4EBP2 | SNV | Missense_Mutation | rs750591080 | c.188N>A | p.Arg63His | p.R63H | Q13542 | protein_coding | deleterious(0) | possibly_damaging(0.895) | TCGA-AJ-A3EK-01 | Endometrium | uterine corpus endometrioid carcinoma | Female | <65 | I/II | Chemotherapy | carboplatin | CR |
| Page: 1 2 |
Top |
Related drugs of malignant transformation related genes |
| Identification of chemicals and drugs interact with genes involved in malignant transfromation |
| (DGIdb 4.0) |
| Entrez ID | Symbol | Category | Interaction Types | Drug Claim Name | Drug Name | PMIDs |
| Page: 1 |

Copyright 2023-Present -The University of Texas Health Science Center at Houston |