
|
|||||
|
 | |
| |
| |
| |
| |
| |
|
Gene: EIF4B |
Gene summary for EIF4B |
| Gene information | Species | Human | Gene symbol | EIF4B | Gene ID | 1975 |
| Gene name | eukaryotic translation initiation factor 4B | |
| Gene Alias | EIF-4B | |
| Cytomap | 12q13.13 | |
| Gene Type | protein-coding | GO ID | GO:0001731 | UniProtAcc | B4DRM3 |
Top |
Malignant transformation analysis |
| Identification of the aberrant gene expression in precancerous and cancerous lesions by comparing the gene expression of stem-like cells in diseased tissues with normal stem cells |
| Entrez ID | Symbol | Replicates | Species | Organ | Tissue | Adj P-value | Log2FC | Malignancy |
| 1975 | EIF4B | GSM4909277 | Human | Breast | Precancer | 2.34e-02 | -7.42e-01 | 0.0177 |
| 1975 | EIF4B | GSM4909281 | Human | Breast | IDC | 6.83e-11 | -3.47e-01 | 0.21 |
| 1975 | EIF4B | GSM4909282 | Human | Breast | IDC | 5.50e-25 | -5.84e-01 | -0.0288 |
| 1975 | EIF4B | GSM4909286 | Human | Breast | IDC | 6.05e-05 | -3.31e-03 | 0.1081 |
| 1975 | EIF4B | GSM4909287 | Human | Breast | IDC | 1.10e-13 | -5.19e-01 | 0.2057 |
| 1975 | EIF4B | GSM4909290 | Human | Breast | IDC | 2.75e-04 | -3.45e-01 | 0.2096 |
| 1975 | EIF4B | GSM4909294 | Human | Breast | IDC | 7.66e-03 | -1.36e-01 | 0.2022 |
| 1975 | EIF4B | GSM4909296 | Human | Breast | IDC | 2.33e-14 | -3.49e-01 | 0.1524 |
| 1975 | EIF4B | GSM4909297 | Human | Breast | IDC | 1.22e-21 | -2.97e-01 | 0.1517 |
| 1975 | EIF4B | GSM4909301 | Human | Breast | IDC | 4.88e-15 | -4.18e-01 | 0.1577 |
| 1975 | EIF4B | GSM4909307 | Human | Breast | IDC | 6.81e-12 | -4.19e-01 | 0.1569 |
| 1975 | EIF4B | GSM4909308 | Human | Breast | IDC | 5.34e-05 | -2.67e-01 | 0.158 |
| 1975 | EIF4B | GSM4909309 | Human | Breast | IDC | 3.94e-08 | -4.15e-01 | 0.0483 |
| 1975 | EIF4B | GSM4909311 | Human | Breast | IDC | 3.32e-43 | -3.80e-01 | 0.1534 |
| 1975 | EIF4B | GSM4909312 | Human | Breast | IDC | 2.24e-12 | -9.34e-03 | 0.1552 |
| 1975 | EIF4B | GSM4909315 | Human | Breast | IDC | 4.22e-02 | -2.10e-01 | 0.21 |
| 1975 | EIF4B | GSM4909316 | Human | Breast | IDC | 2.95e-04 | -4.63e-01 | 0.21 |
| 1975 | EIF4B | GSM4909319 | Human | Breast | IDC | 1.66e-55 | -6.29e-01 | 0.1563 |
| 1975 | EIF4B | GSM4909320 | Human | Breast | IDC | 8.34e-18 | -7.36e-01 | 0.1575 |
| 1975 | EIF4B | GSM4909321 | Human | Breast | IDC | 2.64e-34 | -5.88e-01 | 0.1559 |
| Page: 1 2 3 4 5 6 7 8 9 10 11 12 13 |
| Tissue | Expression Dynamics | Abbreviation |
| Breast | 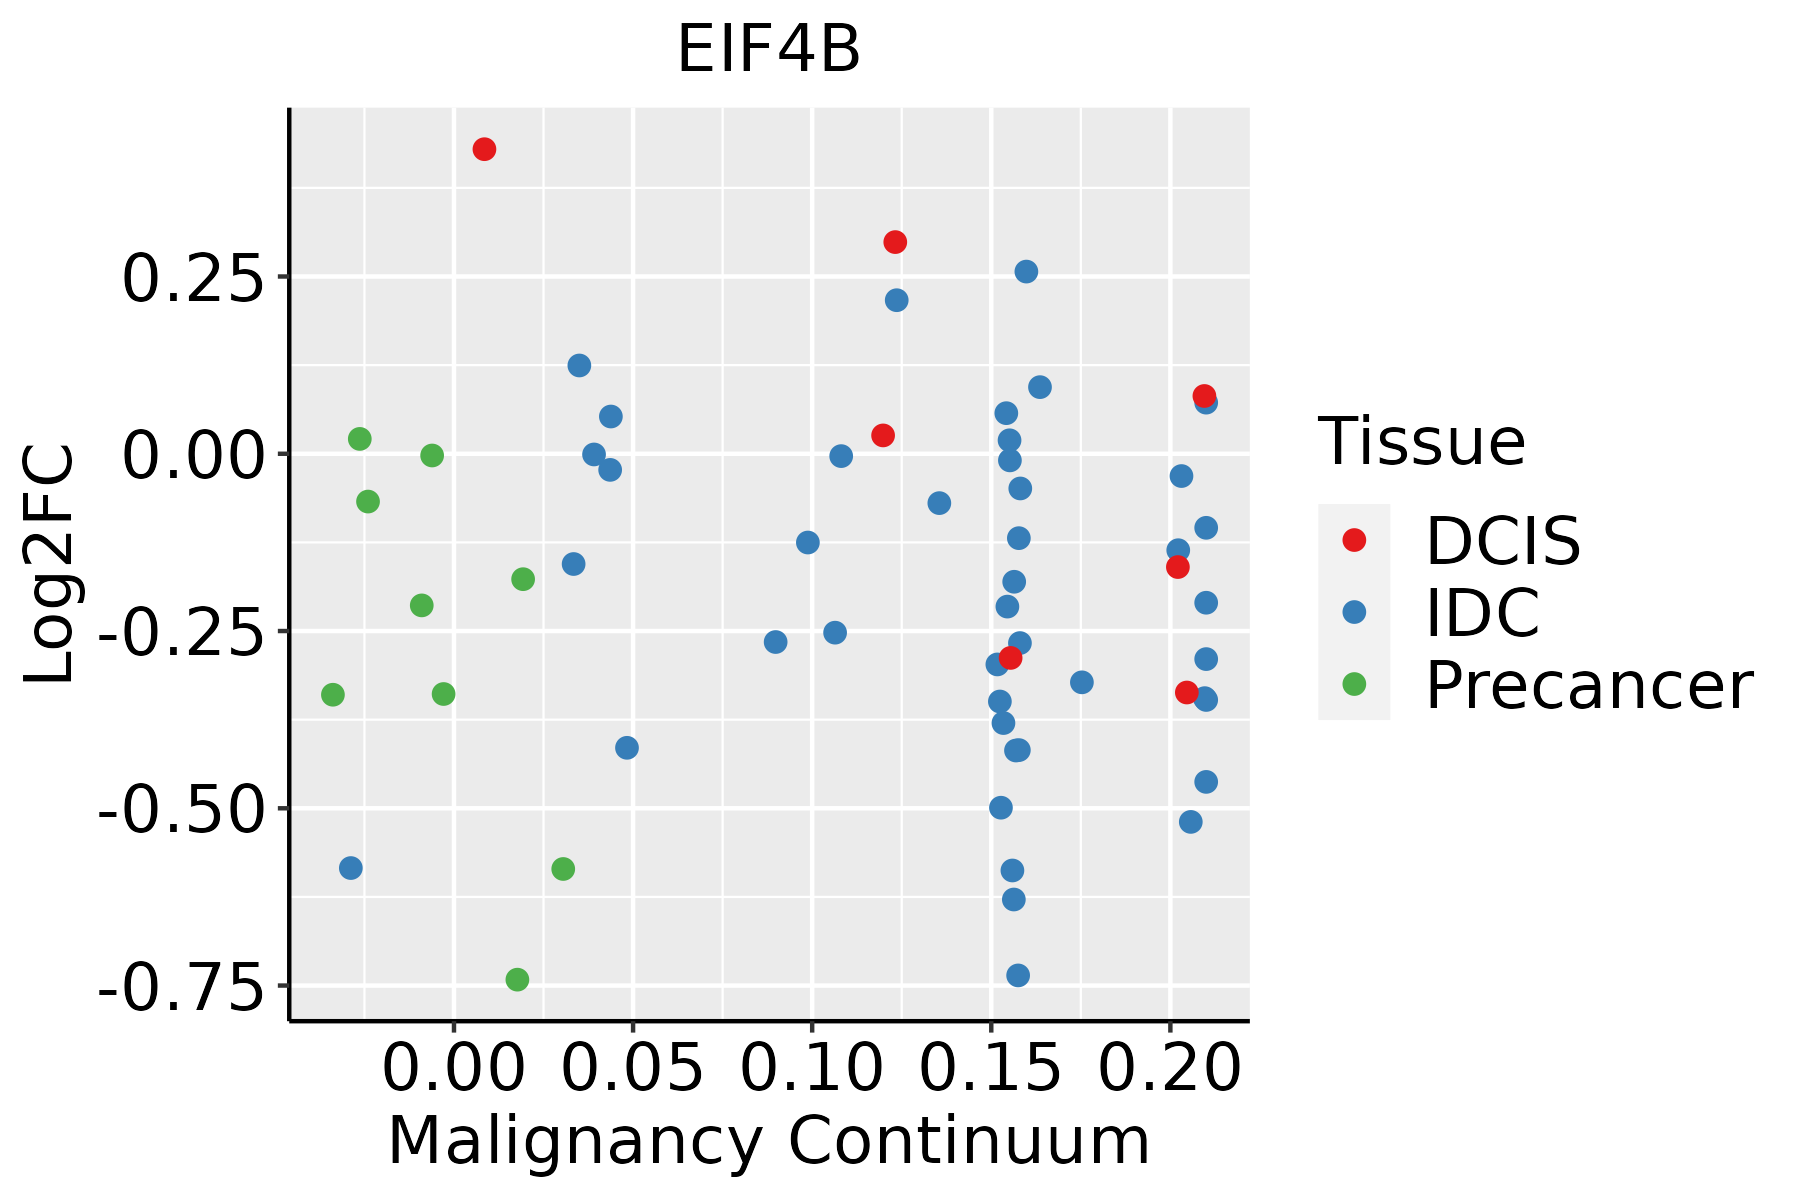 | IDC: Invasive ductal carcinoma |
| DCIS: Ductal carcinoma in situ | ||
| Precancer(BRCA1-mut): Precancerous lesion from BRCA1 mutation carriers | ||
| Cervix | 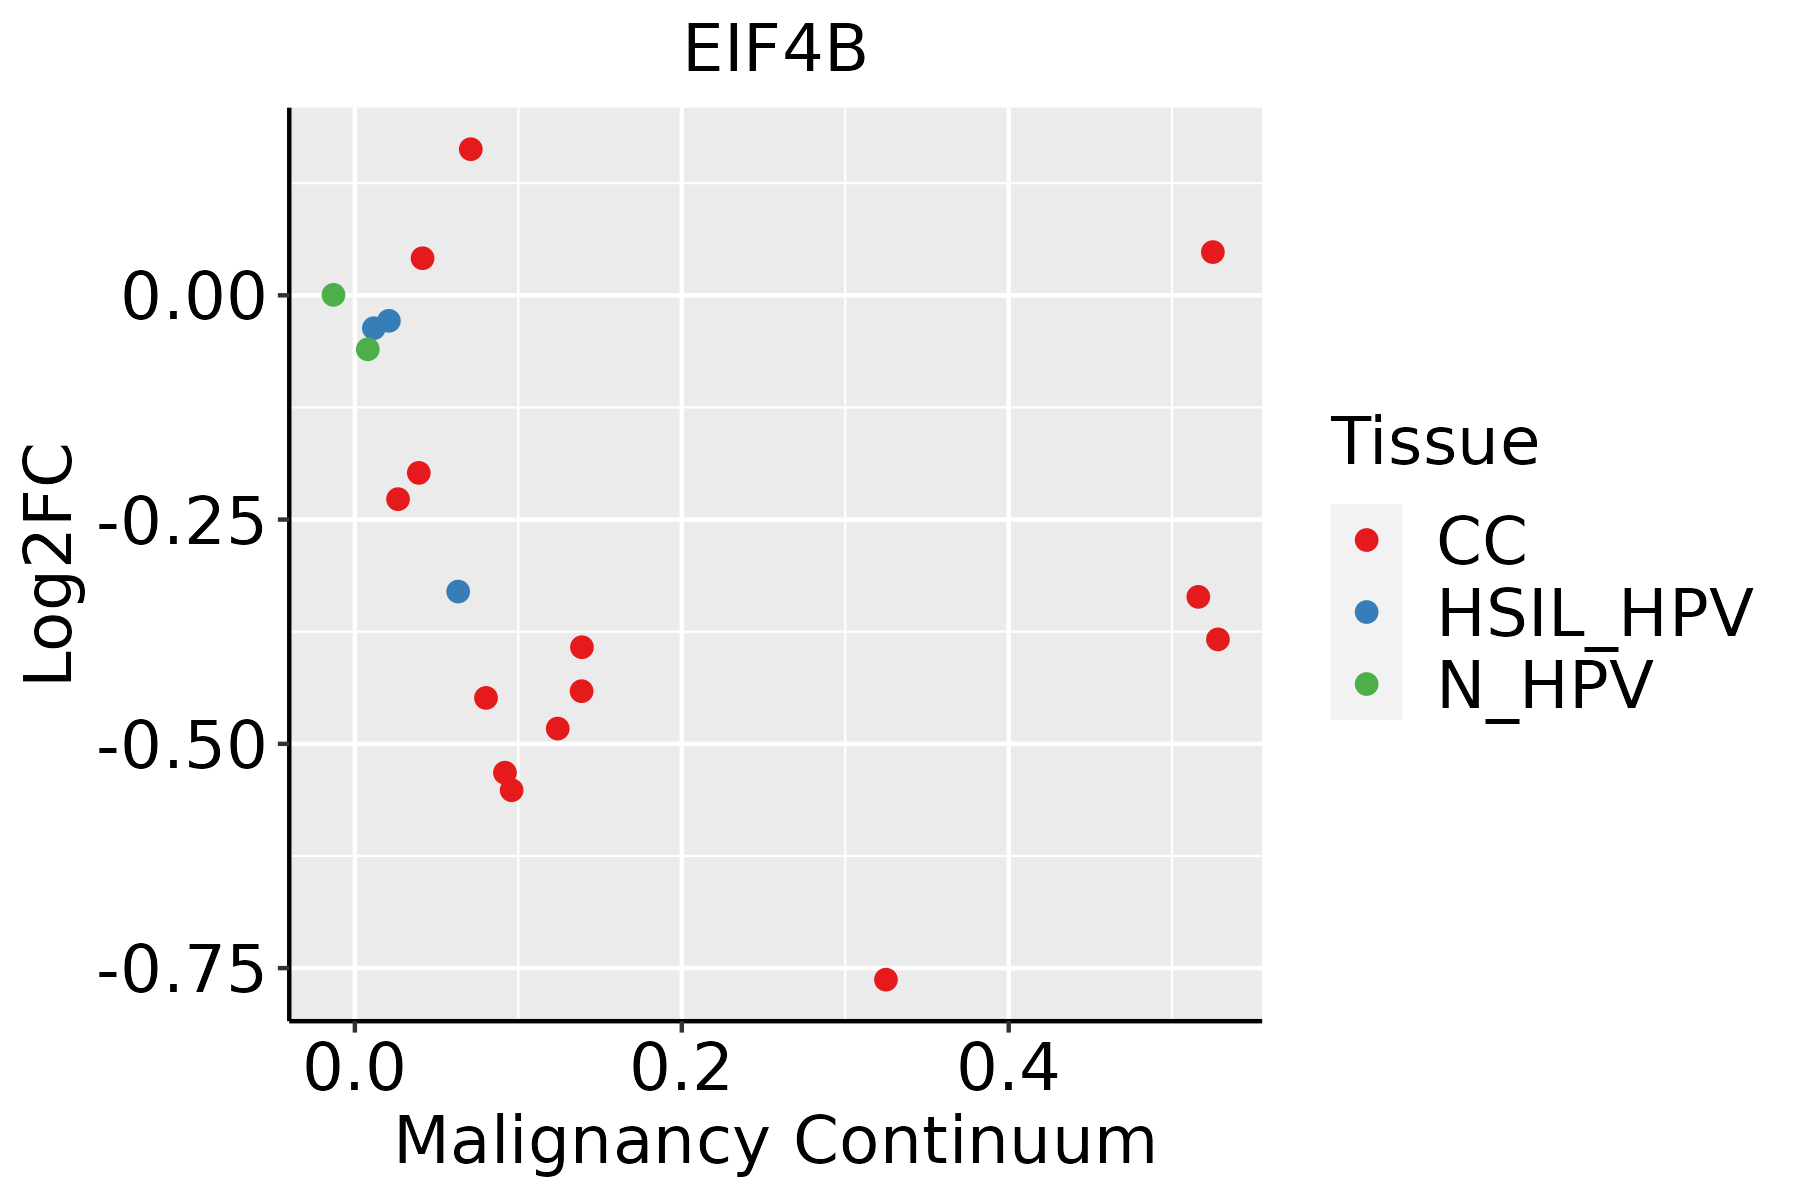 | CC: Cervix cancer |
| HSIL_HPV: HPV-infected high-grade squamous intraepithelial lesions | ||
| N_HPV: HPV-infected normal cervix | ||
| Colorectum (GSE201348) |  | FAP: Familial adenomatous polyposis |
| CRC: Colorectal cancer | ||
| Colorectum (HTA11) |  | AD: Adenomas |
| SER: Sessile serrated lesions | ||
| MSI-H: Microsatellite-high colorectal cancer | ||
| MSS: Microsatellite stable colorectal cancer | ||
| Endometrium | 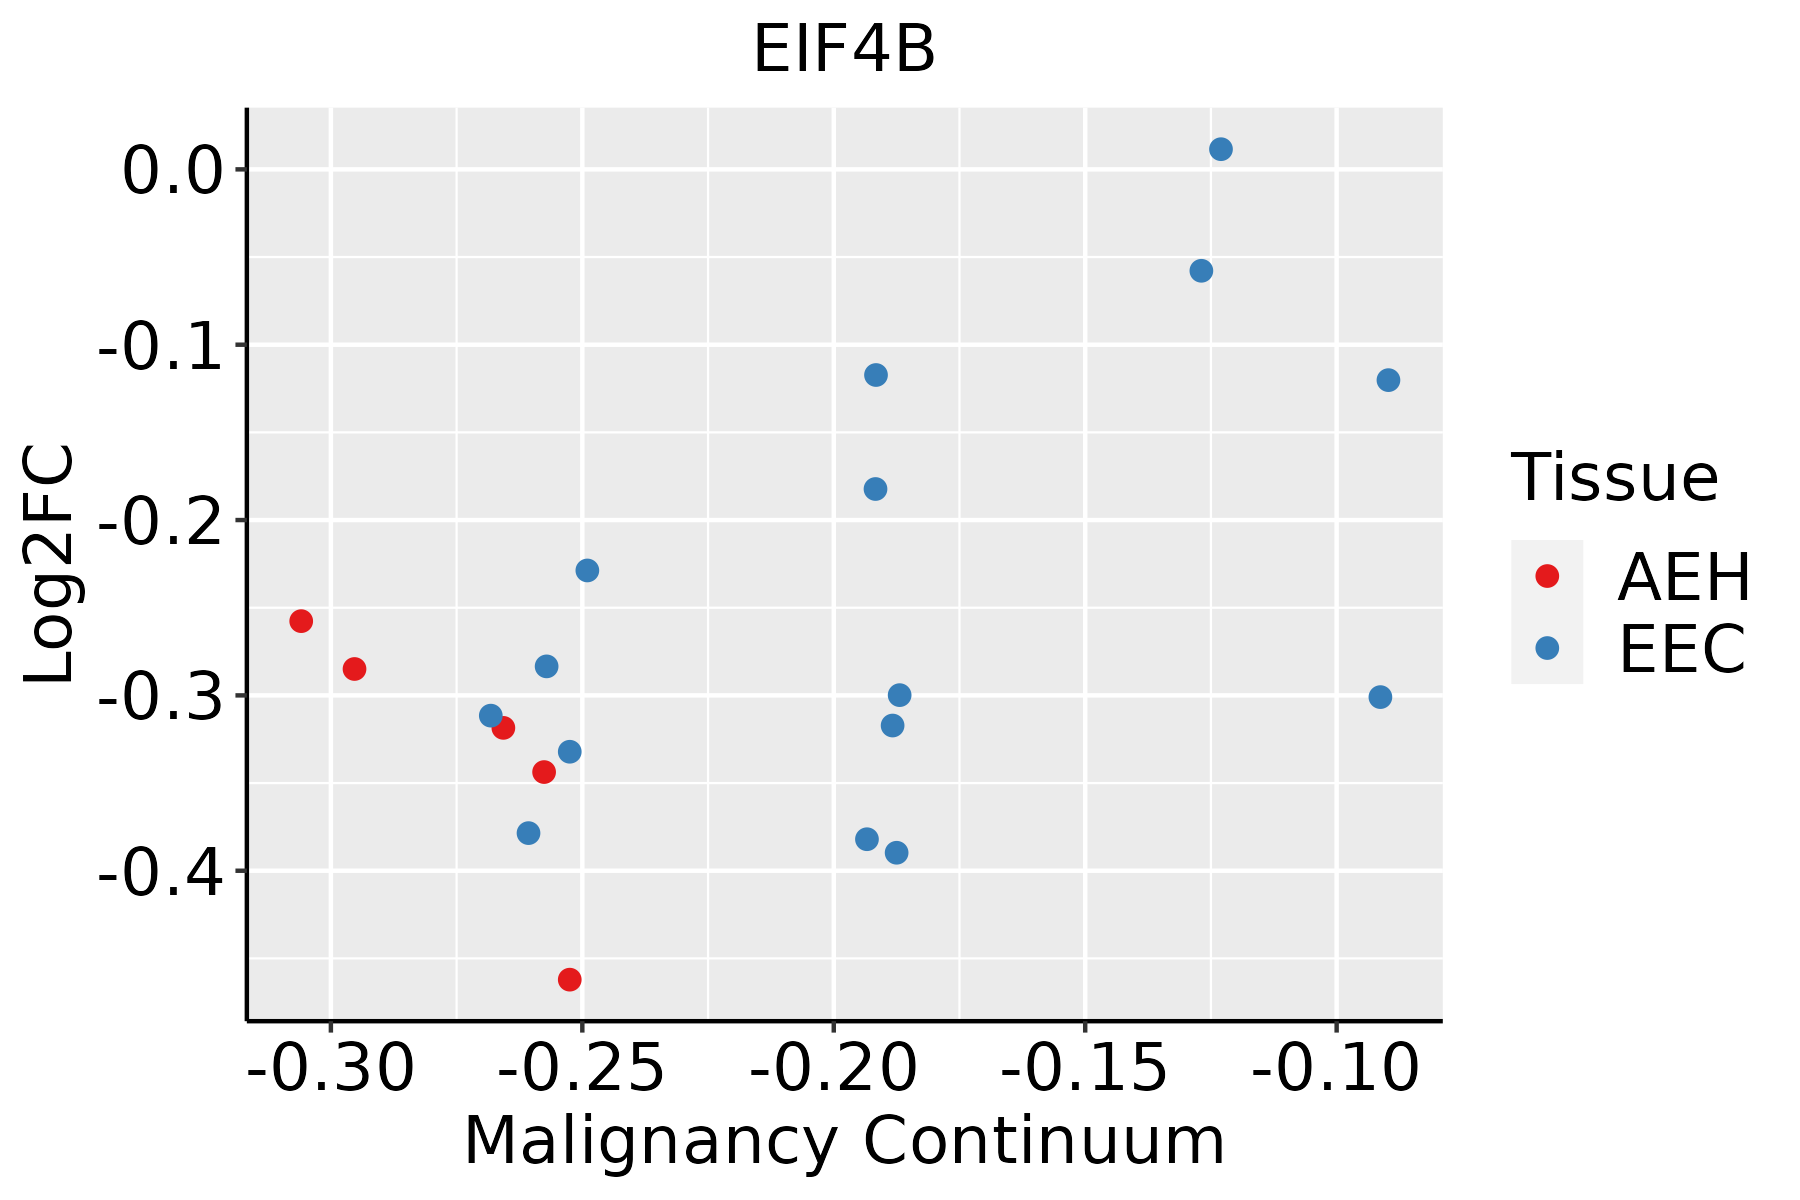 | AEH: Atypical endometrial hyperplasia |
| EEC: Endometrioid Cancer | ||
| Esophagus |  | ESCC: Esophageal squamous cell carcinoma |
| HGIN: High-grade intraepithelial neoplasias | ||
| LGIN: Low-grade intraepithelial neoplasias | ||
| Liver | 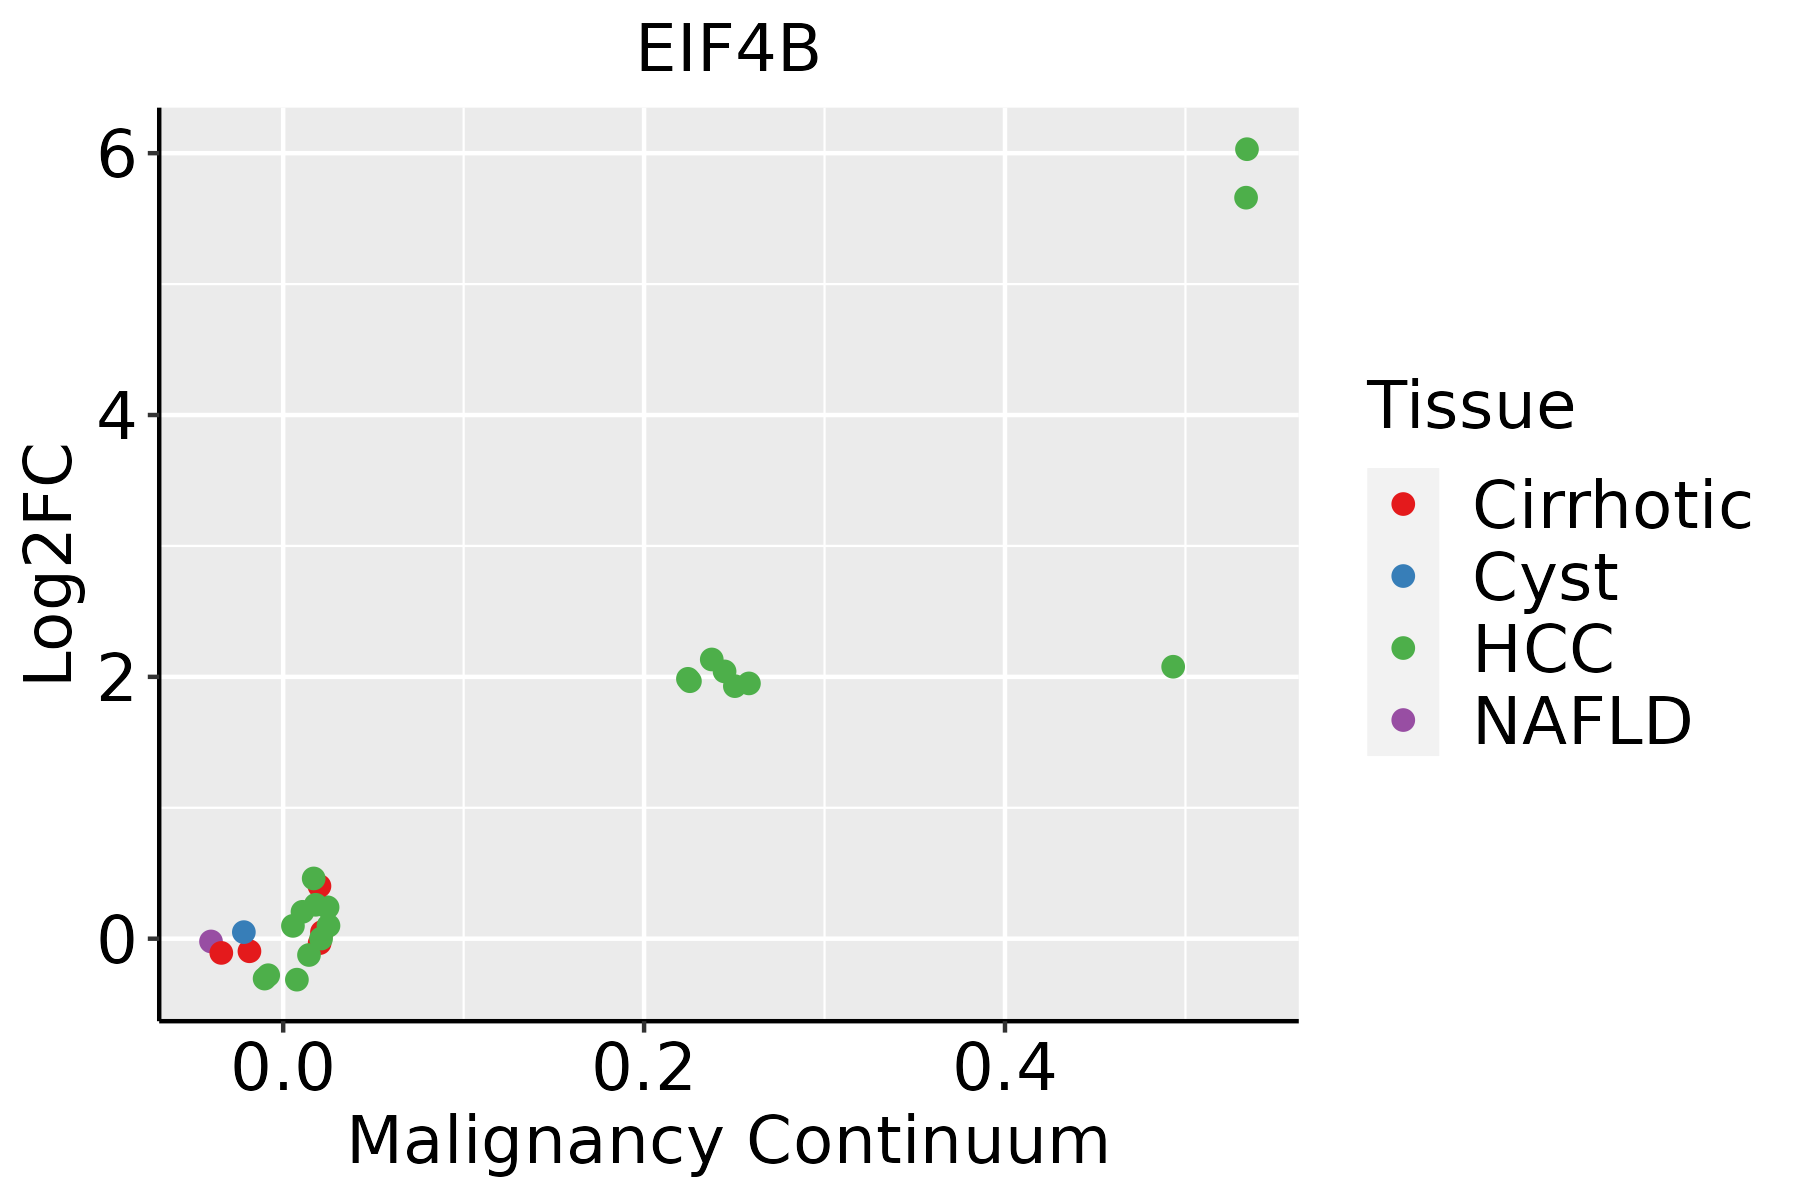 | HCC: Hepatocellular carcinoma |
| NAFLD: Non-alcoholic fatty liver disease | ||
| Oral Cavity | 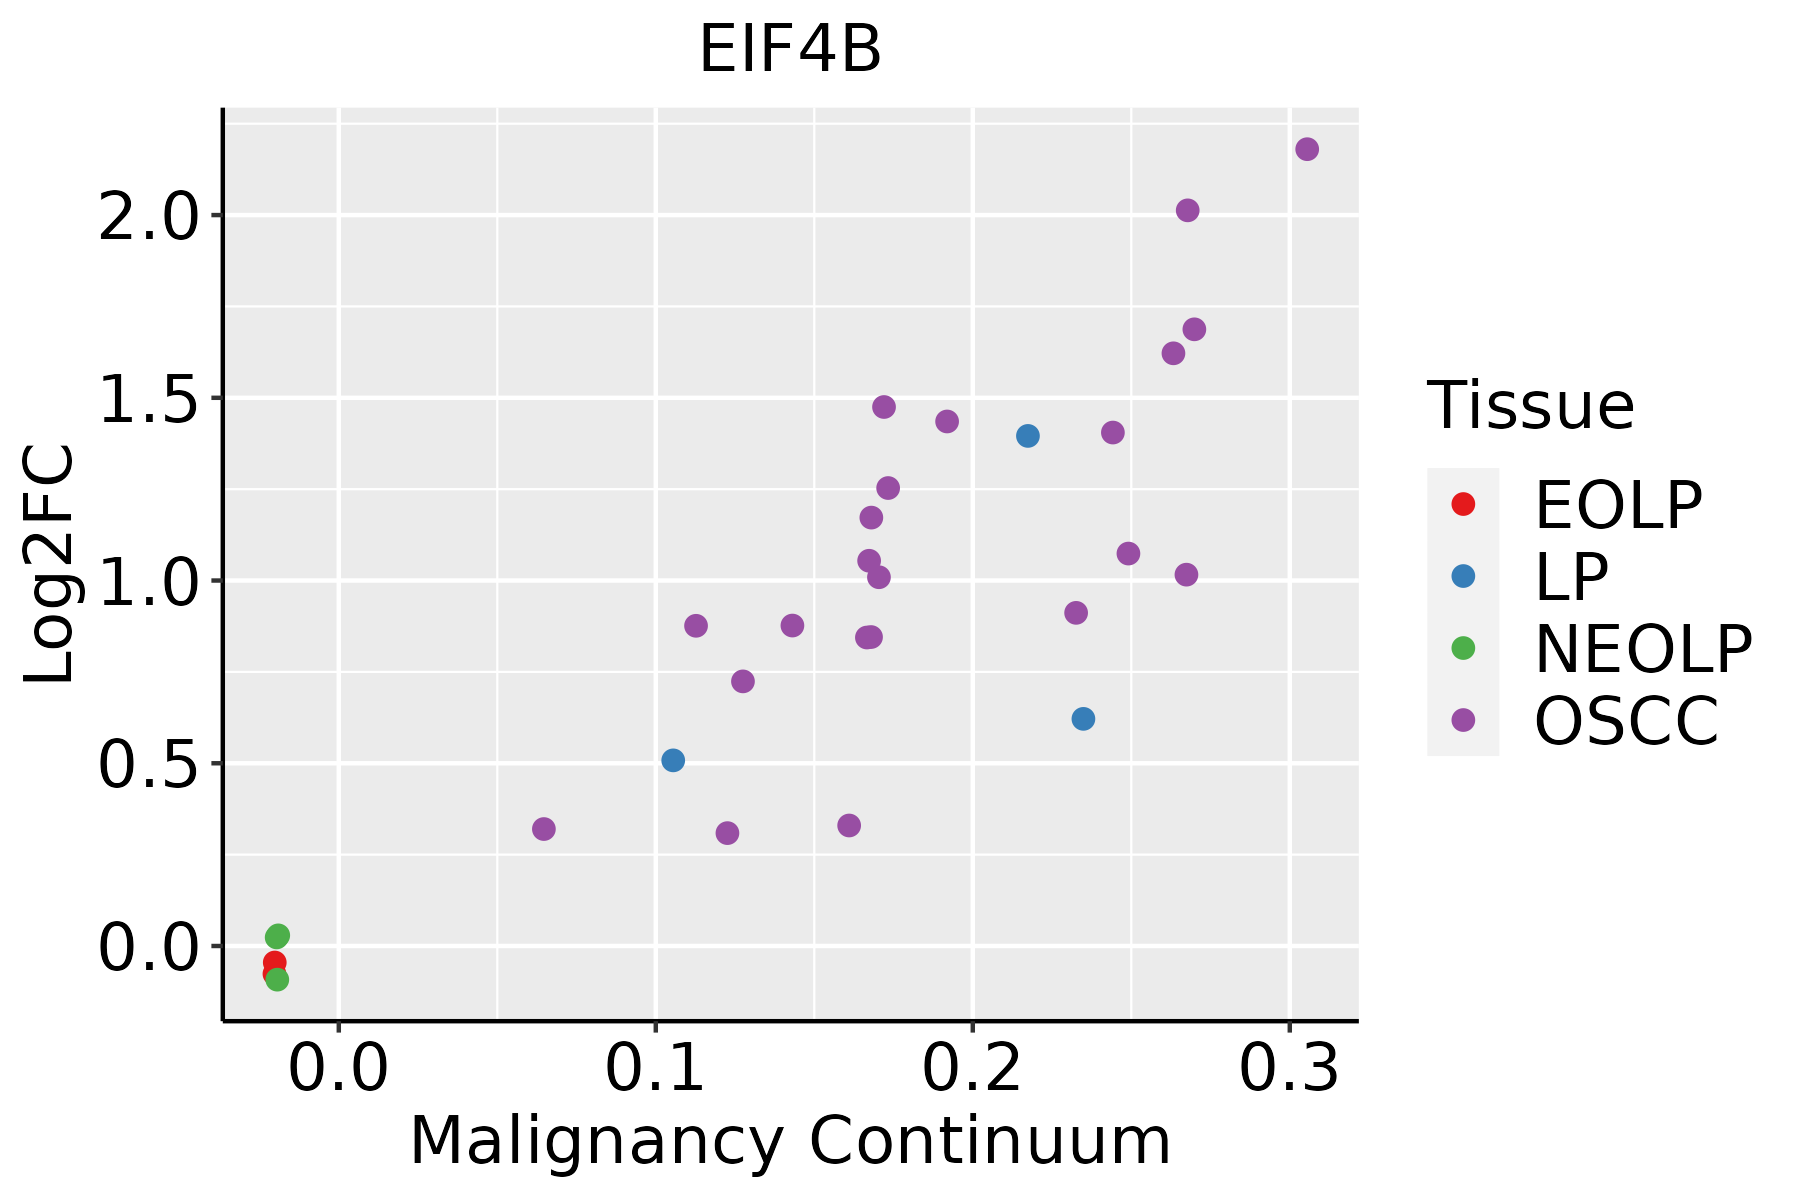 | EOLP: Erosive Oral lichen planus |
| LP: leukoplakia | ||
| NEOLP: Non-erosive oral lichen planus | ||
| OSCC: Oral squamous cell carcinoma | ||
| Prostate | 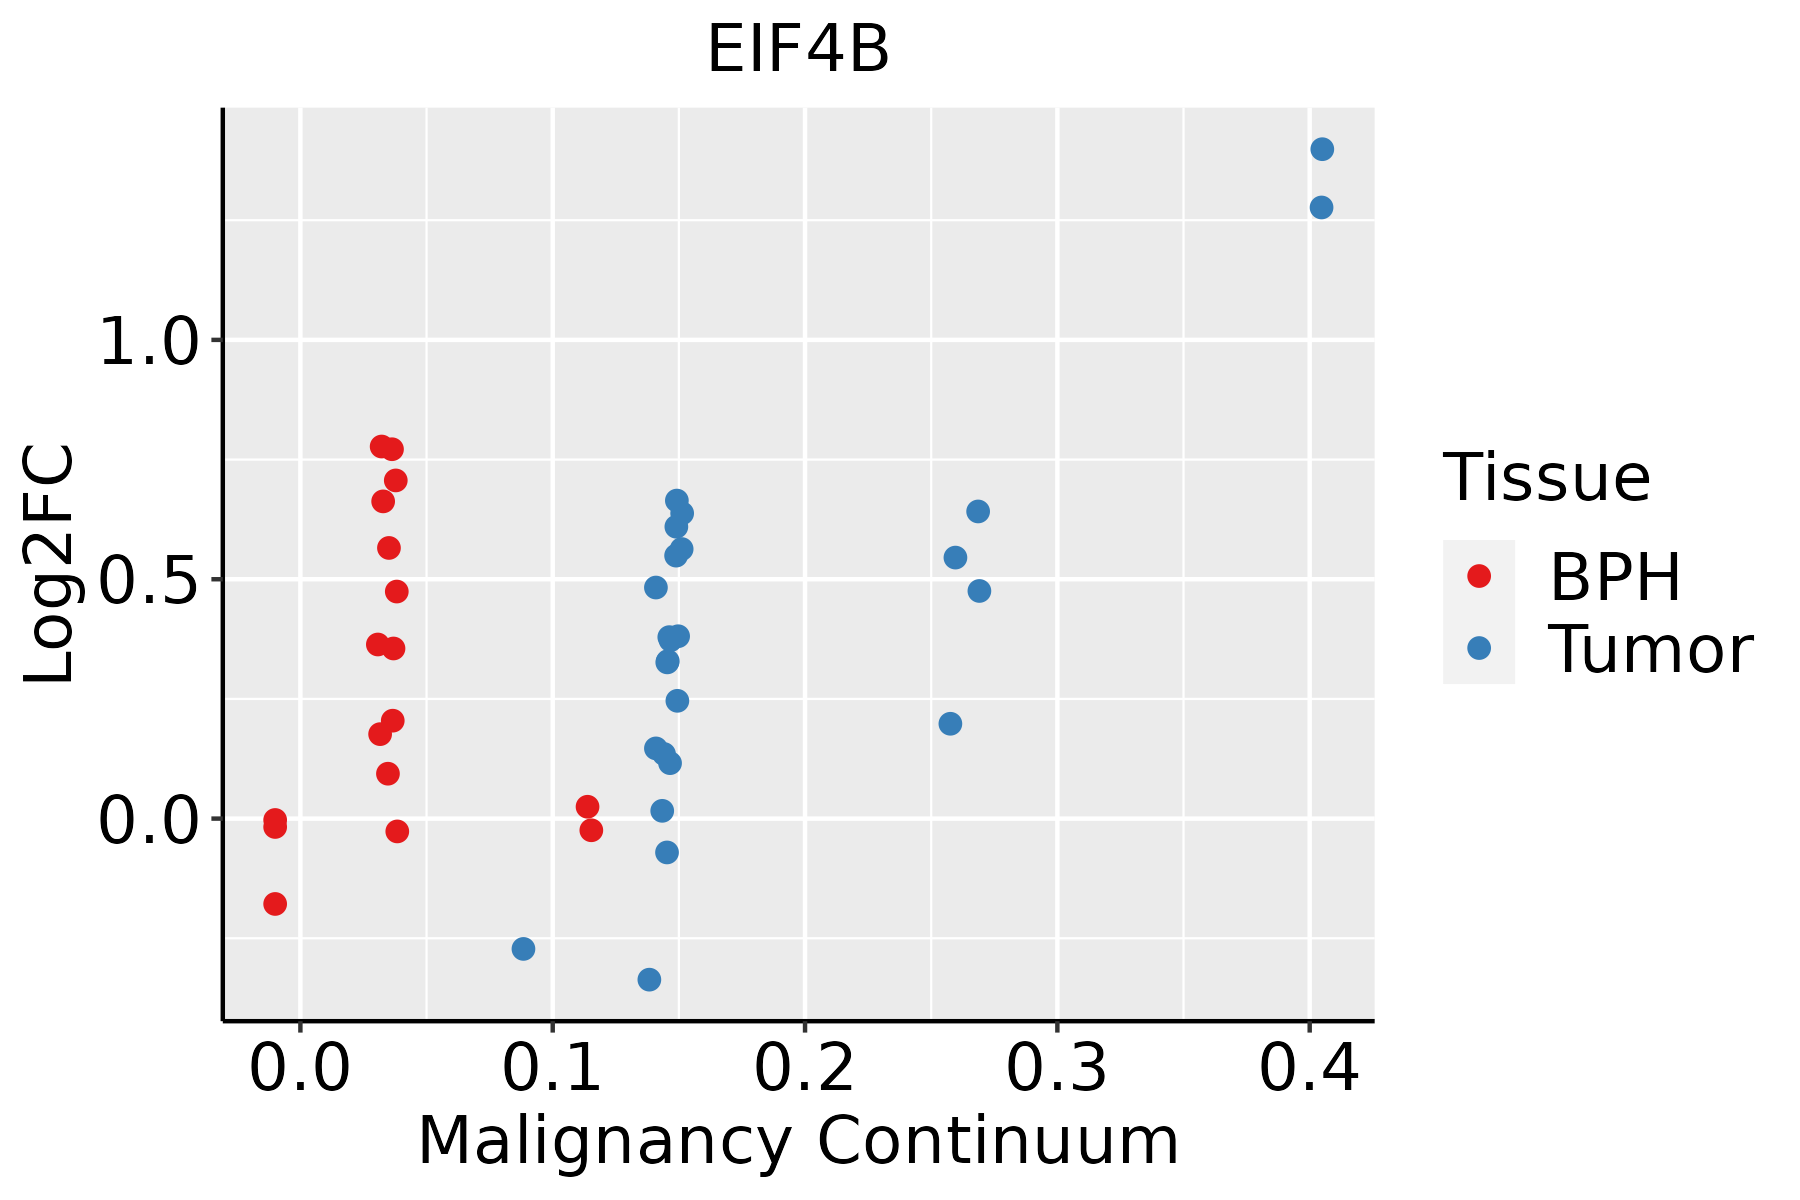 | BPH: Benign Prostatic Hyperplasia |
| Skin | 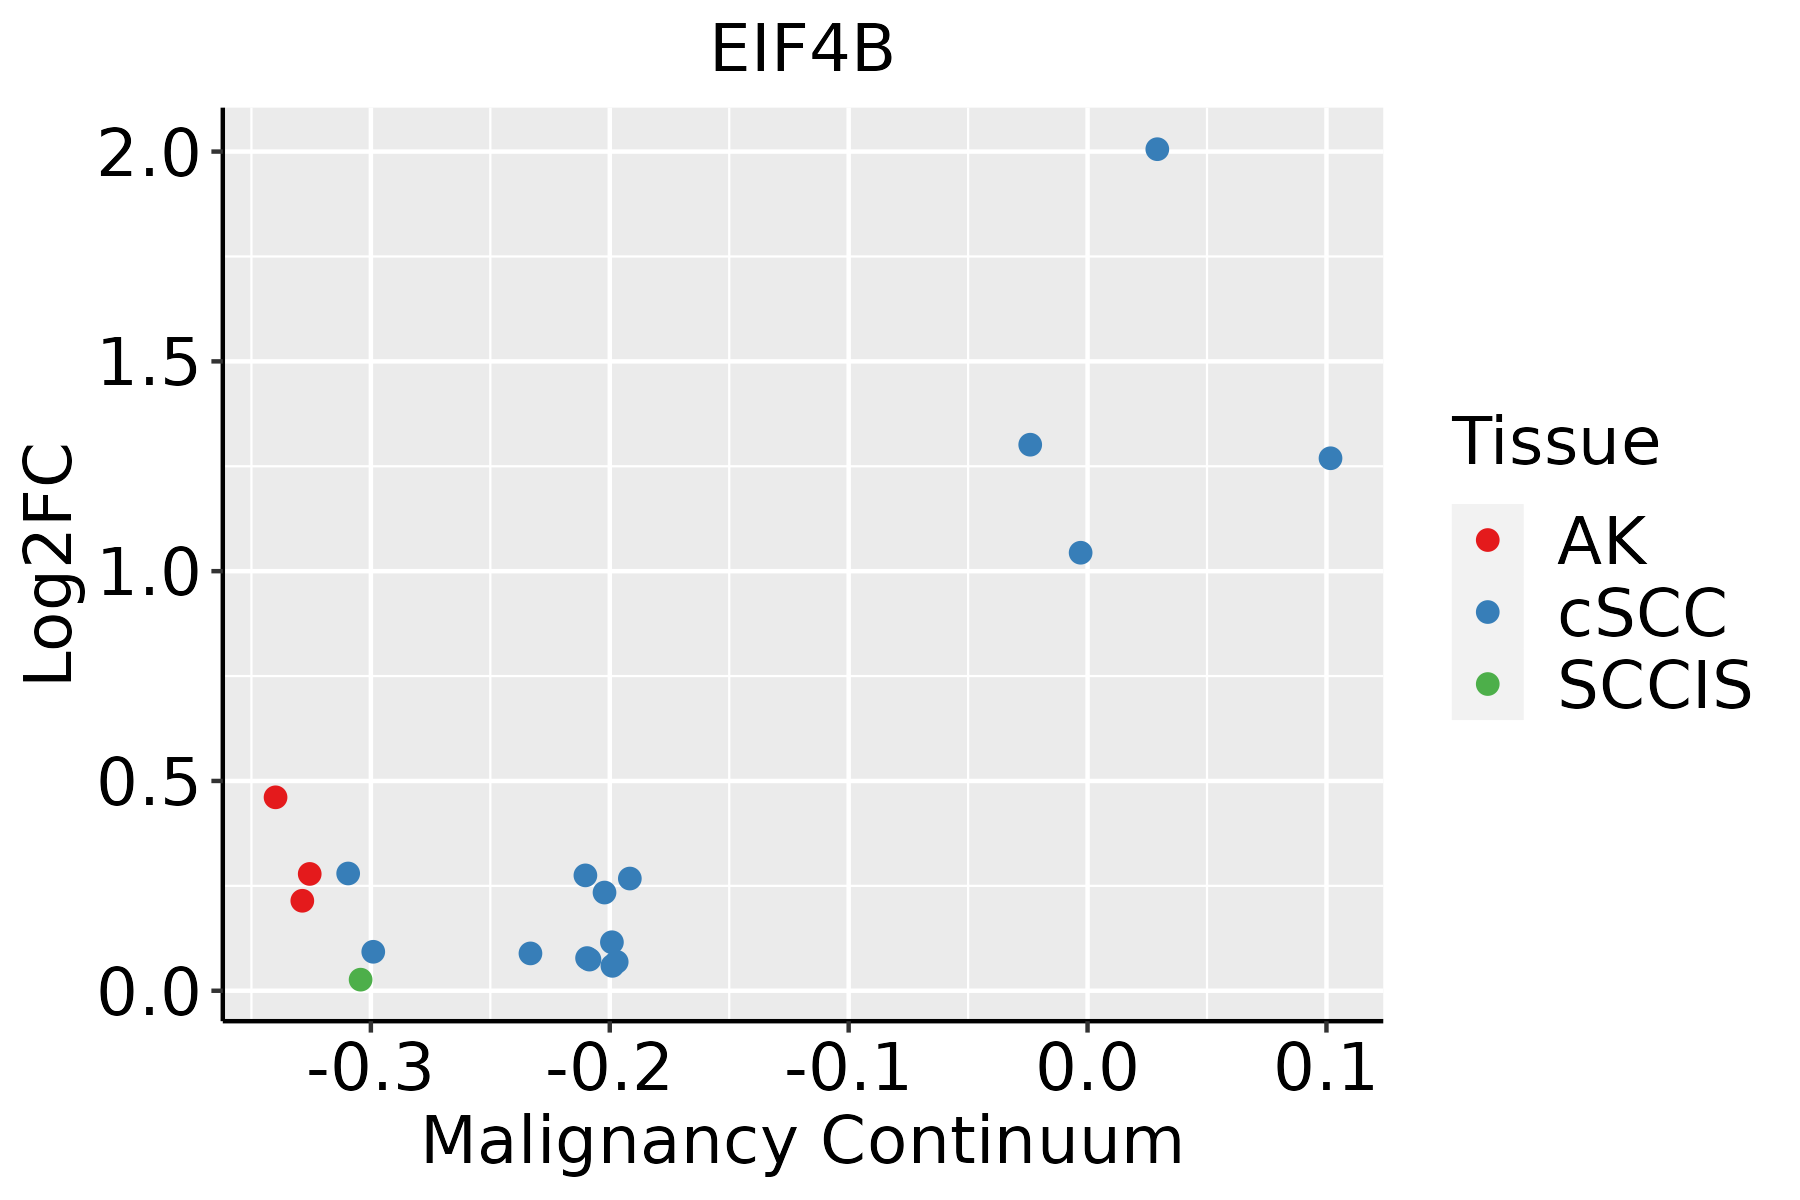 | AK: Actinic keratosis |
| cSCC: Cutaneous squamous cell carcinoma | ||
| SCCIS:squamous cell carcinoma in situ | ||
| Thyroid |  | ATC: Anaplastic thyroid cancer |
| HT: Hashimoto's thyroiditis | ||
| PTC: Papillary thyroid cancer |
| ∗log2FC in expression of this searched gene in stem-like cells from each diseased tissue sample relative to stem-like cells in normal samples in each tissue plotted against the malignancy continuum. Samples are colored based on if they are from different disease stage. |
Top |
Malignant transformation related pathway analysis |
| Find out the enriched GO biological processes and KEGG pathways involved in transition from healthy to precancer to cancer |
| Tissue | Disease Stage | Enriched GO biological Processes |
| Colorectum | AD |  |
| Colorectum | SER |  |
| Colorectum | MSS |  |
| Colorectum | MSI-H |  |
| Colorectum | FAP |  |
| ∗Top 15 enriched GO BP terms are showed in the bar plot of each disease state in each tissue. Each row represents a significant GO biological process which is colored according to the -log10(p.adjust). |
| Page: 1 2 3 4 5 6 7 8 9 |
| GO ID | Tissue | Disease Stage | Description | Gene Ratio | Bg Ratio | pvalue | p.adjust | Count |
| GO:00021819 | Breast | Precancer | cytoplasmic translation | 80/1080 | 148/18723 | 1.59e-59 | 8.54e-56 | 80 |
| GO:00226139 | Breast | Precancer | ribonucleoprotein complex biogenesis | 79/1080 | 463/18723 | 2.11e-18 | 1.03e-15 | 79 |
| GO:00718269 | Breast | Precancer | ribonucleoprotein complex subunit organization | 48/1080 | 227/18723 | 2.68e-15 | 8.45e-13 | 48 |
| GO:00226189 | Breast | Precancer | ribonucleoprotein complex assembly | 47/1080 | 220/18723 | 3.47e-15 | 1.03e-12 | 47 |
| GO:00064138 | Breast | Precancer | translational initiation | 30/1080 | 118/18723 | 3.23e-12 | 5.58e-10 | 30 |
| GO:00064179 | Breast | Precancer | regulation of translation | 67/1080 | 468/18723 | 4.71e-12 | 7.64e-10 | 67 |
| GO:00064466 | Breast | Precancer | regulation of translational initiation | 19/1080 | 79/18723 | 7.99e-08 | 4.60e-06 | 19 |
| GO:00021838 | Breast | Precancer | cytoplasmic translational initiation | 11/1080 | 34/18723 | 1.87e-06 | 6.63e-05 | 11 |
| GO:000218114 | Breast | IDC | cytoplasmic translation | 82/1434 | 148/18723 | 2.60e-52 | 1.48e-48 | 82 |
| GO:002261314 | Breast | IDC | ribonucleoprotein complex biogenesis | 83/1434 | 463/18723 | 2.01e-13 | 5.20e-11 | 83 |
| GO:007182614 | Breast | IDC | ribonucleoprotein complex subunit organization | 52/1434 | 227/18723 | 5.18e-13 | 1.21e-10 | 52 |
| GO:002261814 | Breast | IDC | ribonucleoprotein complex assembly | 51/1434 | 220/18723 | 5.32e-13 | 1.21e-10 | 51 |
| GO:000641313 | Breast | IDC | translational initiation | 31/1434 | 118/18723 | 7.29e-10 | 7.52e-08 | 31 |
| GO:000641714 | Breast | IDC | regulation of translation | 74/1434 | 468/18723 | 1.67e-09 | 1.53e-07 | 74 |
| GO:000644613 | Breast | IDC | regulation of translational initiation | 20/1434 | 79/18723 | 1.40e-06 | 6.00e-05 | 20 |
| GO:000218313 | Breast | IDC | cytoplasmic translational initiation | 12/1434 | 34/18723 | 4.35e-06 | 1.53e-04 | 12 |
| GO:000218124 | Breast | DCIS | cytoplasmic translation | 82/1390 | 148/18723 | 2.21e-53 | 1.25e-49 | 82 |
| GO:002261324 | Breast | DCIS | ribonucleoprotein complex biogenesis | 83/1390 | 463/18723 | 3.65e-14 | 1.09e-11 | 83 |
| GO:007182624 | Breast | DCIS | ribonucleoprotein complex subunit organization | 52/1390 | 227/18723 | 1.54e-13 | 3.95e-11 | 52 |
| GO:002261824 | Breast | DCIS | ribonucleoprotein complex assembly | 51/1390 | 220/18723 | 1.60e-13 | 3.95e-11 | 51 |
| Page: 1 2 3 4 5 6 7 8 9 10 11 12 |
| Pathway ID | Tissue | Disease Stage | Description | Gene Ratio | Bg Ratio | pvalue | p.adjust | qvalue | Count |
| hsa0520514 | Breast | Precancer | Proteoglycans in cancer | 30/684 | 205/8465 | 1.00e-03 | 7.18e-03 | 5.50e-03 | 30 |
| hsa0520515 | Breast | Precancer | Proteoglycans in cancer | 30/684 | 205/8465 | 1.00e-03 | 7.18e-03 | 5.50e-03 | 30 |
| hsa0520523 | Breast | IDC | Proteoglycans in cancer | 42/867 | 205/8465 | 7.69e-06 | 9.99e-05 | 7.48e-05 | 42 |
| hsa0520533 | Breast | IDC | Proteoglycans in cancer | 42/867 | 205/8465 | 7.69e-06 | 9.99e-05 | 7.48e-05 | 42 |
| hsa0520516 | Cervix | CC | Proteoglycans in cancer | 60/1267 | 205/8465 | 9.13e-08 | 1.18e-06 | 7.00e-07 | 60 |
| hsa0520517 | Cervix | CC | Proteoglycans in cancer | 60/1267 | 205/8465 | 9.13e-08 | 1.18e-06 | 7.00e-07 | 60 |
| hsa05205 | Colorectum | AD | Proteoglycans in cancer | 70/2092 | 205/8465 | 1.37e-03 | 8.46e-03 | 5.39e-03 | 70 |
| hsa052051 | Colorectum | AD | Proteoglycans in cancer | 70/2092 | 205/8465 | 1.37e-03 | 8.46e-03 | 5.39e-03 | 70 |
| hsa052054 | Colorectum | MSS | Proteoglycans in cancer | 65/1875 | 205/8465 | 8.66e-04 | 5.38e-03 | 3.29e-03 | 65 |
| hsa04150 | Colorectum | MSS | mTOR signaling pathway | 47/1875 | 156/8465 | 1.19e-02 | 3.99e-02 | 2.44e-02 | 47 |
| hsa052055 | Colorectum | MSS | Proteoglycans in cancer | 65/1875 | 205/8465 | 8.66e-04 | 5.38e-03 | 3.29e-03 | 65 |
| hsa041501 | Colorectum | MSS | mTOR signaling pathway | 47/1875 | 156/8465 | 1.19e-02 | 3.99e-02 | 2.44e-02 | 47 |
| hsa052056 | Colorectum | FAP | Proteoglycans in cancer | 57/1404 | 205/8465 | 3.05e-05 | 3.29e-04 | 2.00e-04 | 57 |
| hsa04151 | Colorectum | FAP | PI3K-Akt signaling pathway | 75/1404 | 354/8465 | 1.23e-02 | 4.19e-02 | 2.55e-02 | 75 |
| hsa052057 | Colorectum | FAP | Proteoglycans in cancer | 57/1404 | 205/8465 | 3.05e-05 | 3.29e-04 | 2.00e-04 | 57 |
| hsa041511 | Colorectum | FAP | PI3K-Akt signaling pathway | 75/1404 | 354/8465 | 1.23e-02 | 4.19e-02 | 2.55e-02 | 75 |
| hsa052058 | Colorectum | CRC | Proteoglycans in cancer | 47/1091 | 205/8465 | 4.43e-05 | 8.70e-04 | 5.90e-04 | 47 |
| hsa041512 | Colorectum | CRC | PI3K-Akt signaling pathway | 64/1091 | 354/8465 | 2.70e-03 | 1.77e-02 | 1.20e-02 | 64 |
| hsa052059 | Colorectum | CRC | Proteoglycans in cancer | 47/1091 | 205/8465 | 4.43e-05 | 8.70e-04 | 5.90e-04 | 47 |
| hsa041513 | Colorectum | CRC | PI3K-Akt signaling pathway | 64/1091 | 354/8465 | 2.70e-03 | 1.77e-02 | 1.20e-02 | 64 |
| Page: 1 2 3 |
Top |
Cell-cell communication analysis |
| Identification of potential cell-cell interactions between two cell types and their ligand-receptor pairs for different disease states |
| Ligand | Receptor | LRpair | Pathway | Tissue | Disease Stage |
| Page: 1 |
Top |
Single-cell gene regulatory network inference analysis |
| Find out the significant the regulons (TFs) and the target genes of each regulon across cell types for different disease states |
| TF | Cell Type | Tissue | Disease Stage | Target Gene | RSS | Regulon Activity |
| ∗The dot plots of a searched regulon are shown for all cell subpopulations in each disease state of each tissue based on the regulon specific score inferred using pySCENIC and by calculating the average expression. |
| Page: 1 |
Top |
Somatic mutation of malignant transformation related genes |
| Annotation of somatic variants for genes involved in malignant transformation |
| Hugo Symbol | Variant Class | Variant Classification | dbSNP RS | HGVSc | HGVSp | HGVSp Short | SWISSPROT | BIOTYPE | SIFT | PolyPhen | Tumor Sample Barcode | Tissue | Histology | Sex | Age | Stage | Therapy Types | Drugs | Outcome |
| EIF4B | SNV | Missense_Mutation | c.400N>A | p.Glu134Lys | p.E134K | protein_coding | tolerated(0.12) | benign(0.042) | TCGA-A2-A0YK-01 | Breast | breast invasive carcinoma | Female | <65 | I/II | Chemotherapy | cytoxan | SD | ||
| EIF4B | SNV | Missense_Mutation | c.400N>C | p.Glu134Gln | p.E134Q | protein_coding | deleterious(0.04) | benign(0.007) | TCGA-A8-A06Q-01 | Breast | breast invasive carcinoma | Female | <65 | III/IV | Unknown | Unknown | SD | ||
| EIF4B | SNV | Missense_Mutation | novel | c.811N>A | p.Asp271Asn | p.D271N | protein_coding | tolerated(0.11) | possibly_damaging(0.746) | TCGA-GM-A2D9-01 | Breast | breast invasive carcinoma | Female | >=65 | I/II | Hormone Therapy | arimidex | SD | |
| EIF4B | SNV | Missense_Mutation | novel | c.259N>T | p.Arg87Trp | p.R87W | protein_coding | tolerated(0.06) | possibly_damaging(0.853) | TCGA-2W-A8YY-01 | Cervix | cervical & endocervical cancer | Female | <65 | I/II | Chemotherapy | cisplatin | CR | |
| EIF4B | SNV | Missense_Mutation | c.865G>A | p.Asp289Asn | p.D289N | protein_coding | tolerated(0.06) | possibly_damaging(0.554) | TCGA-C5-A1M9-01 | Cervix | cervical & endocervical cancer | Female | <65 | I/II | Chemotherapy | cisplatin | PD | ||
| EIF4B | SNV | Missense_Mutation | c.1400N>G | p.Ser467Cys | p.S467C | protein_coding | deleterious(0.02) | benign(0.03) | TCGA-Q1-A5R2-01 | Cervix | cervical & endocervical cancer | Female | <65 | I/II | Chemotherapy | cisplatin | PR | ||
| EIF4B | SNV | Missense_Mutation | rs753615463 | c.1223N>A | p.Arg408Gln | p.R408Q | protein_coding | tolerated(0.06) | benign(0.072) | TCGA-UC-A7PG-06 | Cervix | cervical & endocervical cancer | Female | <65 | III/IV | Chemotherapy | cisplatin | PD | |
| EIF4B | SNV | Missense_Mutation | novel | c.1036N>A | p.Asp346Asn | p.D346N | protein_coding | tolerated(0.24) | probably_damaging(0.989) | TCGA-VS-A8QF-01 | Cervix | cervical & endocervical cancer | Female | <65 | I/II | Chemotherapy | cisplatin | CR | |
| EIF4B | SNV | Missense_Mutation | novel | c.1516N>C | p.Glu506Gln | p.E506Q | protein_coding | tolerated_low_confidence(0.13) | benign(0.123) | TCGA-5M-AAT4-01 | Colorectum | colon adenocarcinoma | Male | >=65 | III/IV | Unknown | Unknown | PD | |
| EIF4B | SNV | Missense_Mutation | rs753615463 | c.1223N>A | p.Arg408Gln | p.R408Q | protein_coding | tolerated(0.06) | benign(0.072) | TCGA-A6-6780-01 | Colorectum | colon adenocarcinoma | Male | >=65 | I/II | Unknown | Unknown | SD |
| Page: 1 2 3 4 5 6 7 |
Top |
Related drugs of malignant transformation related genes |
| Identification of chemicals and drugs interact with genes involved in malignant transfromation |
| (DGIdb 4.0) |
| Entrez ID | Symbol | Category | Interaction Types | Drug Claim Name | Drug Name | PMIDs |
| Page: 1 |

Copyright 2023-Present -The University of Texas Health Science Center at Houston |