
|
|||||
|
 | |
| |
| |
| |
| |
| |
|
Gene: EIF4A1 |
Gene summary for EIF4A1 |
| Gene information | Species | Human | Gene symbol | EIF4A1 | Gene ID | 1973 |
| Gene name | eukaryotic translation initiation factor 4A1 | |
| Gene Alias | DDX2A | |
| Cytomap | 17p13.1 | |
| Gene Type | protein-coding | GO ID | GO:0002181 | UniProtAcc | P60842 |
Top |
Malignant transformation analysis |
| Identification of the aberrant gene expression in precancerous and cancerous lesions by comparing the gene expression of stem-like cells in diseased tissues with normal stem cells |
| Entrez ID | Symbol | Replicates | Species | Organ | Tissue | Adj P-value | Log2FC | Malignancy |
| 1973 | EIF4A1 | GSM4909277 | Human | Breast | Precancer | 3.76e-02 | 1.15e-01 | 0.0177 |
| 1973 | EIF4A1 | GSM4909280 | Human | Breast | Precancer | 1.23e-02 | -9.35e-03 | 0.0305 |
| 1973 | EIF4A1 | GSM4909281 | Human | Breast | IDC | 3.03e-04 | -1.97e-01 | 0.21 |
| 1973 | EIF4A1 | GSM4909285 | Human | Breast | IDC | 2.76e-06 | -1.75e-01 | 0.21 |
| 1973 | EIF4A1 | GSM4909286 | Human | Breast | IDC | 2.43e-19 | -3.82e-01 | 0.1081 |
| 1973 | EIF4A1 | GSM4909287 | Human | Breast | IDC | 1.62e-06 | -4.55e-01 | 0.2057 |
| 1973 | EIF4A1 | GSM4909290 | Human | Breast | IDC | 7.81e-06 | -4.96e-01 | 0.2096 |
| 1973 | EIF4A1 | GSM4909293 | Human | Breast | IDC | 1.14e-05 | -1.65e-01 | 0.1581 |
| 1973 | EIF4A1 | GSM4909294 | Human | Breast | IDC | 1.08e-04 | -2.71e-01 | 0.2022 |
| 1973 | EIF4A1 | GSM4909296 | Human | Breast | IDC | 9.57e-23 | -5.86e-01 | 0.1524 |
| 1973 | EIF4A1 | GSM4909297 | Human | Breast | IDC | 6.06e-17 | -1.11e-01 | 0.1517 |
| 1973 | EIF4A1 | GSM4909298 | Human | Breast | IDC | 3.77e-03 | -2.18e-01 | 0.1551 |
| 1973 | EIF4A1 | GSM4909301 | Human | Breast | IDC | 7.74e-07 | -3.48e-01 | 0.1577 |
| 1973 | EIF4A1 | GSM4909307 | Human | Breast | IDC | 2.93e-09 | -4.37e-01 | 0.1569 |
| 1973 | EIF4A1 | GSM4909311 | Human | Breast | IDC | 3.41e-40 | -5.54e-01 | 0.1534 |
| 1973 | EIF4A1 | GSM4909312 | Human | Breast | IDC | 2.89e-15 | -4.16e-01 | 0.1552 |
| 1973 | EIF4A1 | GSM4909315 | Human | Breast | IDC | 4.70e-16 | -4.82e-01 | 0.21 |
| 1973 | EIF4A1 | GSM4909316 | Human | Breast | IDC | 2.34e-05 | -5.60e-01 | 0.21 |
| 1973 | EIF4A1 | GSM4909317 | Human | Breast | IDC | 3.38e-02 | 2.17e-01 | 0.1355 |
| 1973 | EIF4A1 | GSM4909319 | Human | Breast | IDC | 9.23e-51 | -6.30e-01 | 0.1563 |
| Page: 1 2 3 4 5 6 7 8 9 10 11 12 13 14 15 16 |
| Tissue | Expression Dynamics | Abbreviation |
| Breast | 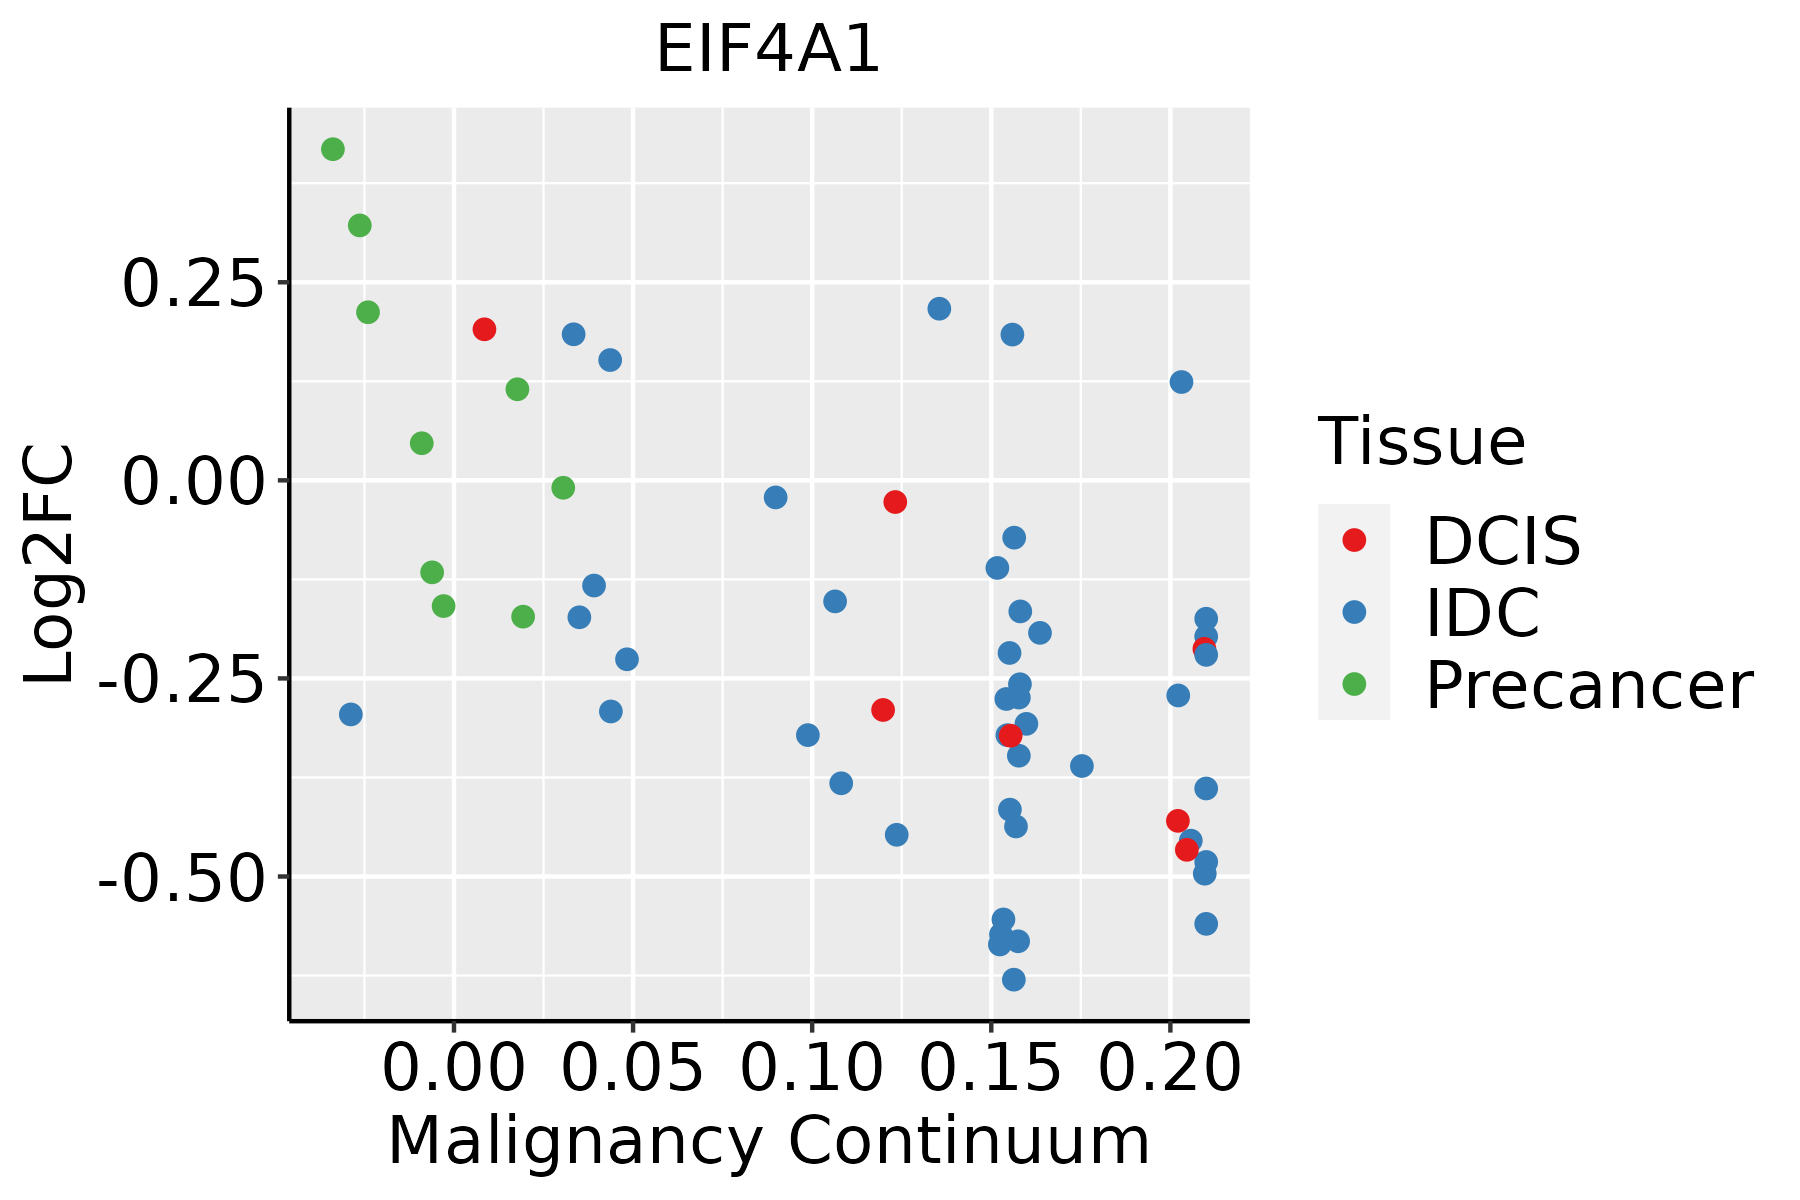 | IDC: Invasive ductal carcinoma |
| DCIS: Ductal carcinoma in situ | ||
| Precancer(BRCA1-mut): Precancerous lesion from BRCA1 mutation carriers | ||
| Cervix | 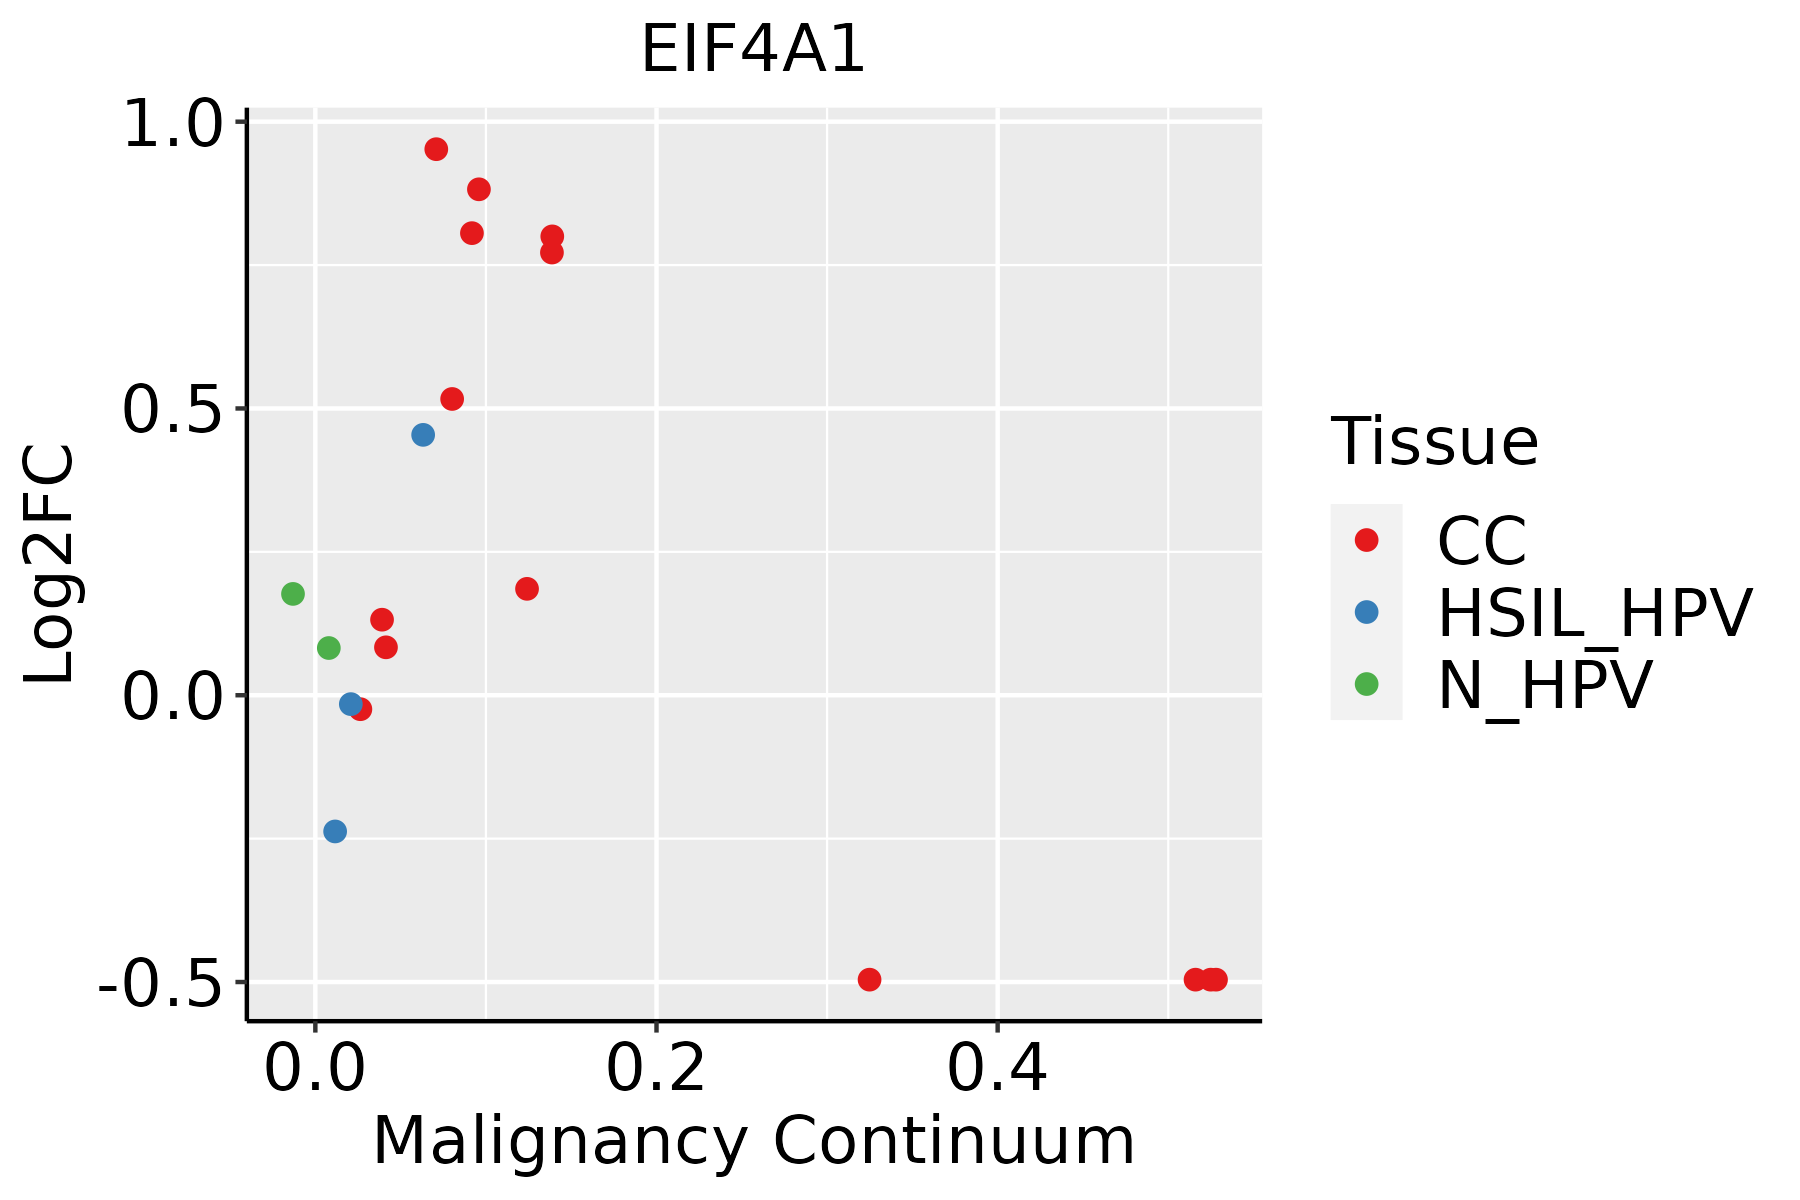 | CC: Cervix cancer |
| HSIL_HPV: HPV-infected high-grade squamous intraepithelial lesions | ||
| N_HPV: HPV-infected normal cervix | ||
| Endometrium | 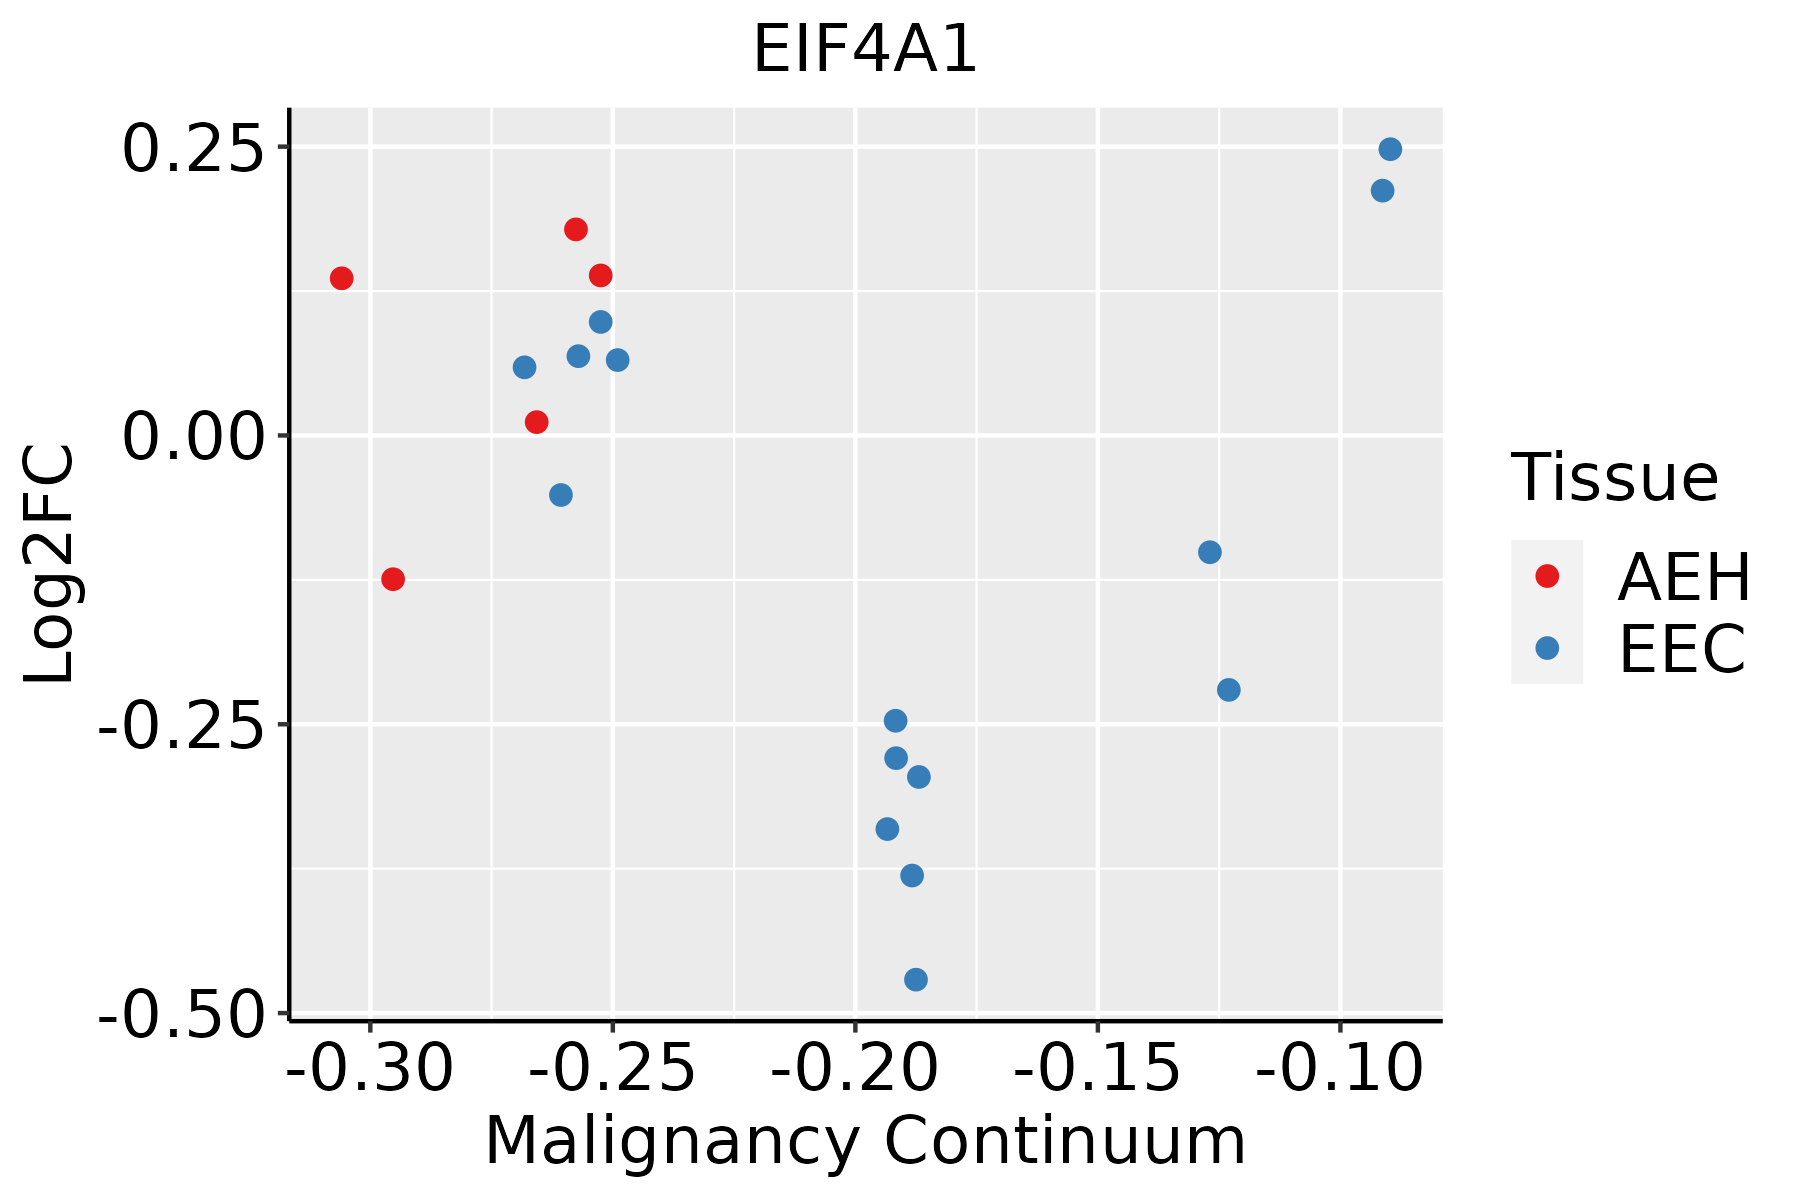 | AEH: Atypical endometrial hyperplasia |
| EEC: Endometrioid Cancer | ||
| Esophagus | 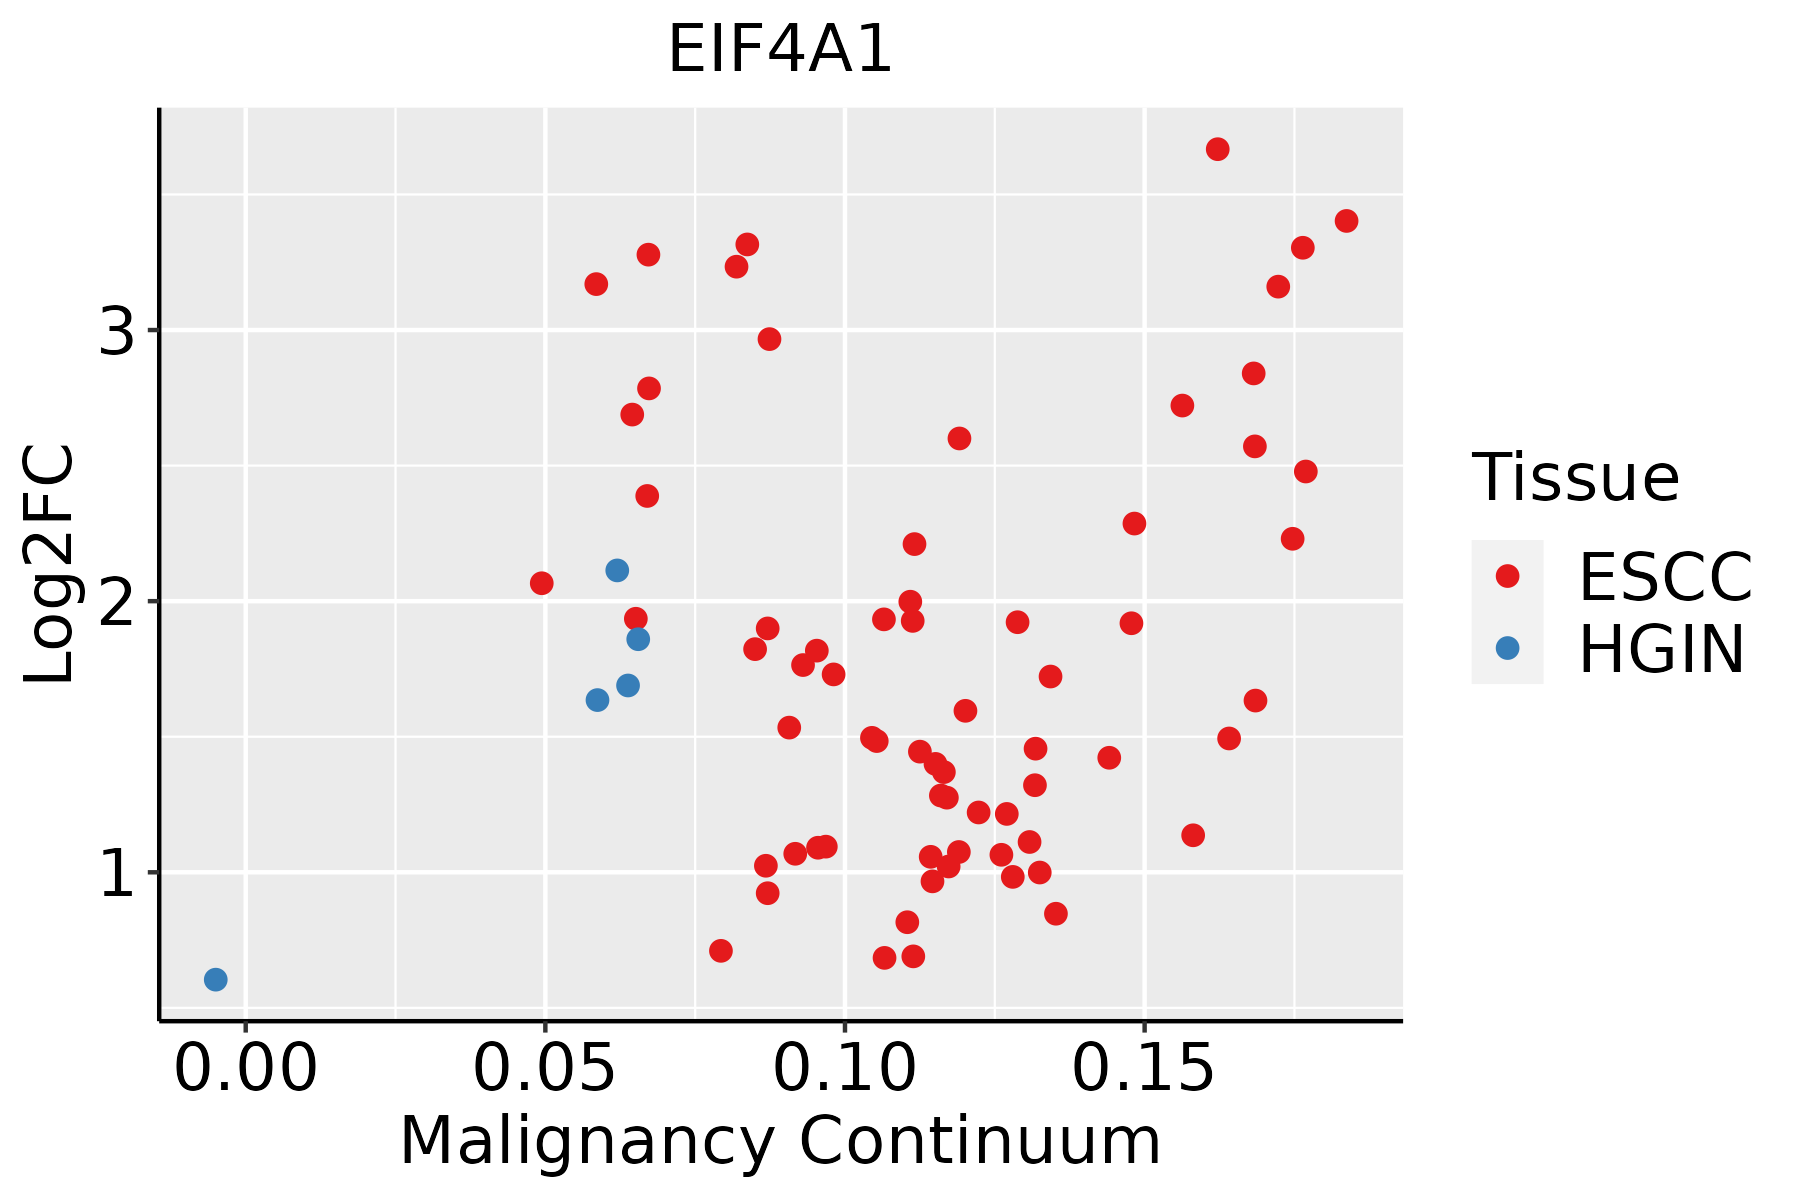 | ESCC: Esophageal squamous cell carcinoma |
| HGIN: High-grade intraepithelial neoplasias | ||
| LGIN: Low-grade intraepithelial neoplasias | ||
| GC |  | CAG: Chronic atrophic gastritis |
| CAG with IM: Chronic atrophic gastritis with intestinal metaplasia | ||
| CSG: Chronic superficial gastritis | ||
| GC: Gastric cancer | ||
| SIM: Severe intestinal metaplasia | ||
| WIM: Wild intestinal metaplasia | ||
| Liver |  | HCC: Hepatocellular carcinoma |
| NAFLD: Non-alcoholic fatty liver disease | ||
| Lung |  | AAH: Atypical adenomatous hyperplasia |
| AIS: Adenocarcinoma in situ | ||
| IAC: Invasive lung adenocarcinoma | ||
| MIA: Minimally invasive adenocarcinoma | ||
| Oral Cavity | 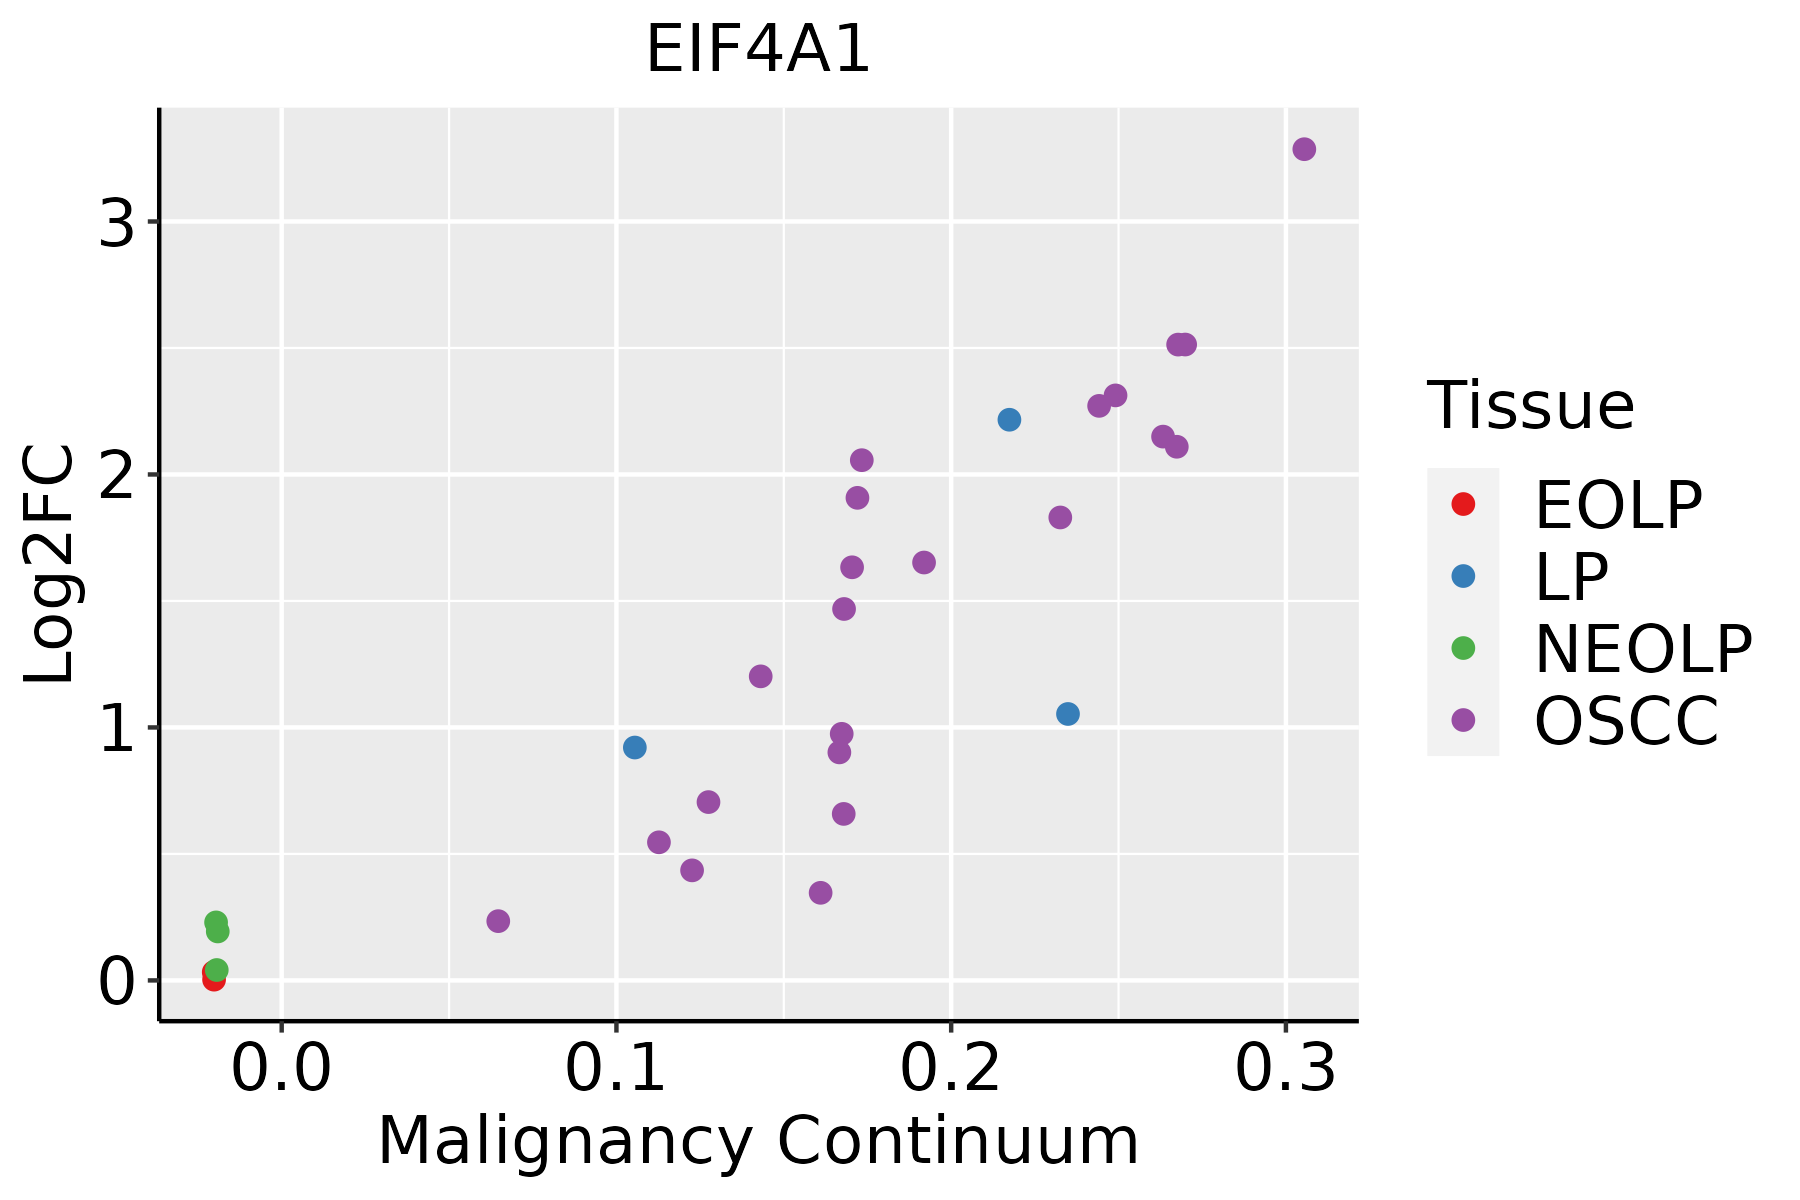 | EOLP: Erosive Oral lichen planus |
| LP: leukoplakia | ||
| NEOLP: Non-erosive oral lichen planus | ||
| OSCC: Oral squamous cell carcinoma | ||
| Prostate | 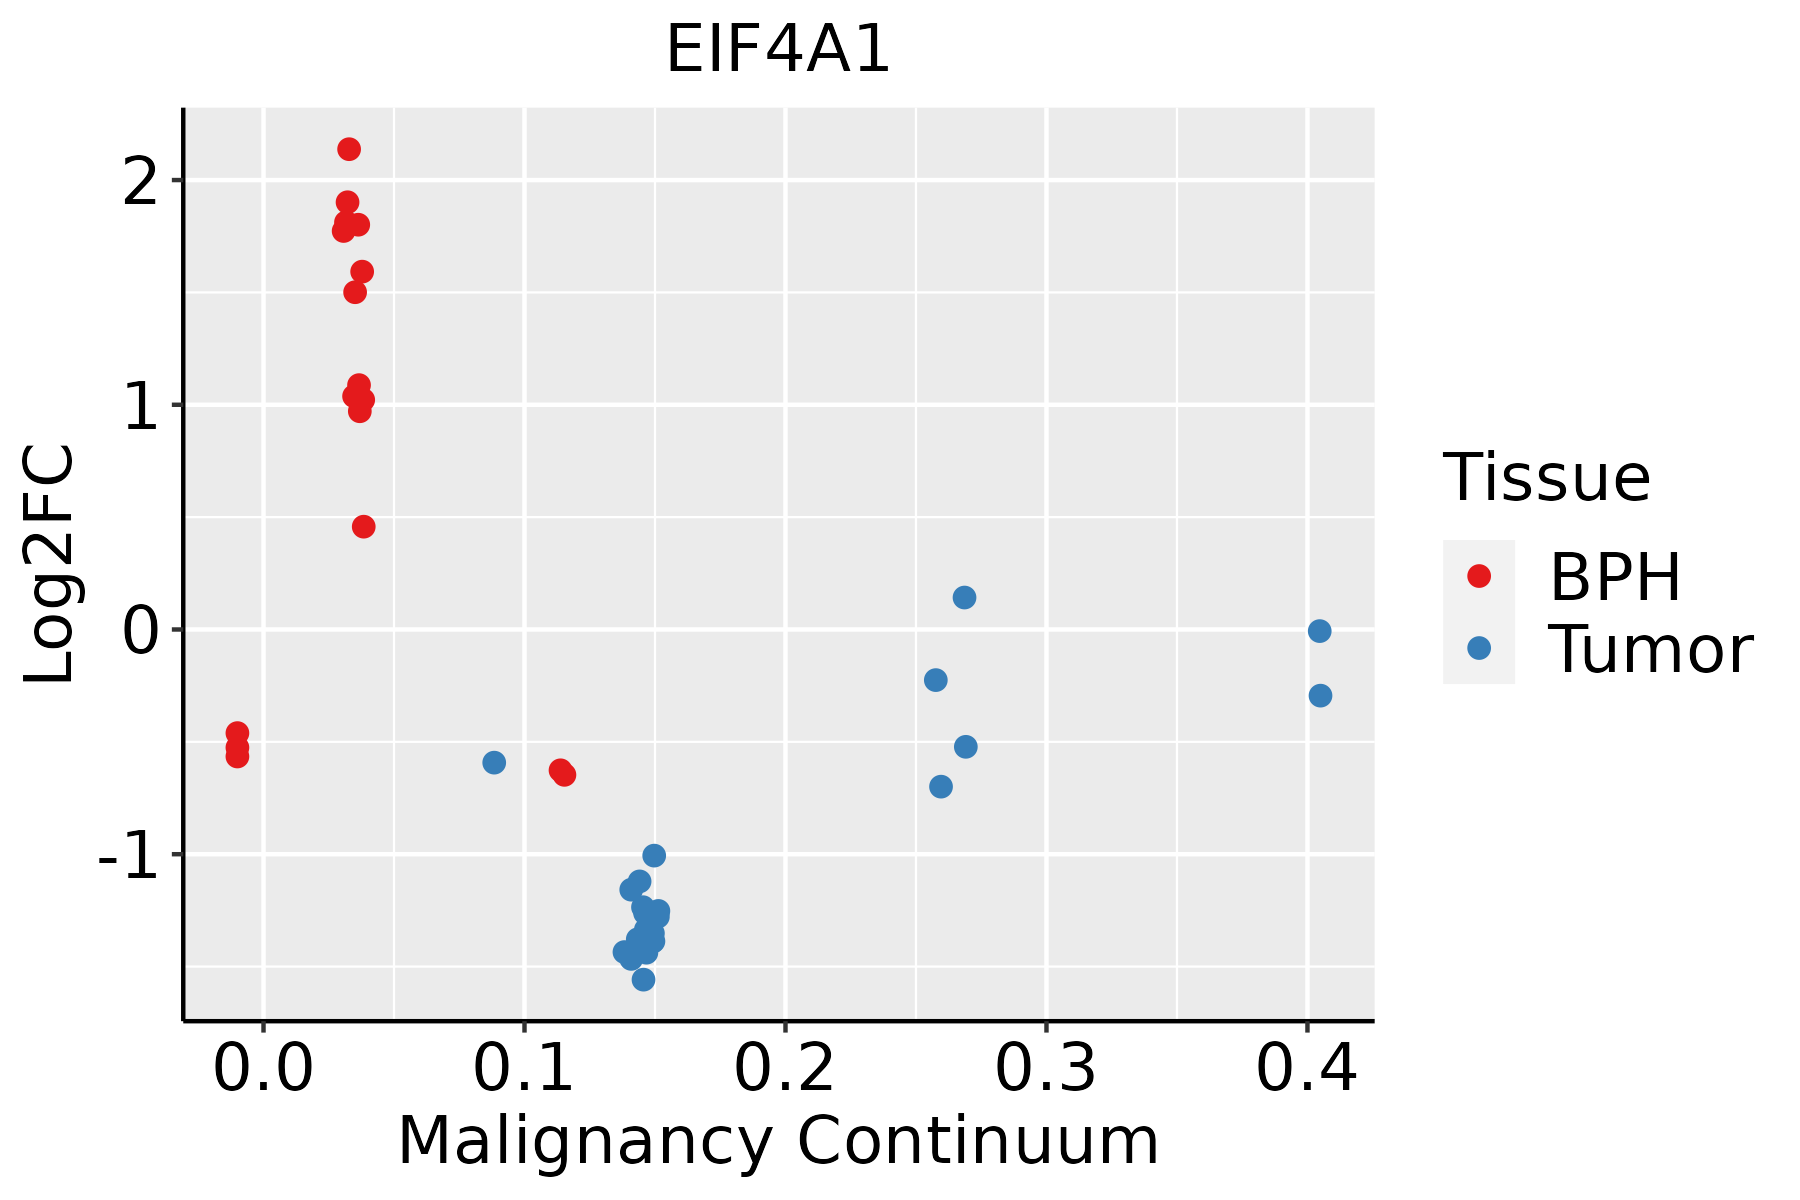 | BPH: Benign Prostatic Hyperplasia |
| Skin | 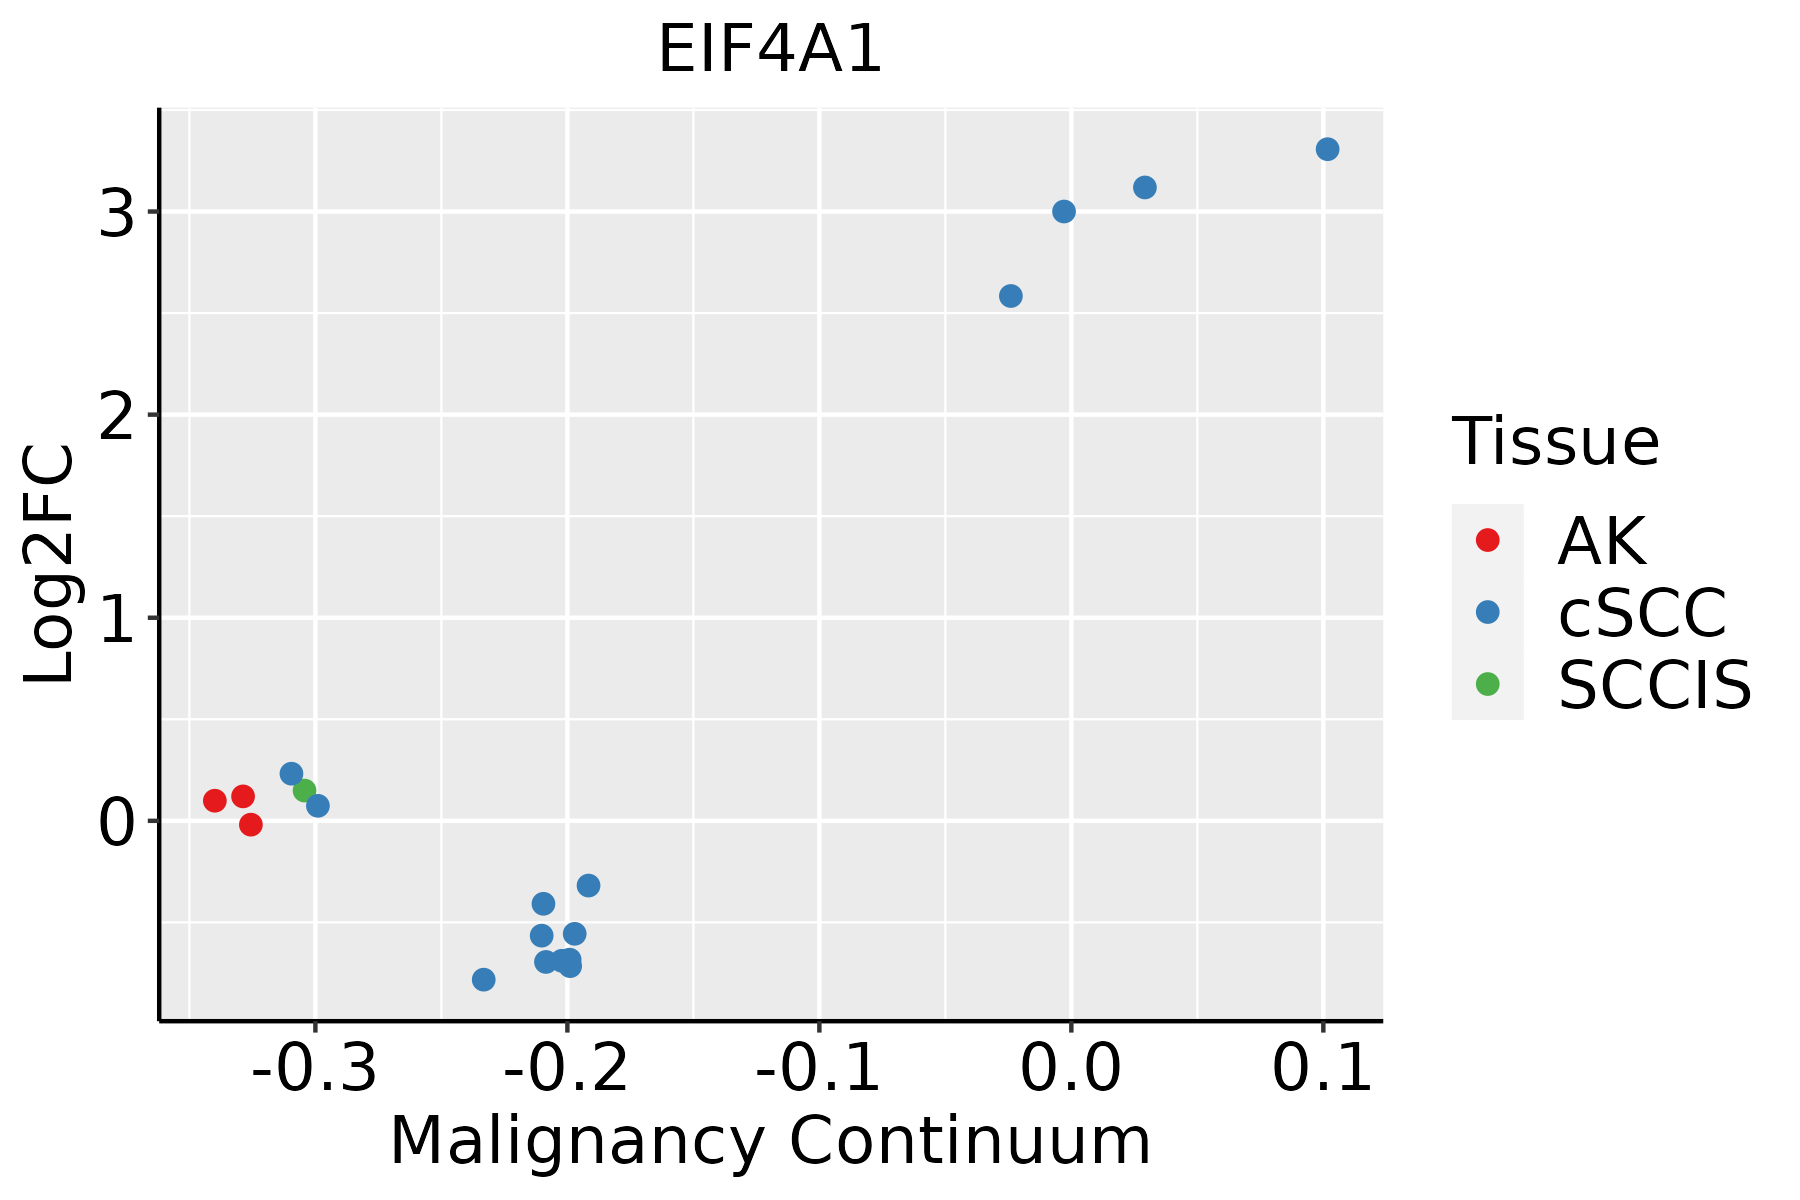 | AK: Actinic keratosis |
| cSCC: Cutaneous squamous cell carcinoma | ||
| SCCIS:squamous cell carcinoma in situ | ||
| Thyroid |  | ATC: Anaplastic thyroid cancer |
| HT: Hashimoto's thyroiditis | ||
| PTC: Papillary thyroid cancer |
| ∗log2FC in expression of this searched gene in stem-like cells from each diseased tissue sample relative to stem-like cells in normal samples in each tissue plotted against the malignancy continuum. Samples are colored based on if they are from different disease stage. |
Top |
Malignant transformation related pathway analysis |
| Find out the enriched GO biological processes and KEGG pathways involved in transition from healthy to precancer to cancer |
| Tissue | Disease Stage | Enriched GO biological Processes |
| Colorectum | AD |  |
| Colorectum | SER |  |
| Colorectum | MSS |  |
| Colorectum | MSI-H |  |
| Colorectum | FAP |  |
| ∗Top 15 enriched GO BP terms are showed in the bar plot of each disease state in each tissue. Each row represents a significant GO biological process which is colored according to the -log10(p.adjust). |
| Page: 1 2 3 4 5 6 7 8 9 |
| GO ID | Tissue | Disease Stage | Description | Gene Ratio | Bg Ratio | pvalue | p.adjust | Count |
| GO:00021819 | Breast | Precancer | cytoplasmic translation | 80/1080 | 148/18723 | 1.59e-59 | 8.54e-56 | 80 |
| GO:00064138 | Breast | Precancer | translational initiation | 30/1080 | 118/18723 | 3.23e-12 | 5.58e-10 | 30 |
| GO:00021838 | Breast | Precancer | cytoplasmic translational initiation | 11/1080 | 34/18723 | 1.87e-06 | 6.63e-05 | 11 |
| GO:000218114 | Breast | IDC | cytoplasmic translation | 82/1434 | 148/18723 | 2.60e-52 | 1.48e-48 | 82 |
| GO:000641313 | Breast | IDC | translational initiation | 31/1434 | 118/18723 | 7.29e-10 | 7.52e-08 | 31 |
| GO:000218313 | Breast | IDC | cytoplasmic translational initiation | 12/1434 | 34/18723 | 4.35e-06 | 1.53e-04 | 12 |
| GO:000218124 | Breast | DCIS | cytoplasmic translation | 82/1390 | 148/18723 | 2.21e-53 | 1.25e-49 | 82 |
| GO:000641323 | Breast | DCIS | translational initiation | 30/1390 | 118/18723 | 1.53e-09 | 1.43e-07 | 30 |
| GO:000218323 | Breast | DCIS | cytoplasmic translational initiation | 12/1390 | 34/18723 | 3.15e-06 | 1.02e-04 | 12 |
| GO:000218110 | Cervix | CC | cytoplasmic translation | 96/2311 | 148/18723 | 4.87e-51 | 2.91e-47 | 96 |
| GO:00064139 | Cervix | CC | translational initiation | 25/2311 | 118/18723 | 4.54e-03 | 2.75e-02 | 25 |
| GO:00021839 | Cervix | CC | cytoplasmic translational initiation | 10/2311 | 34/18723 | 6.40e-03 | 3.58e-02 | 10 |
| GO:000218115 | Cervix | HSIL_HPV | cytoplasmic translation | 86/737 | 148/18723 | 3.97e-82 | 1.91e-78 | 86 |
| GO:000641314 | Cervix | HSIL_HPV | translational initiation | 16/737 | 118/18723 | 1.56e-05 | 4.80e-04 | 16 |
| GO:000218314 | Cervix | HSIL_HPV | cytoplasmic translational initiation | 8/737 | 34/18723 | 4.06e-05 | 1.08e-03 | 8 |
| GO:000218116 | Endometrium | AEH | cytoplasmic translation | 104/2100 | 148/18723 | 1.01e-64 | 6.07e-61 | 104 |
| GO:000641310 | Endometrium | AEH | translational initiation | 42/2100 | 118/18723 | 2.68e-12 | 4.67e-10 | 42 |
| GO:000218310 | Endometrium | AEH | cytoplasmic translational initiation | 18/2100 | 34/18723 | 2.75e-09 | 2.06e-07 | 18 |
| GO:000218117 | Endometrium | EEC | cytoplasmic translation | 104/2168 | 148/18723 | 2.53e-63 | 1.52e-59 | 104 |
| GO:000641315 | Endometrium | EEC | translational initiation | 42/2168 | 118/18723 | 7.65e-12 | 1.24e-09 | 42 |
| Page: 1 2 3 4 5 |
| Pathway ID | Tissue | Disease Stage | Description | Gene Ratio | Bg Ratio | pvalue | p.adjust | qvalue | Count |
| Page: 1 |
Top |
Cell-cell communication analysis |
| Identification of potential cell-cell interactions between two cell types and their ligand-receptor pairs for different disease states |
| Ligand | Receptor | LRpair | Pathway | Tissue | Disease Stage |
| Page: 1 |
Top |
Single-cell gene regulatory network inference analysis |
| Find out the significant the regulons (TFs) and the target genes of each regulon across cell types for different disease states |
| TF | Cell Type | Tissue | Disease Stage | Target Gene | RSS | Regulon Activity |
| ∗The dot plots of a searched regulon are shown for all cell subpopulations in each disease state of each tissue based on the regulon specific score inferred using pySCENIC and by calculating the average expression. |
| Page: 1 |
Top |
Somatic mutation of malignant transformation related genes |
| Annotation of somatic variants for genes involved in malignant transformation |
| Hugo Symbol | Variant Class | Variant Classification | dbSNP RS | HGVSc | HGVSp | HGVSp Short | SWISSPROT | BIOTYPE | SIFT | PolyPhen | Tumor Sample Barcode | Tissue | Histology | Sex | Age | Stage | Therapy Types | Drugs | Outcome |
| EIF4A1 | SNV | Missense_Mutation | novel | c.997N>T | p.Ala333Ser | p.A333S | P60842 | protein_coding | deleterious(0.04) | benign(0.266) | TCGA-5L-AAT1-01 | Breast | breast invasive carcinoma | Female | <65 | III/IV | Hormone Therapy | letrozol | SD |
| EIF4A1 | SNV | Missense_Mutation | novel | c.706G>T | p.Val236Phe | p.V236F | P60842 | protein_coding | deleterious(0.02) | possibly_damaging(0.57) | TCGA-A2-A25E-01 | Breast | breast invasive carcinoma | Female | <65 | III/IV | Chemotherapy | cytoxan | PD |
| EIF4A1 | deletion | Frame_Shift_Del | novel | c.803delN | p.Thr269ProfsTer2 | p.T269Pfs*2 | P60842 | protein_coding | TCGA-D8-A27V-01 | Breast | breast invasive carcinoma | Female | <65 | I/II | Hormone Therapy | tamoxiphen | SD | ||
| EIF4A1 | deletion | Frame_Shift_Del | novel | c.1141_1142delNN | p.Lys381GlufsTer7 | p.K381Efs*7 | P60842 | protein_coding | TCGA-JL-A3YW-01 | Breast | breast invasive carcinoma | Female | <65 | I/II | Unknown | Unknown | SD | ||
| EIF4A1 | SNV | Missense_Mutation | novel | c.385N>A | p.Ala129Thr | p.A129T | P60842 | protein_coding | deleterious(0.02) | benign(0.364) | TCGA-2W-A8YY-01 | Cervix | cervical & endocervical cancer | Female | <65 | I/II | Chemotherapy | cisplatin | CR |
| EIF4A1 | SNV | Missense_Mutation | c.638C>T | p.Ser213Leu | p.S213L | P60842 | protein_coding | deleterious(0) | probably_damaging(0.995) | TCGA-IR-A3LL-01 | Cervix | cervical & endocervical cancer | Female | <65 | I/II | Chemotherapy | cisplatin | CR | |
| EIF4A1 | SNV | Missense_Mutation | novel | c.478G>A | p.Gly160Ser | p.G160S | P60842 | protein_coding | deleterious(0) | probably_damaging(0.978) | TCGA-JW-A5VI-01 | Cervix | cervical & endocervical cancer | Female | <65 | I/II | Chemotherapy | topotecan | PD |
| EIF4A1 | SNV | Missense_Mutation | c.233C>A | p.Ser78Tyr | p.S78Y | P60842 | protein_coding | deleterious(0) | probably_damaging(0.999) | TCGA-JW-A5VL-01 | Cervix | cervical & endocervical cancer | Female | <65 | I/II | Unknown | Unknown | SD | |
| EIF4A1 | SNV | Missense_Mutation | novel | c.932G>A | p.Arg311Gln | p.R311Q | P60842 | protein_coding | deleterious(0.02) | probably_damaging(0.965) | TCGA-VS-A8EL-01 | Cervix | cervical & endocervical cancer | Female | <65 | I/II | Chemotherapy | cisplatin | CR |
| EIF4A1 | SNV | Missense_Mutation | rs865904208 | c.697N>T | p.Arg233Trp | p.R233W | P60842 | protein_coding | deleterious(0.03) | benign(0.075) | TCGA-G4-6302-01 | Colorectum | colon adenocarcinoma | Female | >=65 | I/II | Unknown | Unknown | SD |
| Page: 1 2 3 4 |
Top |
Related drugs of malignant transformation related genes |
| Identification of chemicals and drugs interact with genes involved in malignant transfromation |
| (DGIdb 4.0) |
| Entrez ID | Symbol | Category | Interaction Types | Drug Claim Name | Drug Name | PMIDs |
| 1973 | EIF4A1 | DRUGGABLE GENOME | SILVESTROL | SILVESTROL | 22128783 | |
| 1973 | EIF4A1 | DRUGGABLE GENOME | HIPPURISTANOL | HIPPURISTANOL | 16532013 |
| Page: 1 |

Copyright 2023-Present -The University of Texas Health Science Center at Houston |