
|
|||||
|
 | |
| |
| |
| |
| |
| |
|
Gene: EIF3M |
Gene summary for EIF3M |
| Gene information | Species | Human | Gene symbol | EIF3M | Gene ID | 10480 |
| Gene name | eukaryotic translation initiation factor 3 subunit M | |
| Gene Alias | B5 | |
| Cytomap | 11p13 | |
| Gene Type | protein-coding | GO ID | GO:0001732 | UniProtAcc | Q7L2H7 |
Top |
Malignant transformation analysis |
| Identification of the aberrant gene expression in precancerous and cancerous lesions by comparing the gene expression of stem-like cells in diseased tissues with normal stem cells |
| Entrez ID | Symbol | Replicates | Species | Organ | Tissue | Adj P-value | Log2FC | Malignancy |
| 10480 | EIF3M | AEH-subject1 | Human | Endometrium | AEH | 2.30e-24 | -5.03e-01 | -0.3059 |
| 10480 | EIF3M | AEH-subject2 | Human | Endometrium | AEH | 5.22e-18 | -5.27e-01 | -0.2525 |
| 10480 | EIF3M | AEH-subject3 | Human | Endometrium | AEH | 8.52e-20 | -4.44e-01 | -0.2576 |
| 10480 | EIF3M | AEH-subject4 | Human | Endometrium | AEH | 1.67e-11 | -4.40e-01 | -0.2657 |
| 10480 | EIF3M | AEH-subject5 | Human | Endometrium | AEH | 2.33e-09 | -3.46e-01 | -0.2953 |
| 10480 | EIF3M | EEC-subject1 | Human | Endometrium | EEC | 1.18e-21 | -4.57e-01 | -0.2682 |
| 10480 | EIF3M | EEC-subject2 | Human | Endometrium | EEC | 3.41e-27 | -5.39e-01 | -0.2607 |
| 10480 | EIF3M | EEC-subject3 | Human | Endometrium | EEC | 6.21e-45 | -5.34e-01 | -0.2525 |
| 10480 | EIF3M | EEC-subject4 | Human | Endometrium | EEC | 2.71e-12 | -3.67e-01 | -0.2571 |
| 10480 | EIF3M | EEC-subject5 | Human | Endometrium | EEC | 8.78e-12 | -4.11e-01 | -0.249 |
| 10480 | EIF3M | GSM5276934 | Human | Endometrium | EEC | 4.88e-04 | 1.46e-01 | -0.0913 |
| 10480 | EIF3M | GSM5276937 | Human | Endometrium | EEC | 3.16e-03 | 1.58e-01 | -0.0897 |
| 10480 | EIF3M | GSM6177620_NYU_UCEC1_lib1_lib1 | Human | Endometrium | EEC | 1.06e-35 | -2.16e-01 | -0.1869 |
| 10480 | EIF3M | GSM6177620_NYU_UCEC1_lib2_lib2 | Human | Endometrium | EEC | 7.95e-36 | -2.98e-01 | -0.1875 |
| 10480 | EIF3M | GSM6177620_NYU_UCEC1_lib3_lib3 | Human | Endometrium | EEC | 6.04e-46 | -2.15e-01 | -0.1883 |
| 10480 | EIF3M | GSM6177621_NYU_UCEC2_lib1_lib1 | Human | Endometrium | EEC | 3.90e-34 | -4.14e-01 | -0.1934 |
| 10480 | EIF3M | GSM6177622_NYU_UCEC3_lib1_lib1 | Human | Endometrium | EEC | 1.31e-49 | -4.18e-01 | -0.1917 |
| 10480 | EIF3M | GSM6177622_NYU_UCEC3_lib2_lib2 | Human | Endometrium | EEC | 2.44e-59 | -4.45e-01 | -0.1916 |
| 10480 | EIF3M | GSM6177623_NYU_UCEC3_Vis | Human | Endometrium | EEC | 2.40e-08 | -1.49e-01 | -0.1269 |
| 10480 | EIF3M | LZE4T | Human | Esophagus | ESCC | 1.96e-09 | 3.70e-01 | 0.0811 |
| Page: 1 2 3 4 5 6 7 8 9 |
| Tissue | Expression Dynamics | Abbreviation |
| Endometrium | 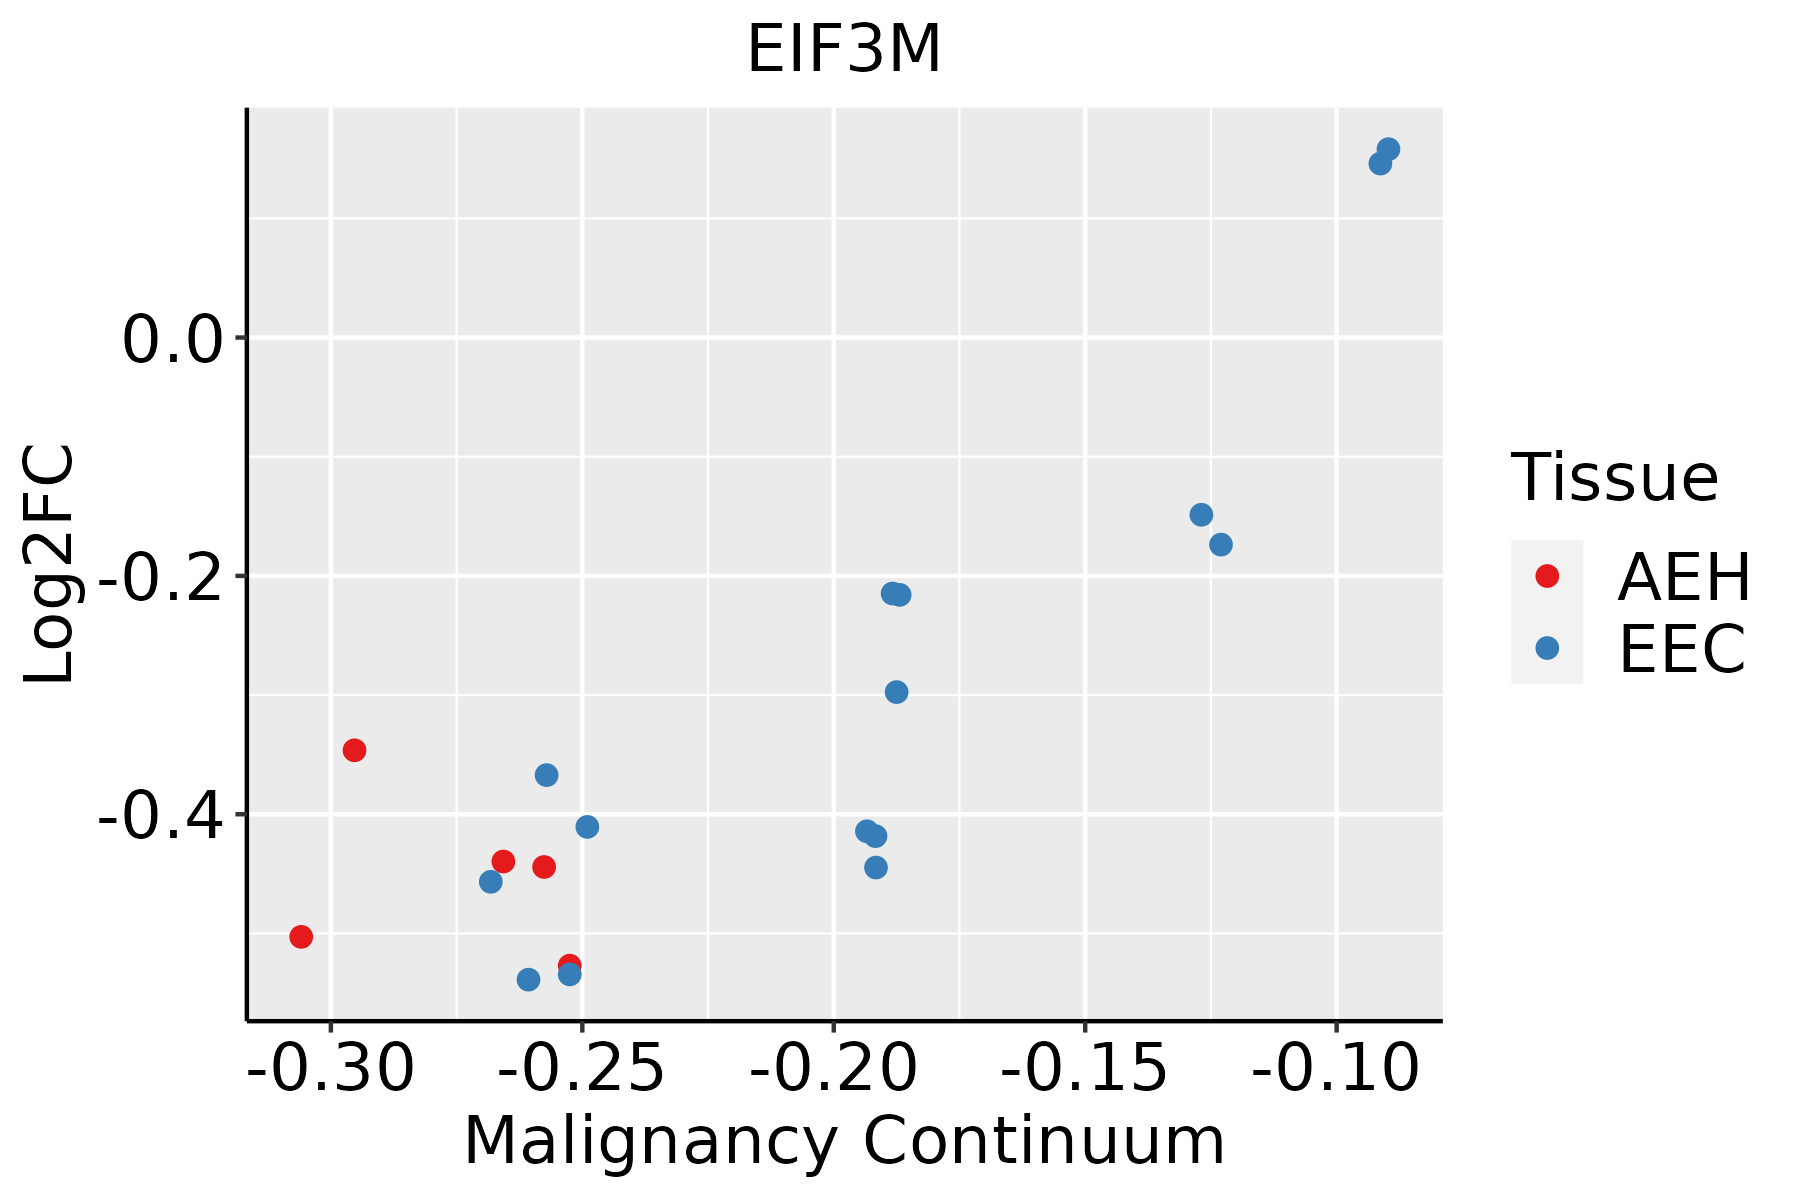 | AEH: Atypical endometrial hyperplasia |
| EEC: Endometrioid Cancer | ||
| Esophagus |  | ESCC: Esophageal squamous cell carcinoma |
| HGIN: High-grade intraepithelial neoplasias | ||
| LGIN: Low-grade intraepithelial neoplasias | ||
| Liver |  | HCC: Hepatocellular carcinoma |
| NAFLD: Non-alcoholic fatty liver disease | ||
| Oral Cavity |  | EOLP: Erosive Oral lichen planus |
| LP: leukoplakia | ||
| NEOLP: Non-erosive oral lichen planus | ||
| OSCC: Oral squamous cell carcinoma | ||
| Prostate |  | BPH: Benign Prostatic Hyperplasia |
| Skin | 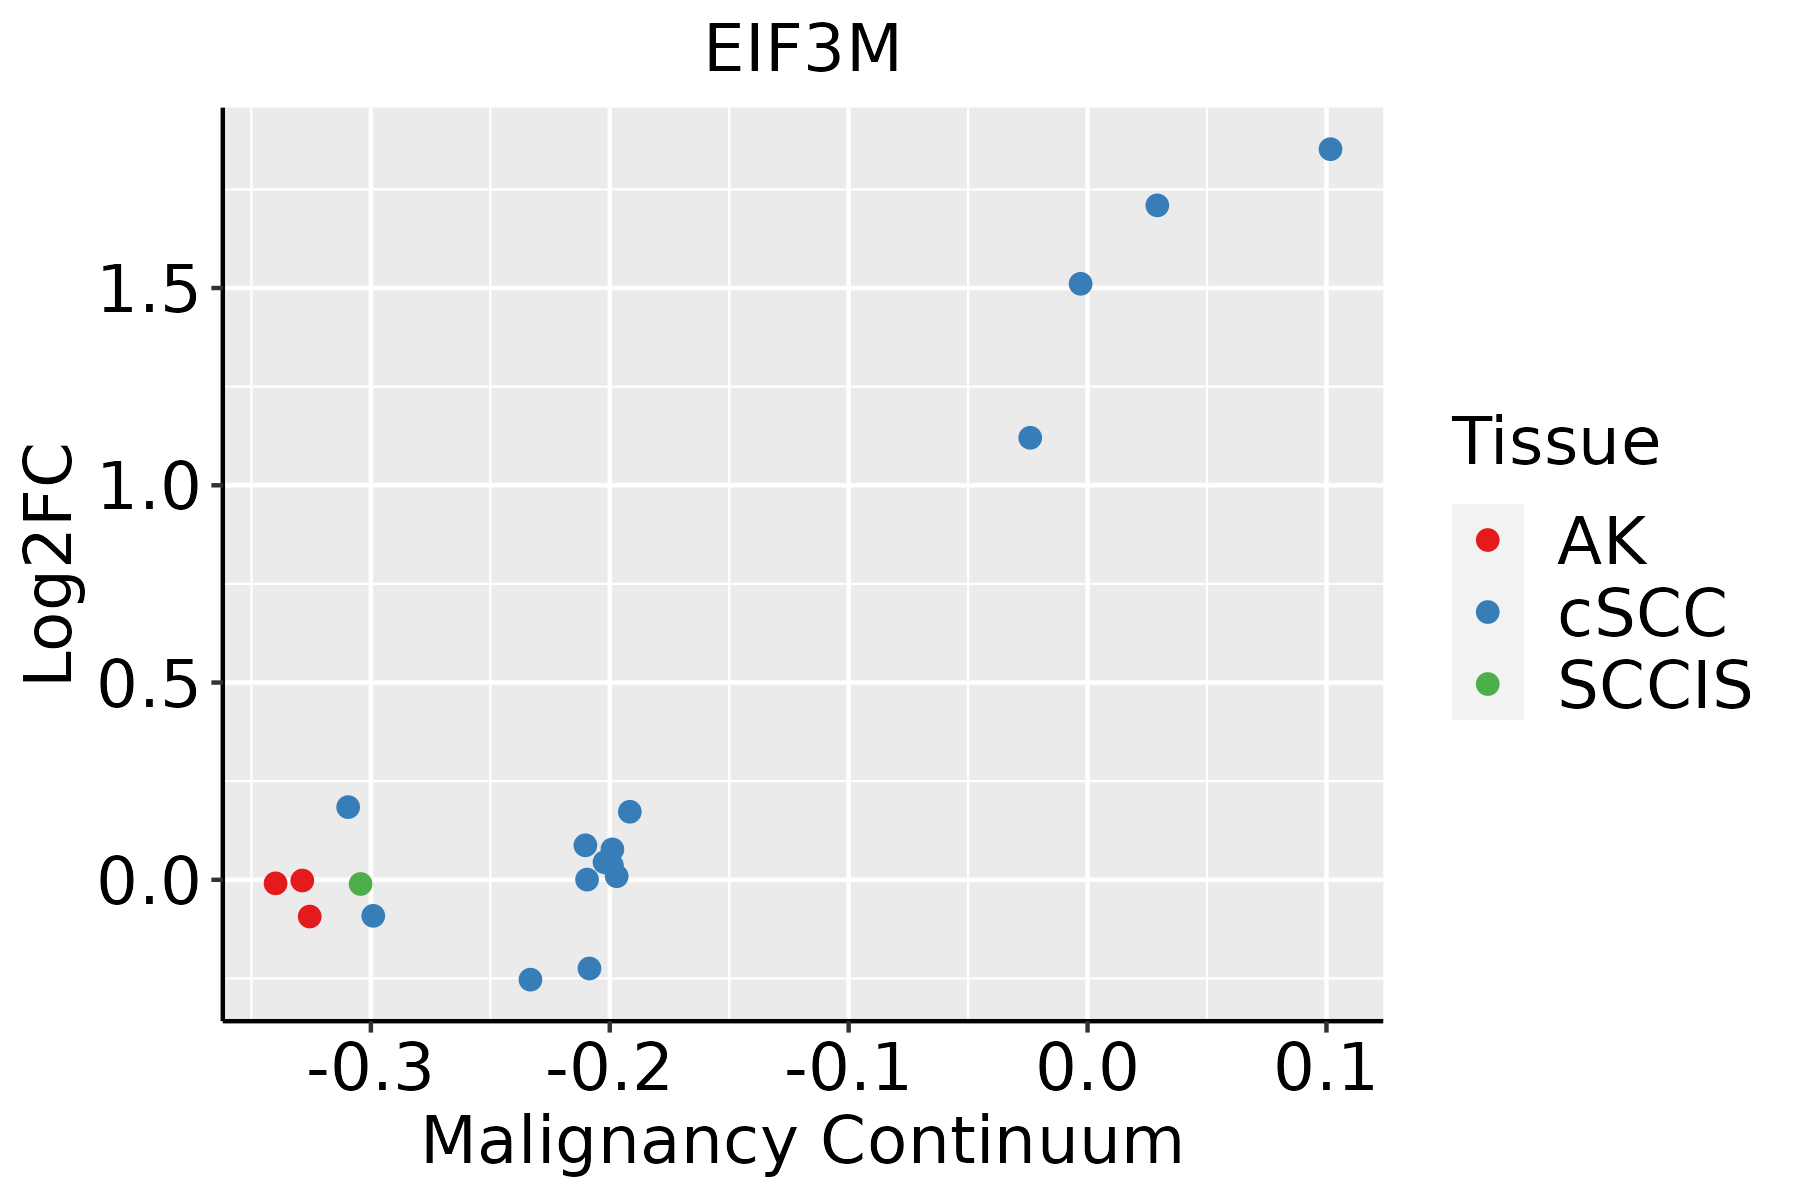 | AK: Actinic keratosis |
| cSCC: Cutaneous squamous cell carcinoma | ||
| SCCIS:squamous cell carcinoma in situ | ||
| Thyroid | 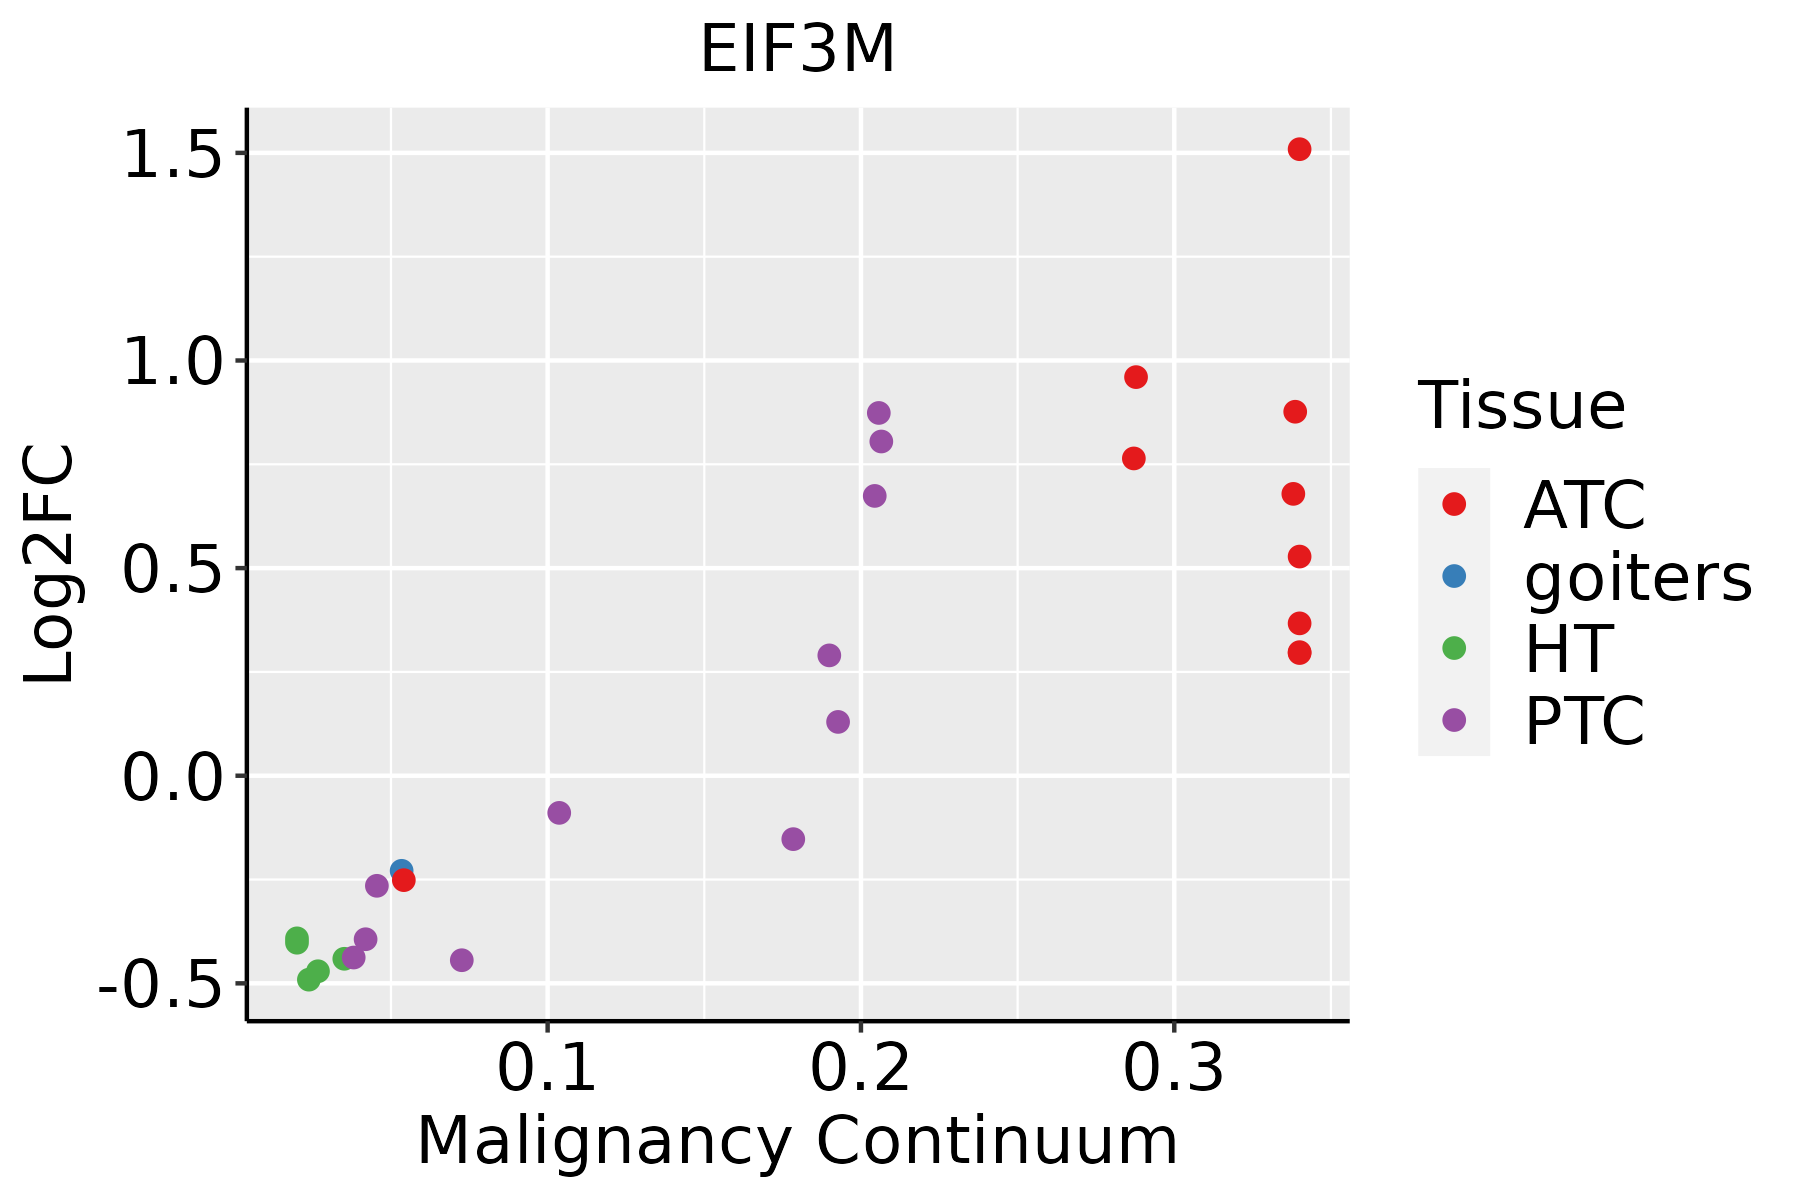 | ATC: Anaplastic thyroid cancer |
| HT: Hashimoto's thyroiditis | ||
| PTC: Papillary thyroid cancer |
| ∗log2FC in expression of this searched gene in stem-like cells from each diseased tissue sample relative to stem-like cells in normal samples in each tissue plotted against the malignancy continuum. Samples are colored based on if they are from different disease stage. |
Top |
Malignant transformation related pathway analysis |
| Find out the enriched GO biological processes and KEGG pathways involved in transition from healthy to precancer to cancer |
| Tissue | Disease Stage | Enriched GO biological Processes |
| Colorectum | AD |  |
| Colorectum | SER |  |
| Colorectum | MSS |  |
| Colorectum | MSI-H |  |
| Colorectum | FAP |  |
| ∗Top 15 enriched GO BP terms are showed in the bar plot of each disease state in each tissue. Each row represents a significant GO biological process which is colored according to the -log10(p.adjust). |
| Page: 1 2 3 4 5 6 7 8 9 |
| GO ID | Tissue | Disease Stage | Description | Gene Ratio | Bg Ratio | pvalue | p.adjust | Count |
| GO:000218116 | Endometrium | AEH | cytoplasmic translation | 104/2100 | 148/18723 | 1.01e-64 | 6.07e-61 | 104 |
| GO:002261316 | Endometrium | AEH | ribonucleoprotein complex biogenesis | 107/2100 | 463/18723 | 1.43e-13 | 4.08e-11 | 107 |
| GO:007182616 | Endometrium | AEH | ribonucleoprotein complex subunit organization | 65/2100 | 227/18723 | 4.47e-13 | 1.07e-10 | 65 |
| GO:002261816 | Endometrium | AEH | ribonucleoprotein complex assembly | 63/2100 | 220/18723 | 1.02e-12 | 2.24e-10 | 63 |
| GO:000641310 | Endometrium | AEH | translational initiation | 42/2100 | 118/18723 | 2.68e-12 | 4.67e-10 | 42 |
| GO:000173210 | Endometrium | AEH | formation of cytoplasmic translation initiation complex | 13/2100 | 16/18723 | 1.74e-10 | 1.93e-08 | 13 |
| GO:000218310 | Endometrium | AEH | cytoplasmic translational initiation | 18/2100 | 34/18723 | 2.75e-09 | 2.06e-07 | 18 |
| GO:000218117 | Endometrium | EEC | cytoplasmic translation | 104/2168 | 148/18723 | 2.53e-63 | 1.52e-59 | 104 |
| GO:002261317 | Endometrium | EEC | ribonucleoprotein complex biogenesis | 108/2168 | 463/18723 | 4.60e-13 | 9.86e-11 | 108 |
| GO:007182617 | Endometrium | EEC | ribonucleoprotein complex subunit organization | 65/2168 | 227/18723 | 1.91e-12 | 3.58e-10 | 65 |
| GO:002261817 | Endometrium | EEC | ribonucleoprotein complex assembly | 63/2168 | 220/18723 | 4.16e-12 | 7.56e-10 | 63 |
| GO:000641315 | Endometrium | EEC | translational initiation | 42/2168 | 118/18723 | 7.65e-12 | 1.24e-09 | 42 |
| GO:000173215 | Endometrium | EEC | formation of cytoplasmic translation initiation complex | 13/2168 | 16/18723 | 2.60e-10 | 2.89e-08 | 13 |
| GO:000218315 | Endometrium | EEC | cytoplasmic translational initiation | 18/2168 | 34/18723 | 4.60e-09 | 3.14e-07 | 18 |
| GO:000218127 | Esophagus | HGIN | cytoplasmic translation | 108/2587 | 148/18723 | 1.70e-60 | 1.02e-56 | 108 |
| GO:002261327 | Esophagus | HGIN | ribonucleoprotein complex biogenesis | 158/2587 | 463/18723 | 2.61e-29 | 5.23e-26 | 158 |
| GO:007182627 | Esophagus | HGIN | ribonucleoprotein complex subunit organization | 84/2587 | 227/18723 | 1.34e-18 | 5.37e-16 | 84 |
| GO:002261827 | Esophagus | HGIN | ribonucleoprotein complex assembly | 82/2587 | 220/18723 | 2.07e-18 | 7.36e-16 | 82 |
| GO:000641320 | Esophagus | HGIN | translational initiation | 55/2587 | 118/18723 | 7.33e-18 | 2.31e-15 | 55 |
| GO:000218320 | Esophagus | HGIN | cytoplasmic translational initiation | 19/2587 | 34/18723 | 1.01e-08 | 6.44e-07 | 19 |
| Page: 1 2 3 4 5 |
| Pathway ID | Tissue | Disease Stage | Description | Gene Ratio | Bg Ratio | pvalue | p.adjust | qvalue | Count |
| Page: 1 |
Top |
Cell-cell communication analysis |
| Identification of potential cell-cell interactions between two cell types and their ligand-receptor pairs for different disease states |
| Ligand | Receptor | LRpair | Pathway | Tissue | Disease Stage |
| Page: 1 |
Top |
Single-cell gene regulatory network inference analysis |
| Find out the significant the regulons (TFs) and the target genes of each regulon across cell types for different disease states |
| TF | Cell Type | Tissue | Disease Stage | Target Gene | RSS | Regulon Activity |
| ∗The dot plots of a searched regulon are shown for all cell subpopulations in each disease state of each tissue based on the regulon specific score inferred using pySCENIC and by calculating the average expression. |
| Page: 1 |
Top |
Somatic mutation of malignant transformation related genes |
| Annotation of somatic variants for genes involved in malignant transformation |
| Hugo Symbol | Variant Class | Variant Classification | dbSNP RS | HGVSc | HGVSp | HGVSp Short | SWISSPROT | BIOTYPE | SIFT | PolyPhen | Tumor Sample Barcode | Tissue | Histology | Sex | Age | Stage | Therapy Types | Drugs | Outcome |
| EIF3M | SNV | Missense_Mutation | c.110G>C | p.Gly37Ala | p.G37A | Q7L2H7 | protein_coding | tolerated(0.14) | possibly_damaging(0.773) | TCGA-E2-A14R-01 | Breast | breast invasive carcinoma | Female | <65 | I/II | Chemotherapy | doxorubicin | PD | |
| EIF3M | SNV | Missense_Mutation | c.584A>G | p.Asp195Gly | p.D195G | Q7L2H7 | protein_coding | deleterious(0.01) | probably_damaging(0.984) | TCGA-AA-A00N-01 | Colorectum | colon adenocarcinoma | Male | >=65 | I/II | Unknown | Unknown | PD | |
| EIF3M | SNV | Missense_Mutation | c.617N>T | p.Arg206Met | p.R206M | Q7L2H7 | protein_coding | deleterious(0) | possibly_damaging(0.62) | TCGA-AD-6964-01 | Colorectum | colon adenocarcinoma | Male | <65 | III/IV | Chemotherapy | folfox | PD | |
| EIF3M | SNV | Missense_Mutation | rs746678519 | c.101C>T | p.Ser34Leu | p.S34L | Q7L2H7 | protein_coding | deleterious(0.02) | benign(0.13) | TCGA-AP-A0LM-01 | Endometrium | uterine corpus endometrioid carcinoma | Female | <65 | III/IV | Chemotherapy | cisplatin | SD |
| EIF3M | SNV | Missense_Mutation | c.748G>A | p.Ala250Thr | p.A250T | Q7L2H7 | protein_coding | tolerated(0.32) | benign(0.067) | TCGA-AP-A0LM-01 | Endometrium | uterine corpus endometrioid carcinoma | Female | <65 | III/IV | Chemotherapy | cisplatin | SD | |
| EIF3M | SNV | Missense_Mutation | c.602G>A | p.Arg201Gln | p.R201Q | Q7L2H7 | protein_coding | deleterious(0.01) | benign(0.213) | TCGA-AP-A0LT-01 | Endometrium | uterine corpus endometrioid carcinoma | Female | <65 | I/II | Unknown | Unknown | SD | |
| EIF3M | SNV | Missense_Mutation | c.943N>T | p.Ala315Ser | p.A315S | Q7L2H7 | protein_coding | deleterious(0.02) | probably_damaging(0.913) | TCGA-AP-A1DK-01 | Endometrium | uterine corpus endometrioid carcinoma | Female | <65 | I/II | Unknown | Unknown | SD | |
| EIF3M | SNV | Missense_Mutation | c.345G>T | p.Lys115Asn | p.K115N | Q7L2H7 | protein_coding | tolerated(0.14) | benign(0.052) | TCGA-AX-A0J0-01 | Endometrium | uterine corpus endometrioid carcinoma | Female | <65 | I/II | Unknown | Unknown | SD | |
| EIF3M | SNV | Missense_Mutation | rs746678519 | c.101N>T | p.Ser34Leu | p.S34L | Q7L2H7 | protein_coding | deleterious(0.02) | benign(0.13) | TCGA-AX-A2HD-01 | Endometrium | uterine corpus endometrioid carcinoma | Female | >=65 | III/IV | Unknown | Unknown | SD |
| EIF3M | SNV | Missense_Mutation | c.462G>T | p.Trp154Cys | p.W154C | Q7L2H7 | protein_coding | tolerated(0.59) | probably_damaging(0.993) | TCGA-BG-A18B-01 | Endometrium | uterine corpus endometrioid carcinoma | Female | <65 | I/II | Unknown | Unknown | SD |
| Page: 1 2 3 |
Top |
Related drugs of malignant transformation related genes |
| Identification of chemicals and drugs interact with genes involved in malignant transfromation |
| (DGIdb 4.0) |
| Entrez ID | Symbol | Category | Interaction Types | Drug Claim Name | Drug Name | PMIDs |
| Page: 1 |

Copyright 2023-Present -The University of Texas Health Science Center at Houston |