Schematic overview of the cellular and molecular mechanisms involved in the cancer progression, including the proposed cellular and molecular mechanisms in cancer cells trajectory. AT1: alveolar type 1 cells; AT2: alveolar type 2 cells; AAH: atypical adenomatous hyperplasia; AIS: adenocarcinoma in situ; MIA: minimally invasive adenocarcinoma; IA: invasive adenocarcinoma; EMT: epithelial-mesenchymal transition

Home

Download

Statistics

Help

Contact

Center for Computational Systems Medicine
leaf

Gene summary

leaf

Malignant transformation analysis

leaf

Malignant transformation related pathway analysis

leaf

Cell-cell communication analysis

leaf

Single-cell gene regulatory network inference analysis

leaf

Somatic mutation of malignant transformation related genes

leaf

Related drugs of malignant transformation related genes

Gene: EIF3L

Gene summary for EIF3L

check button Gene summary.

Gene informationSpeciesHuman
Gene symbol

EIF3L

Gene ID

51386

Gene nameeukaryotic translation initiation factor 3 subunit L
Gene AliasEIF3EIP
Cytomap22q13.1
Gene Typeprotein-coding
GO ID

GO:0001732

UniProtAcc

Q9Y262


Top

Malignant transformation analysis

check button Identification of the aberrant gene expression in precancerous and cancerous lesions by comparing the gene expression of stem-like cells in diseased tissues with normal stem cells
check button Malignant transformation involving gene list.
Entrez IDSymbolReplicatesSpeciesOrganTissueAdj P-valueLog2FCMalignancy
51386EIF3LGSM4909286HumanBreastIDC4.31e-316.07e-010.1081
51386EIF3LGSM4909287HumanBreastIDC2.05e-07-4.21e-010.2057
51386EIF3LGSM4909291HumanBreastIDC2.21e-06-4.81e-010.1753
51386EIF3LGSM4909293HumanBreastIDC6.42e-18-3.62e-010.1581
51386EIF3LGSM4909294HumanBreastIDC8.35e-16-4.26e-010.2022
51386EIF3LGSM4909296HumanBreastIDC3.56e-20-5.07e-010.1524
51386EIF3LGSM4909297HumanBreastIDC3.38e-23-2.47e-010.1517
51386EIF3LGSM4909301HumanBreastIDC1.29e-35-6.91e-010.1577
51386EIF3LGSM4909302HumanBreastIDC1.62e-12-5.08e-010.1545
51386EIF3LGSM4909304HumanBreastIDC3.30e-07-2.70e-010.1636
51386EIF3LGSM4909305HumanBreastIDC2.67e-022.94e-010.0436
51386EIF3LGSM4909307HumanBreastIDC3.69e-17-5.10e-010.1569
51386EIF3LGSM4909308HumanBreastIDC2.92e-05-2.78e-010.158
51386EIF3LGSM4909309HumanBreastIDC1.21e-12-5.28e-010.0483
51386EIF3LGSM4909311HumanBreastIDC6.17e-48-5.25e-010.1534
51386EIF3LGSM4909312HumanBreastIDC3.60e-181.49e-010.1552
51386EIF3LGSM4909313HumanBreastIDC4.53e-03-1.97e-020.0391
51386EIF3LGSM4909315HumanBreastIDC3.13e-08-3.70e-010.21
51386EIF3LGSM4909316HumanBreastIDC5.82e-03-4.42e-010.21
51386EIF3LGSM4909317HumanBreastIDC1.20e-03-3.33e-010.1355
Page: 1 2 3 4 5 6 7 8 9 10 11 12 13 14 

check button Transcriptomic changes along malignancy continuum.
TissueExpression DynamicsAbbreviation
BreastThe image shows the transcriptomic changes along malignancy continuum.log2FC in expression of this searched gene in stem-like cells from each diseased tissue sample relative to stem-like cells in normal samples in each tissue plotted against the malignancy continuum. Samples are colored based on if they are from different disease stage.IDC: Invasive ductal carcinoma
DCIS: Ductal carcinoma in situ
Precancer(BRCA1-mut): Precancerous lesion from BRCA1 mutation carriers
CervixThe image shows the transcriptomic changes along malignancy continuum.log2FC in expression of this searched gene in stem-like cells from each diseased tissue sample relative to stem-like cells in normal samples in each tissue plotted against the malignancy continuum. Samples are colored based on if they are from different disease stage.CC: Cervix cancer
HSIL_HPV: HPV-infected high-grade squamous intraepithelial lesions
N_HPV: HPV-infected normal cervix
EndometriumThe image shows the transcriptomic changes along malignancy continuum.log2FC in expression of this searched gene in stem-like cells from each diseased tissue sample relative to stem-like cells in normal samples in each tissue plotted against the malignancy continuum. Samples are colored based on if they are from different disease stage.
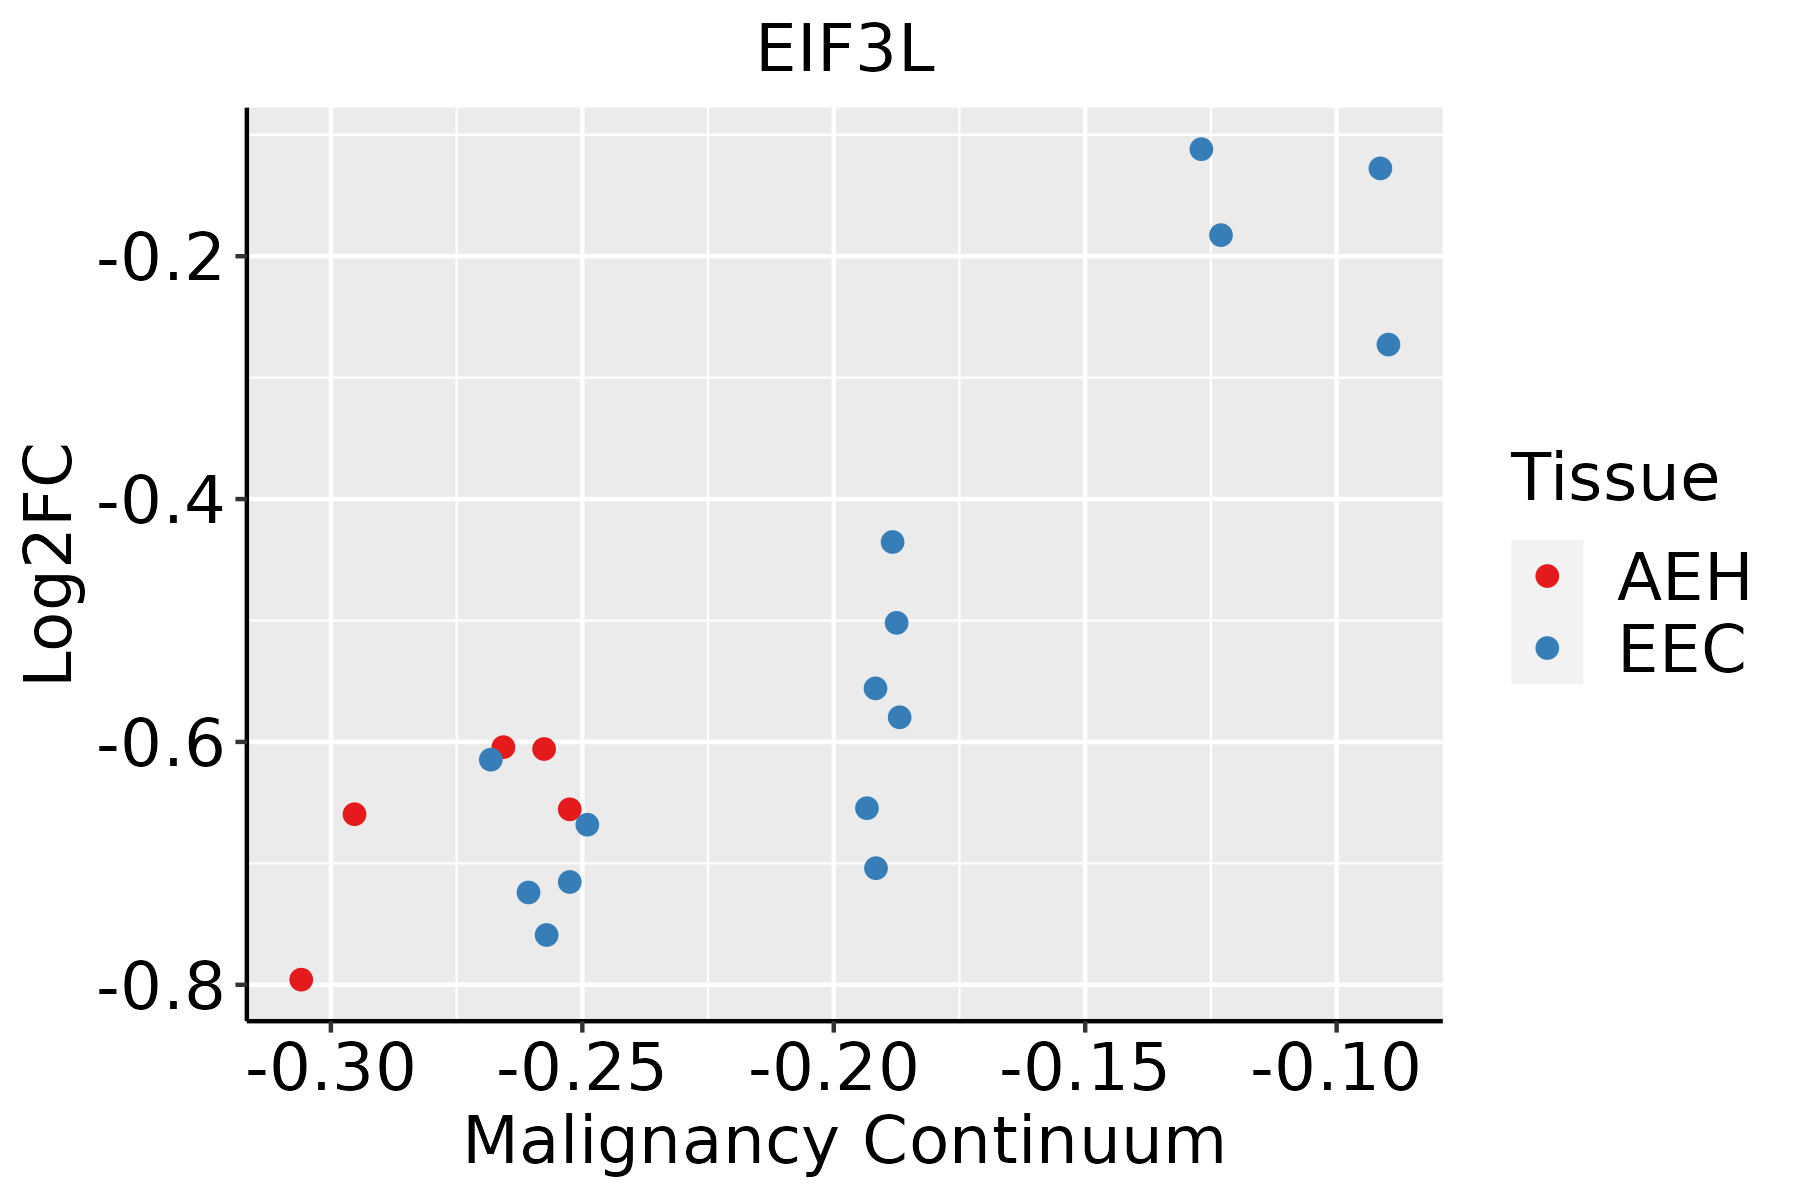
AEH: Atypical endometrial hyperplasia
EEC: Endometrioid Cancer
EsophagusThe image shows the transcriptomic changes along malignancy continuum.log2FC in expression of this searched gene in stem-like cells from each diseased tissue sample relative to stem-like cells in normal samples in each tissue plotted against the malignancy continuum. Samples are colored based on if they are from different disease stage.
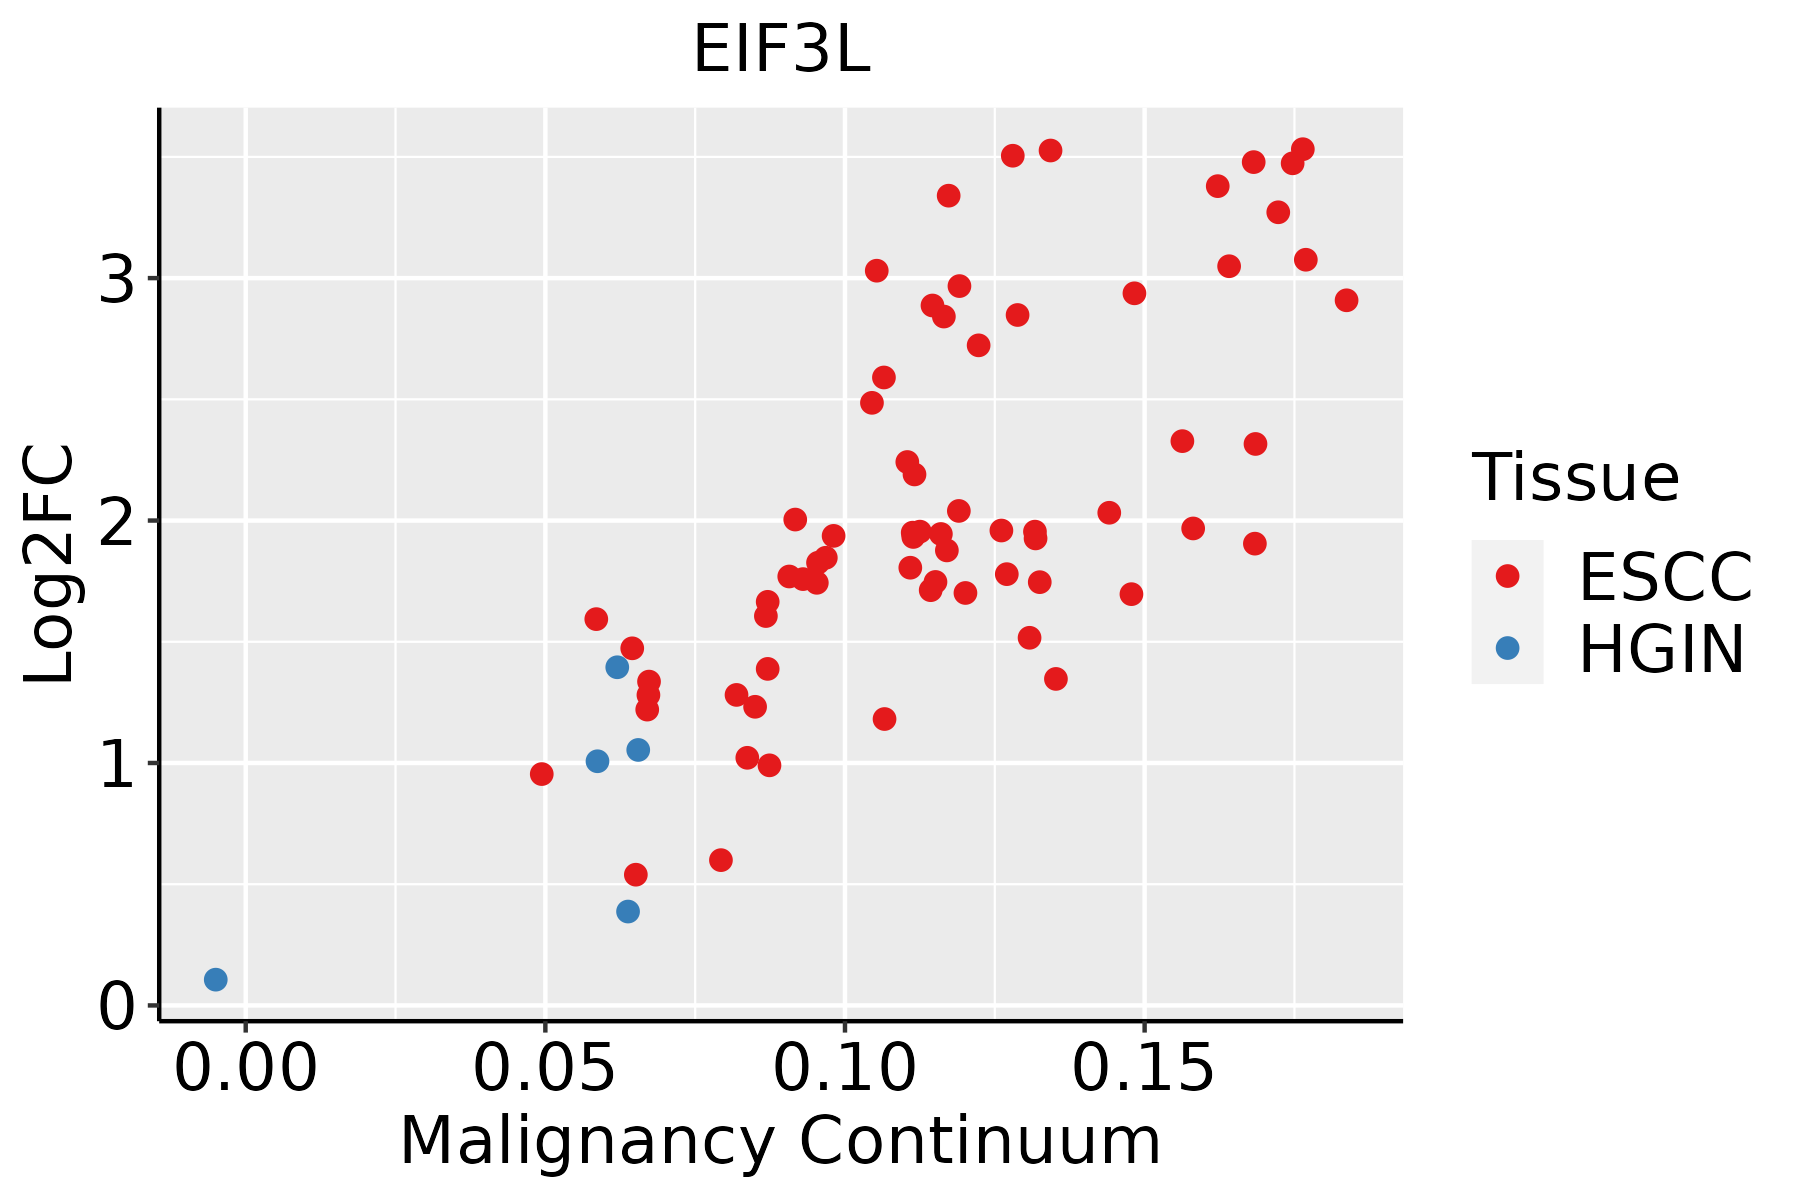
ESCC: Esophageal squamous cell carcinoma
HGIN: High-grade intraepithelial neoplasias
LGIN: Low-grade intraepithelial neoplasias
GCThe image shows the transcriptomic changes along malignancy continuum.log2FC in expression of this searched gene in stem-like cells from each diseased tissue sample relative to stem-like cells in normal samples in each tissue plotted against the malignancy continuum. Samples are colored based on if they are from different disease stage.CAG: Chronic atrophic gastritis
CAG with IM: Chronic atrophic gastritis with intestinal metaplasia
CSG: Chronic superficial gastritis
GC: Gastric cancer
SIM: Severe intestinal metaplasia
WIM: Wild intestinal metaplasia
LiverThe image shows the transcriptomic changes along malignancy continuum.log2FC in expression of this searched gene in stem-like cells from each diseased tissue sample relative to stem-like cells in normal samples in each tissue plotted against the malignancy continuum. Samples are colored based on if they are from different disease stage.
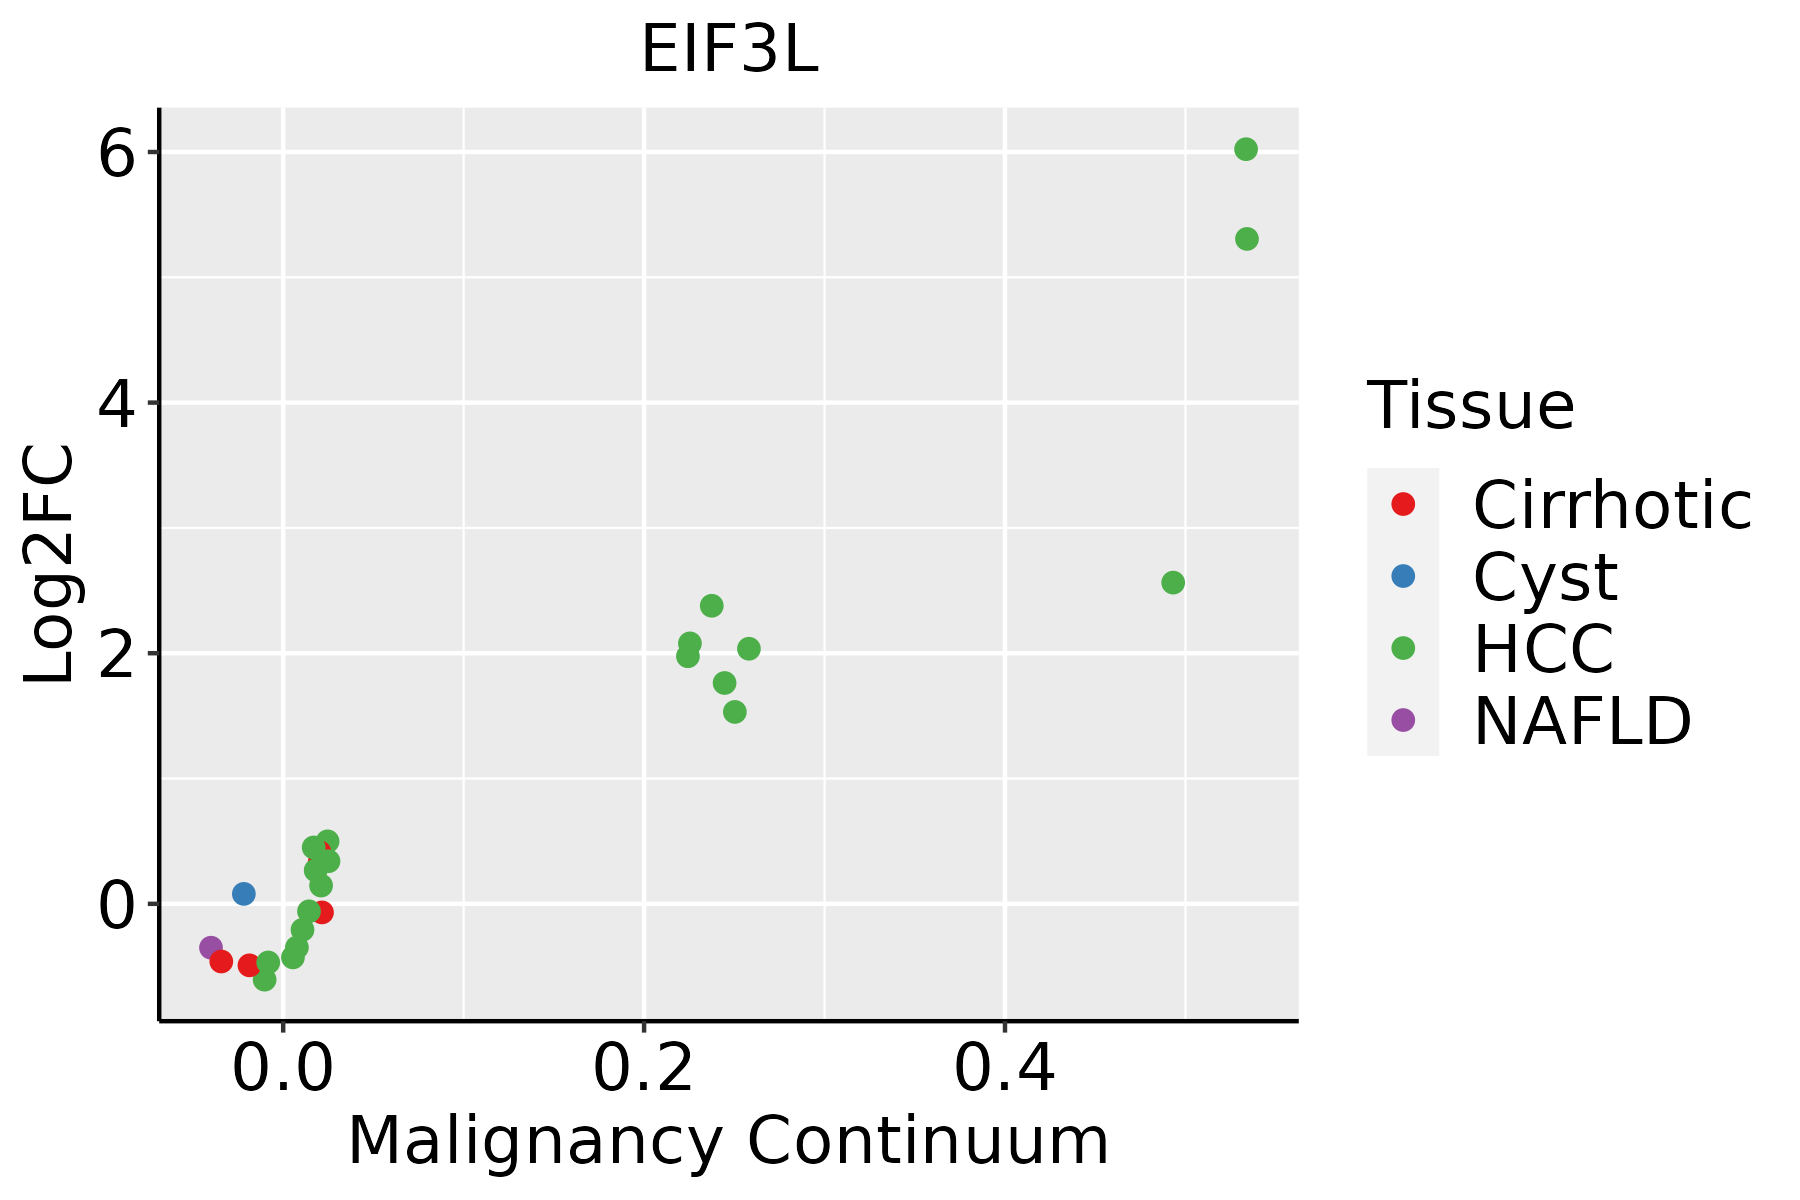
HCC: Hepatocellular carcinoma
NAFLD: Non-alcoholic fatty liver disease
Oral CavityThe image shows the transcriptomic changes along malignancy continuum.log2FC in expression of this searched gene in stem-like cells from each diseased tissue sample relative to stem-like cells in normal samples in each tissue plotted against the malignancy continuum. Samples are colored based on if they are from different disease stage.
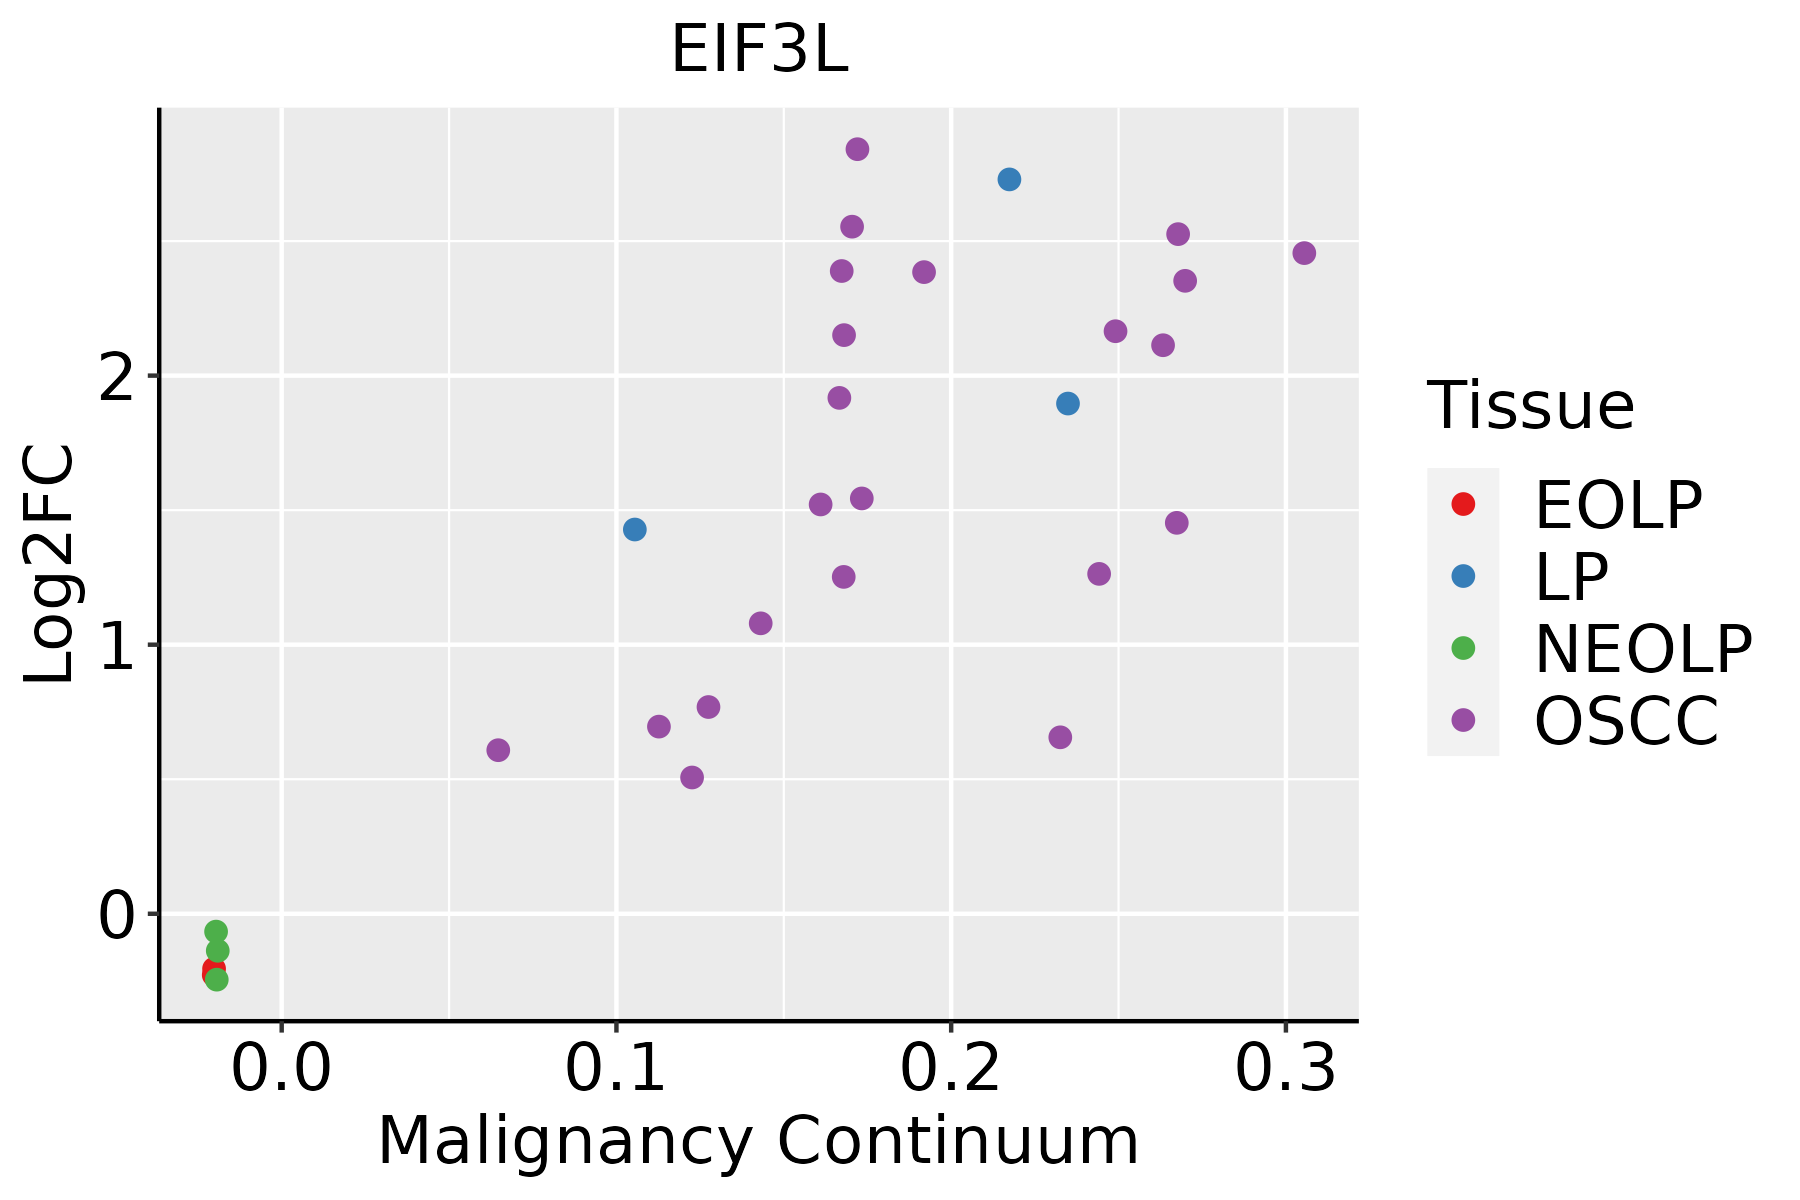
EOLP: Erosive Oral lichen planus
LP: leukoplakia
NEOLP: Non-erosive oral lichen planus
OSCC: Oral squamous cell carcinoma
ProstateThe image shows the transcriptomic changes along malignancy continuum.log2FC in expression of this searched gene in stem-like cells from each diseased tissue sample relative to stem-like cells in normal samples in each tissue plotted against the malignancy continuum. Samples are colored based on if they are from different disease stage.
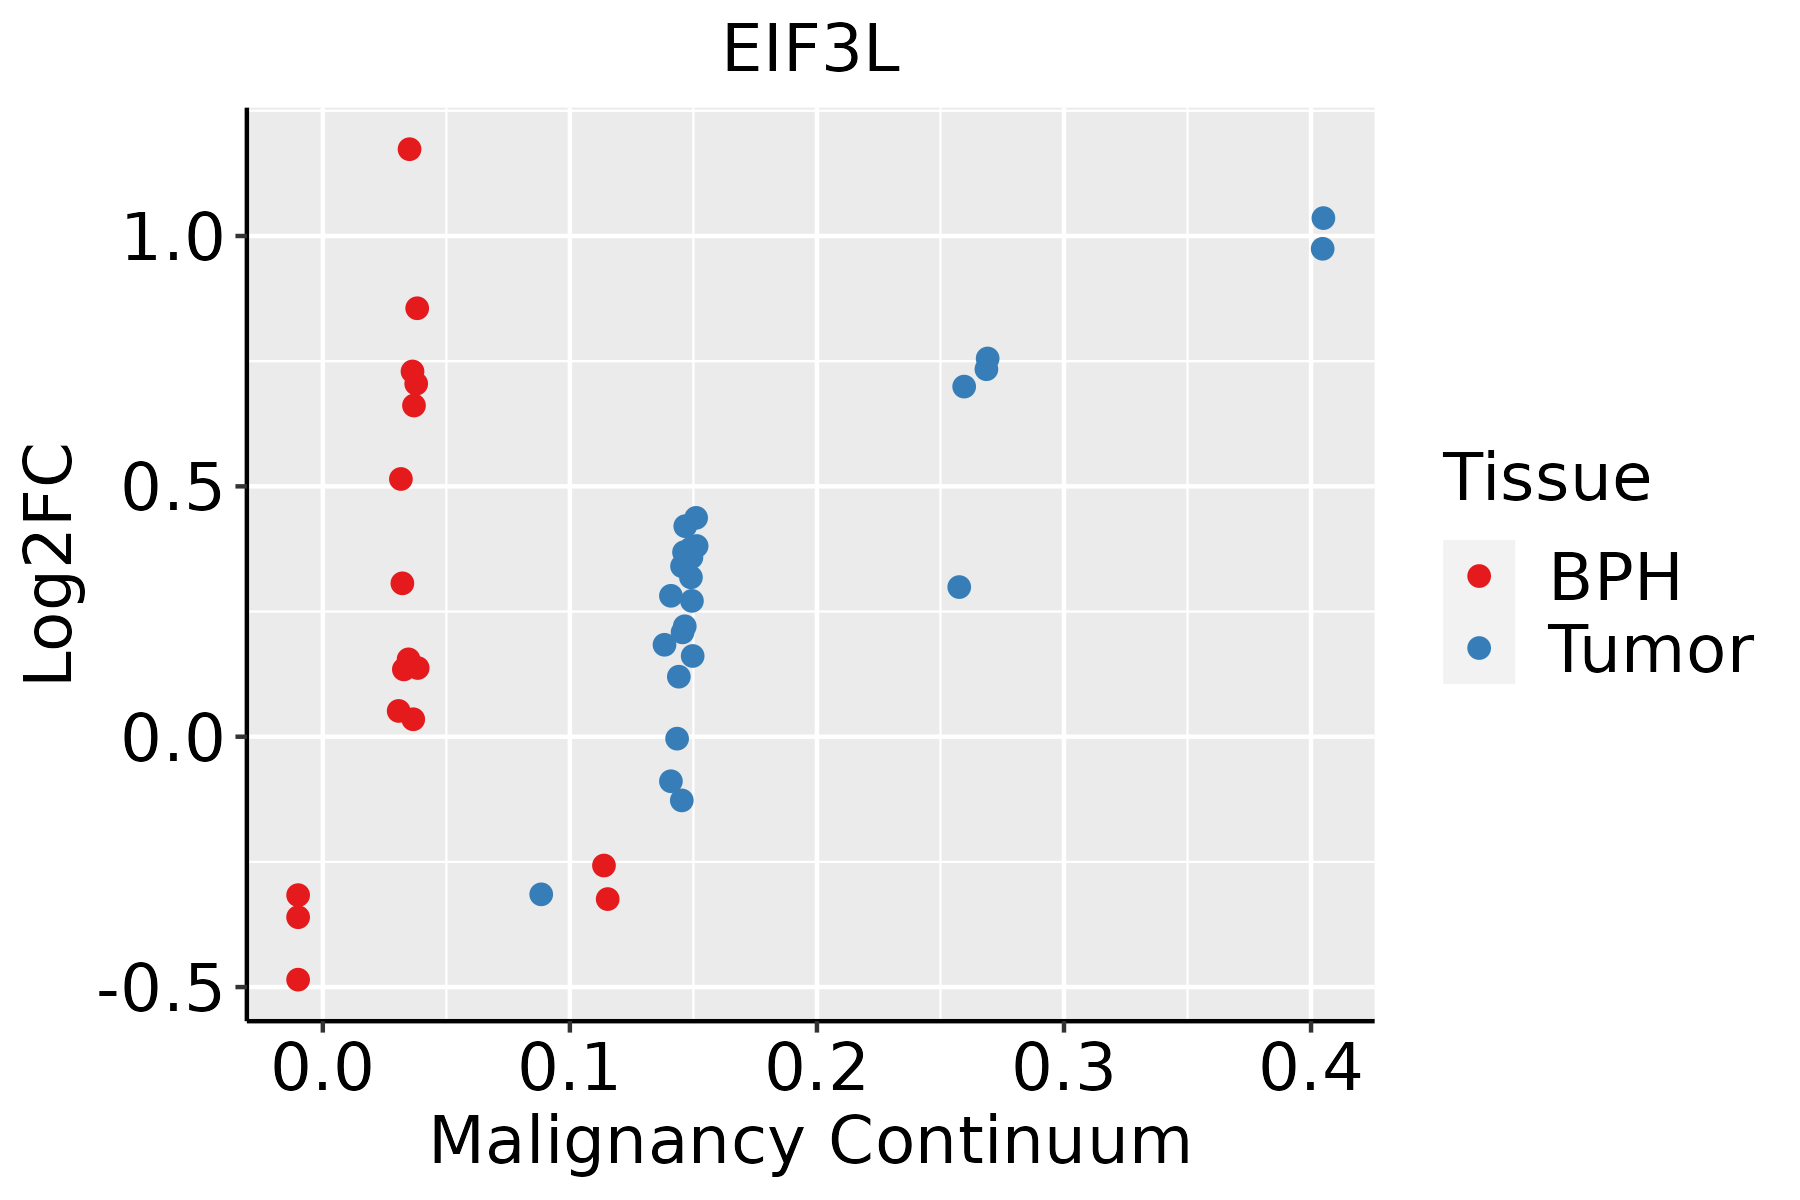
BPH: Benign Prostatic Hyperplasia
SkinThe image shows the transcriptomic changes along malignancy continuum.log2FC in expression of this searched gene in stem-like cells from each diseased tissue sample relative to stem-like cells in normal samples in each tissue plotted against the malignancy continuum. Samples are colored based on if they are from different disease stage.AK: Actinic keratosis
cSCC: Cutaneous squamous cell carcinoma
SCCIS:squamous cell carcinoma in situ
ThyroidThe image shows the transcriptomic changes along malignancy continuum.log2FC in expression of this searched gene in stem-like cells from each diseased tissue sample relative to stem-like cells in normal samples in each tissue plotted against the malignancy continuum. Samples are colored based on if they are from different disease stage.
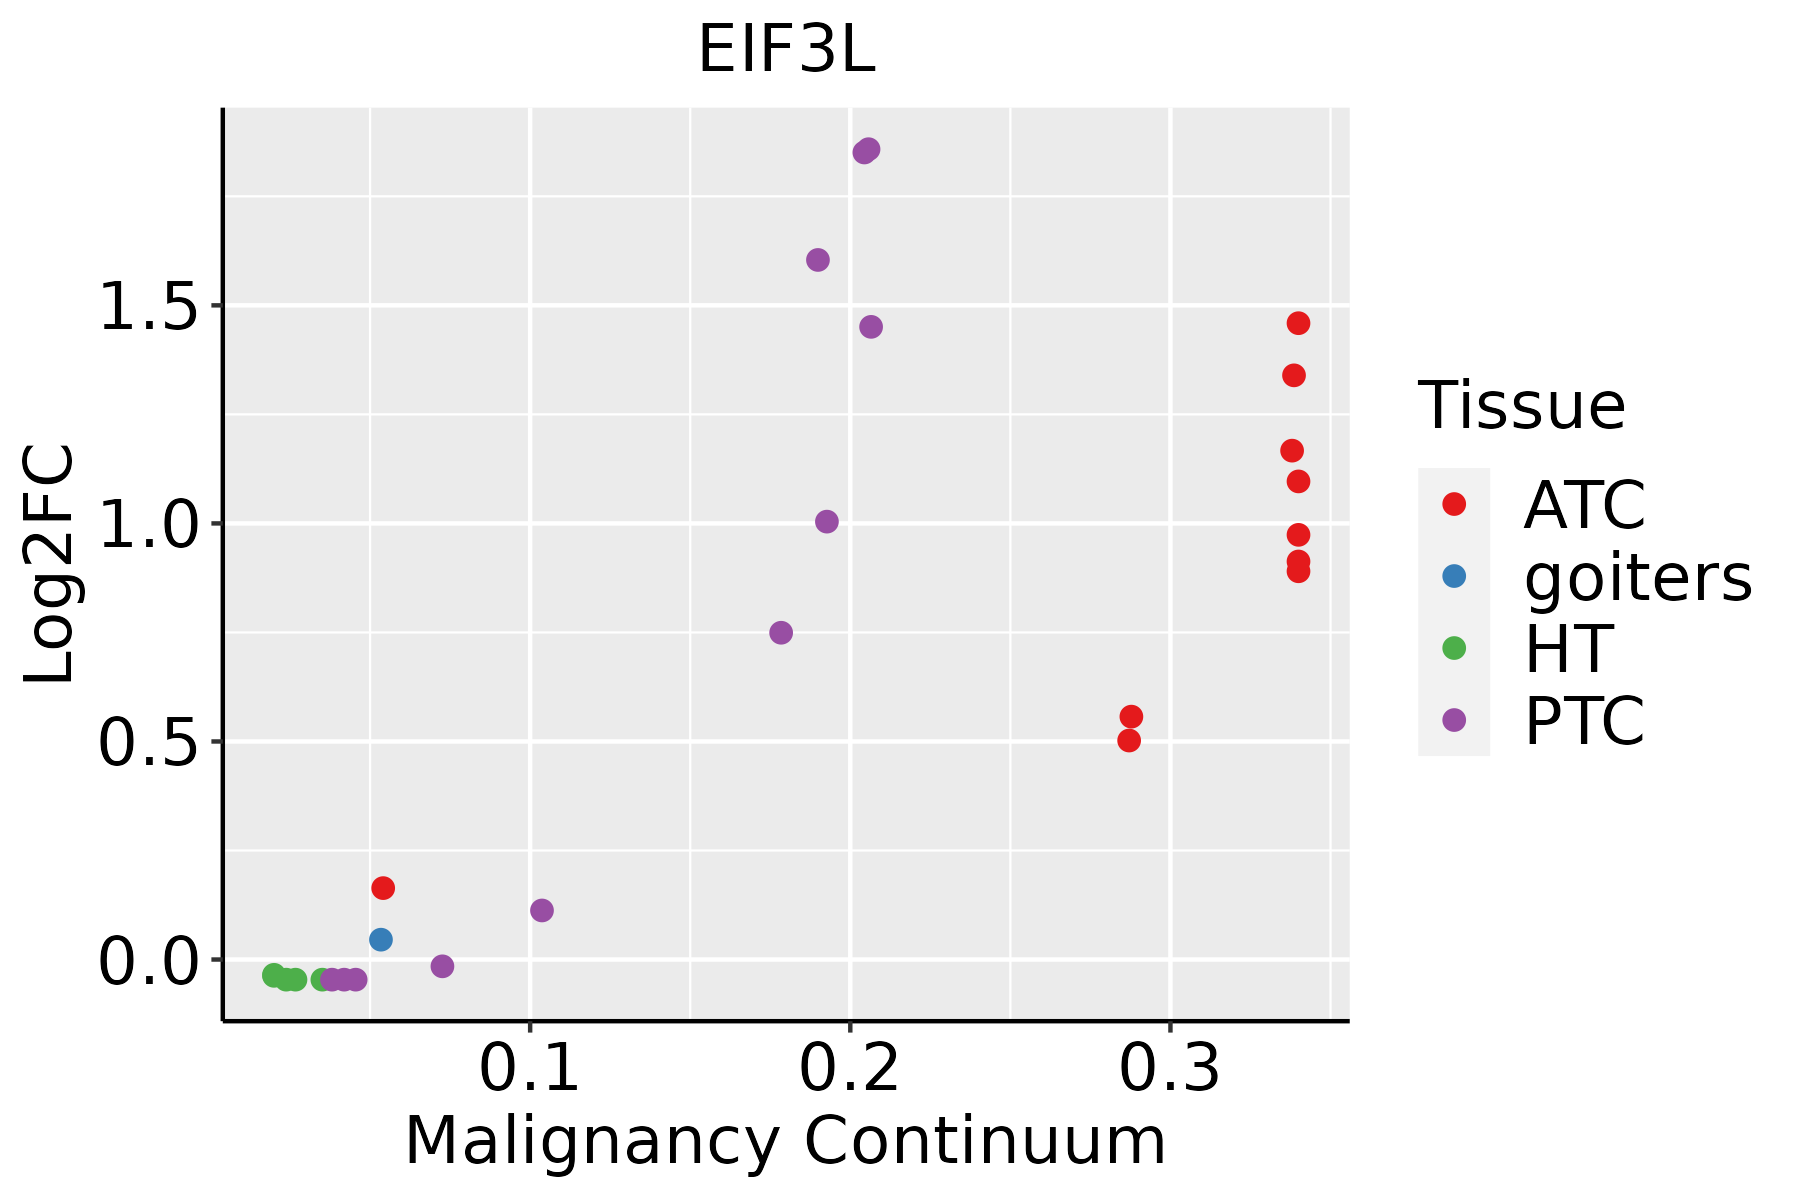
ATC: Anaplastic thyroid cancer
HT: Hashimoto's thyroiditis
PTC: Papillary thyroid cancer
∗log2FC in expression of this searched gene in stem-like cells from each diseased tissue sample relative to stem-like cells in normal samples in each tissue plotted against the malignancy continuum. Samples are colored based on if they are from different disease stage.

Top

Malignant transformation related pathway analysis

check buttonFind out the enriched GO biological processes and KEGG pathways involved in transition from healthy to precancer to cancer
check button Figure of enriched GO biological processes.
TissueDisease StageEnriched GO biological Processes
ColorectumADGO analysis - Figure of enriched GO biological processes: Top 15 enriched GO BP terms are showed in the bar plot of each disease state in each tissue. Each row represents a significant GO biological process which is colored according to the -log10(p.adjust).
ColorectumSERGO analysis - Figure of enriched GO biological processes: Top 15 enriched GO BP terms are showed in the bar plot of each disease state in each tissue. Each row represents a significant GO biological process which is colored according to the -log10(p.adjust).
ColorectumMSSGO analysis - Figure of enriched GO biological processes: Top 15 enriched GO BP terms are showed in the bar plot of each disease state in each tissue. Each row represents a significant GO biological process which is colored according to the -log10(p.adjust).
ColorectumMSI-HGO analysis - Figure of enriched GO biological processes: Top 15 enriched GO BP terms are showed in the bar plot of each disease state in each tissue. Each row represents a significant GO biological process which is colored according to the -log10(p.adjust).
ColorectumFAPGO analysis - Figure of enriched GO biological processes: Top 15 enriched GO BP terms are showed in the bar plot of each disease state in each tissue. Each row represents a significant GO biological process which is colored according to the -log10(p.adjust).
∗Top 15 enriched GO BP terms are showed in the bar plot of each disease state in each tissue. Each row represents a significant GO biological process which is colored according to the -log10(p.adjust).
Page: 1 2 3 4 5 6 7 8 9 

check button Enriched GO biological processes.
GO IDTissueDisease StageDescriptionGene RatioBg Ratiopvaluep.adjustCount
GO:00021819BreastPrecancercytoplasmic translation80/1080148/187231.59e-598.54e-5680
GO:00226139BreastPrecancerribonucleoprotein complex biogenesis79/1080463/187232.11e-181.03e-1579
GO:00718269BreastPrecancerribonucleoprotein complex subunit organization48/1080227/187232.68e-158.45e-1348
GO:00226189BreastPrecancerribonucleoprotein complex assembly47/1080220/187233.47e-151.03e-1247
GO:00064138BreastPrecancertranslational initiation30/1080118/187233.23e-125.58e-1030
GO:00160329BreastPrecancerviral process58/1080415/187233.42e-103.16e-0858
GO:00021838BreastPrecancercytoplasmic translational initiation11/108034/187231.87e-066.63e-0511
GO:00017328BreastPrecancerformation of cytoplasmic translation initiation complex7/108016/187231.50e-053.71e-047
GO:000218114BreastIDCcytoplasmic translation82/1434148/187232.60e-521.48e-4882
GO:002261314BreastIDCribonucleoprotein complex biogenesis83/1434463/187232.01e-135.20e-1183
GO:007182614BreastIDCribonucleoprotein complex subunit organization52/1434227/187235.18e-131.21e-1052
GO:002261814BreastIDCribonucleoprotein complex assembly51/1434220/187235.32e-131.21e-1051
GO:001603214BreastIDCviral process75/1434415/187231.98e-124.02e-1075
GO:000641313BreastIDCtranslational initiation31/1434118/187237.29e-107.52e-0831
GO:000218313BreastIDCcytoplasmic translational initiation12/143434/187234.35e-061.53e-0412
GO:000173213BreastIDCformation of cytoplasmic translation initiation complex8/143416/187238.56e-062.47e-048
GO:000218124BreastDCIScytoplasmic translation82/1390148/187232.21e-531.25e-4982
GO:002261324BreastDCISribonucleoprotein complex biogenesis83/1390463/187233.65e-141.09e-1183
GO:007182624BreastDCISribonucleoprotein complex subunit organization52/1390227/187231.54e-133.95e-1152
GO:002261824BreastDCISribonucleoprotein complex assembly51/1390220/187231.60e-133.95e-1151
Page: 1 2 3 4 5 6 7 8 9 10 11 12 13 

check button Enriched KEGG pathways.
Pathway IDTissueDisease StageDescriptionGene RatioBg Ratiopvaluep.adjustqvalueCount
Page: 1 

Top

Cell-cell communication analysis

check buttonIdentification of potential cell-cell interactions between two cell types and their ligand-receptor pairs for different disease states
LigandReceptorLRpairPathwayTissueDisease Stage
Page: 1 

Top

Single-cell gene regulatory network inference analysis

check buttonFind out the significant the regulons (TFs) and the target genes of each regulon across cell types for different disease states
TFCell TypeTissueDisease StageTarget GeneRSSRegulon Activity
∗The dot plots of a searched regulon are shown for all cell subpopulations in each disease state of each tissue based on the regulon specific score inferred using pySCENIC and by calculating the average expression.
Page: 1 

Top

Somatic mutation of malignant transformation related genes

check buttonAnnotation of somatic variants for genes involved in malignant transformation
Hugo SymbolVariant ClassVariant ClassificationdbSNP RSHGVScHGVSpHGVSp ShortSWISSPROTBIOTYPESIFTPolyPhenTumor Sample BarcodeTissueHistologySexAgeStageTherapy TypesDrugsOutcome
EIF3LSNVMissense_Mutationc.136N>Gp.Gln46Glup.Q46EQ9Y262protein_codingtolerated(0.87)benign(0.009)TCGA-AC-A23H-01Breastbreast invasive carcinomaFemale>=65I/IIUnknownUnknownPD
EIF3LSNVMissense_Mutationnovelc.502N>Tp.Leu168Phep.L168FQ9Y262protein_codingdeleterious(0.02)probably_damaging(0.995)TCGA-BH-A0HF-01Breastbreast invasive carcinomaFemale>=65I/IIHormone TherapyarimidexSD
EIF3LSNVMissense_Mutationrs201577615c.1591N>Ap.Ala531Thrp.A531TQ9Y262protein_codingtolerated(0.06)possibly_damaging(0.782)TCGA-BH-A18G-01Breastbreast invasive carcinomaFemale>=65I/IIUnknownUnknownSD
EIF3LSNVMissense_Mutationrs767371369c.646N>Tp.Arg216Cysp.R216CQ9Y262protein_codingtolerated(0.14)benign(0.067)TCGA-C8-A12Q-01Breastbreast invasive carcinomaFemale>=65III/IVUnknownUnknownPD
EIF3LinsertionFrame_Shift_Insnovelc.689_690insAp.Leu231ProfsTer22p.L231Pfs*22Q9Y262protein_codingTCGA-A7-A0CJ-01Breastbreast invasive carcinomaFemale<65I/IIChemotherapycytoxanSD
EIF3LinsertionIn_Frame_Insnovelc.691_692insGCACCCGGCCTGTTTTTGTATTTTTAGTAGAGATGGGGTp.Leu231delinsArgThrArgProValPheValPheLeuValGluMetGlyPhep.L231delinsRTRPVFVFLVEMGFQ9Y262protein_codingTCGA-A7-A0CJ-01Breastbreast invasive carcinomaFemale<65I/IIChemotherapycytoxanSD
EIF3LdeletionIn_Frame_Delc.1203_1205delNNNp.Gln402delp.Q402delQ9Y262protein_codingTCGA-D8-A27N-01Breastbreast invasive carcinomaFemale<65III/IVChemotherapytaxol+adriamycin+cyclophosphamide+herceptinSD
EIF3LSNVMissense_Mutationnovelc.1400N>Gp.Tyr467Cysp.Y467CQ9Y262protein_codingdeleterious(0)probably_damaging(1)TCGA-2W-A8YY-01Cervixcervical & endocervical cancerFemale<65I/IIChemotherapycisplatinCR
EIF3LSNVMissense_Mutationc.565G>Ap.Glu189Lysp.E189KQ9Y262protein_codingdeleterious(0)probably_damaging(1)TCGA-IR-A3LH-01Cervixcervical & endocervical cancerFemale<65I/IIChemotherapycisplatinCR
EIF3LSNVMissense_Mutationrs760820592c.892N>Ap.Glu298Lysp.E298KQ9Y262protein_codingdeleterious(0.03)possibly_damaging(0.636)TCGA-AA-3977-01Colorectumcolon adenocarcinomaMale>=65I/IIUnknownUnknownSD
Page: 1 2 3 4 

Top

Related drugs of malignant transformation related genes

check buttonIdentification of chemicals and drugs interact with genes involved in malignant transfromation
(DGIdb 4.0)
Entrez IDSymbolCategoryInteraction TypesDrug Claim NameDrug NamePMIDs
Page: 1