| Tissue | Expression Dynamics | Abbreviation |
| Cervix | 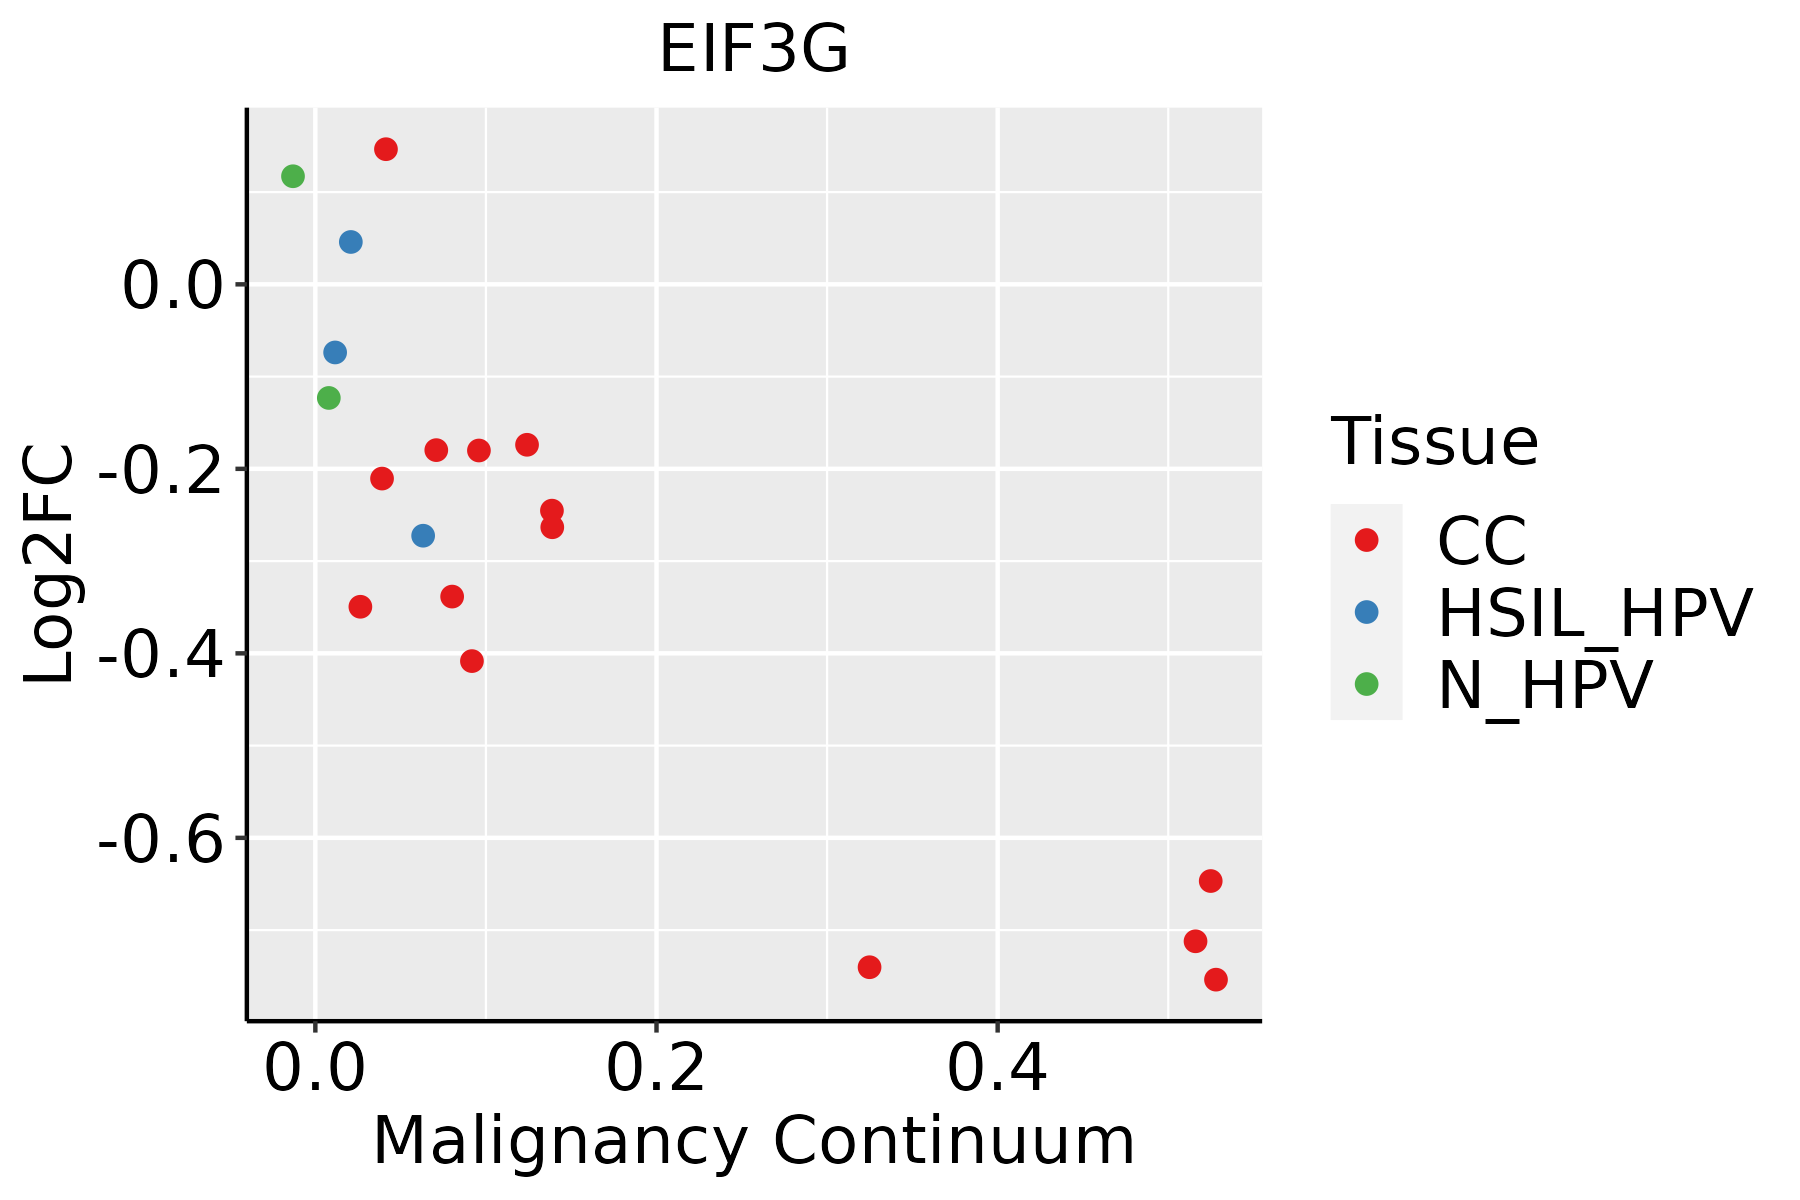 | CC: Cervix cancer |
| HSIL_HPV: HPV-infected high-grade squamous intraepithelial lesions |
| N_HPV: HPV-infected normal cervix |
| Colorectum (GSE201348) |  | FAP: Familial adenomatous polyposis |
| CRC: Colorectal cancer |
| Colorectum (HTA11) |  | AD: Adenomas |
| SER: Sessile serrated lesions |
| MSI-H: Microsatellite-high colorectal cancer |
| MSS: Microsatellite stable colorectal cancer |
| Endometrium | 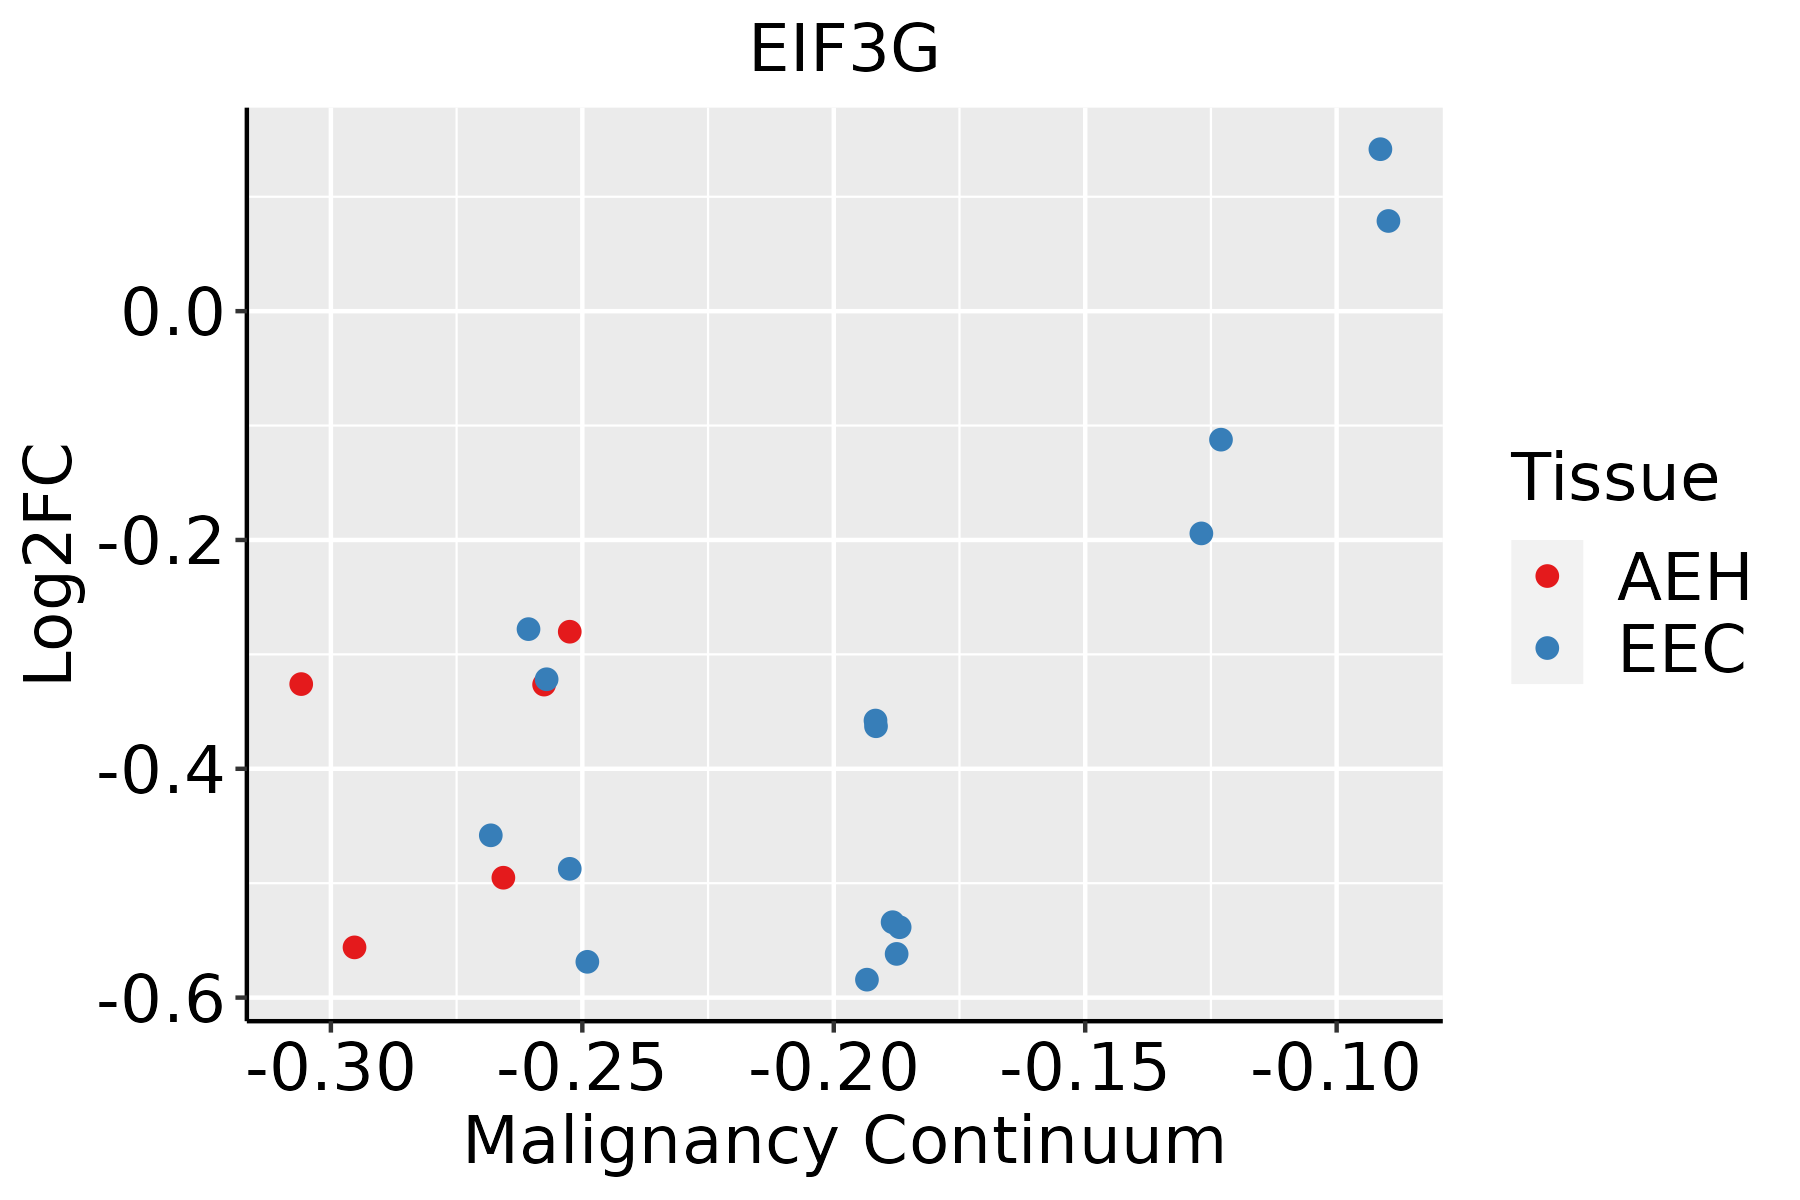 | AEH: Atypical endometrial hyperplasia |
| EEC: Endometrioid Cancer |
| Esophagus | 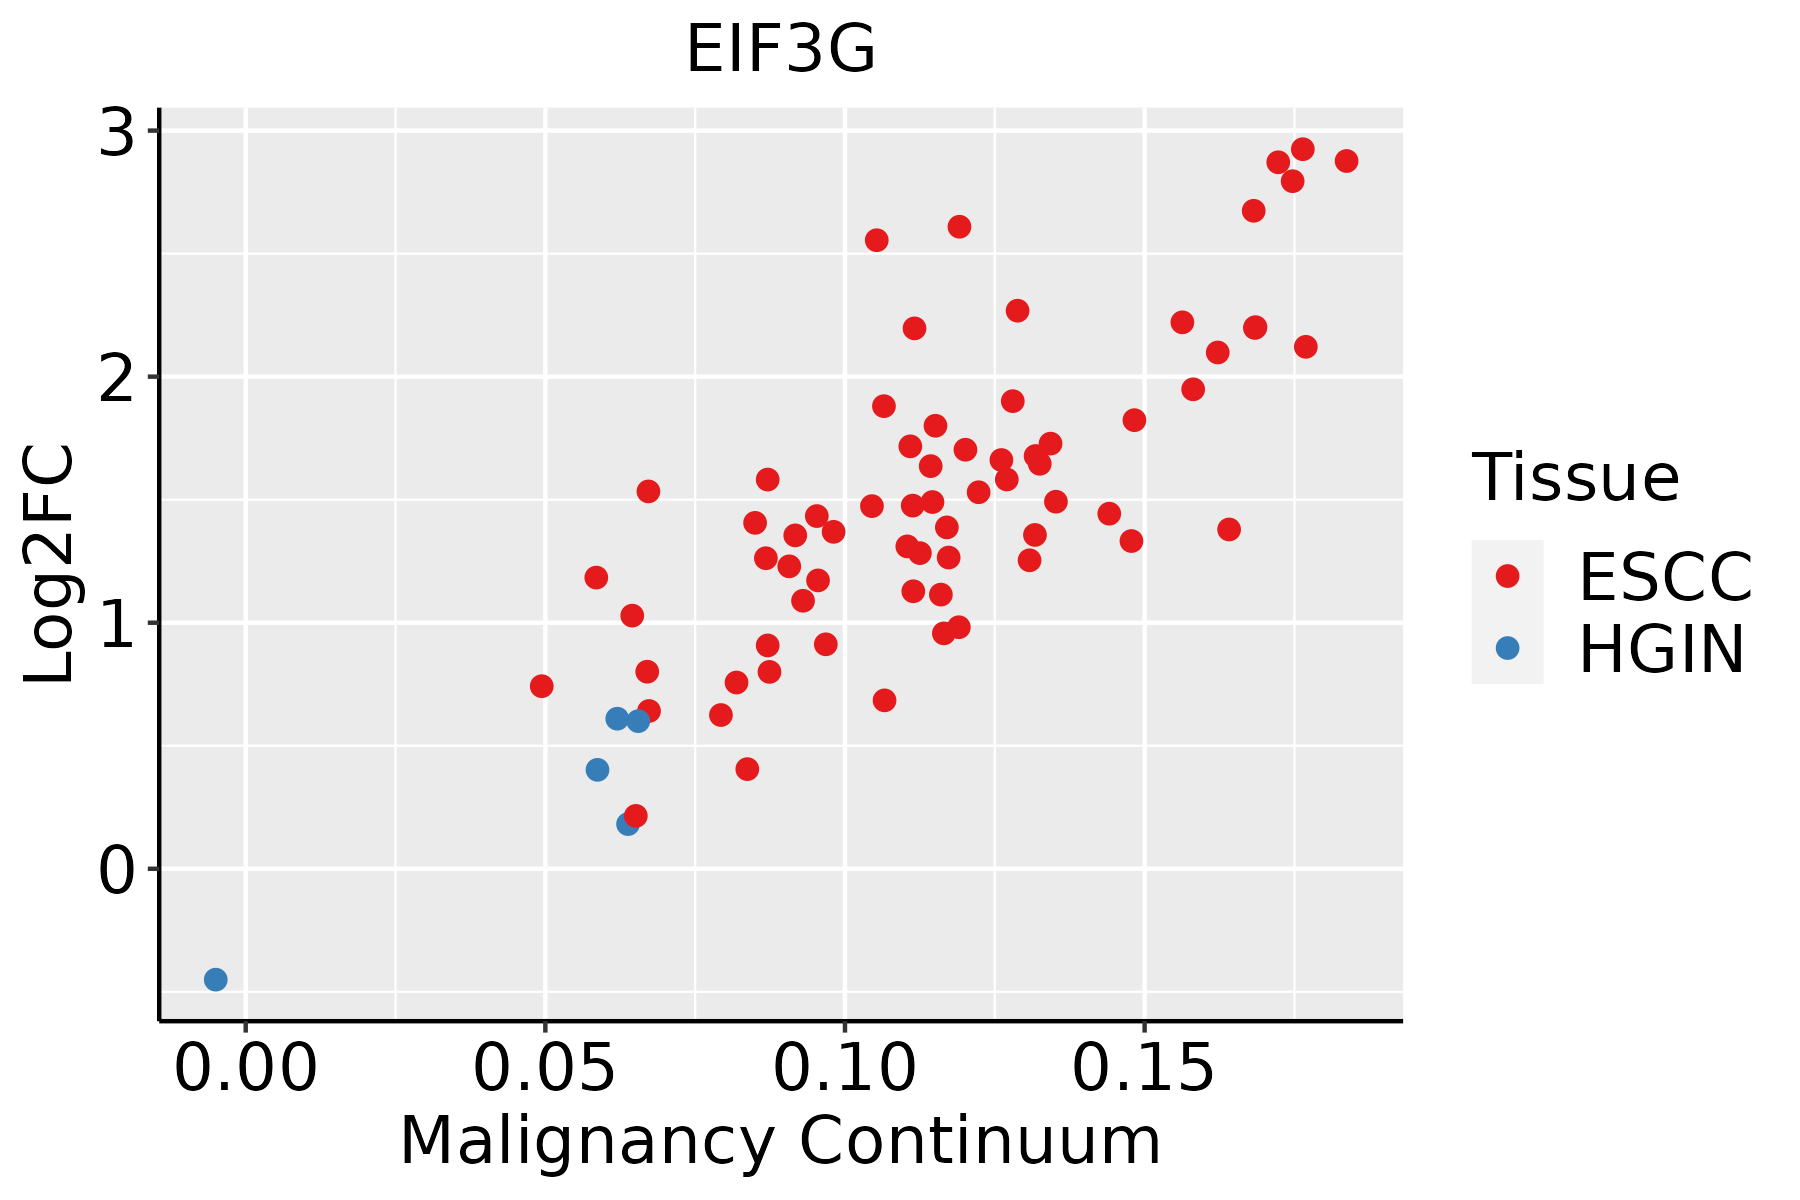 | ESCC: Esophageal squamous cell carcinoma |
| HGIN: High-grade intraepithelial neoplasias |
| LGIN: Low-grade intraepithelial neoplasias |
| Liver | 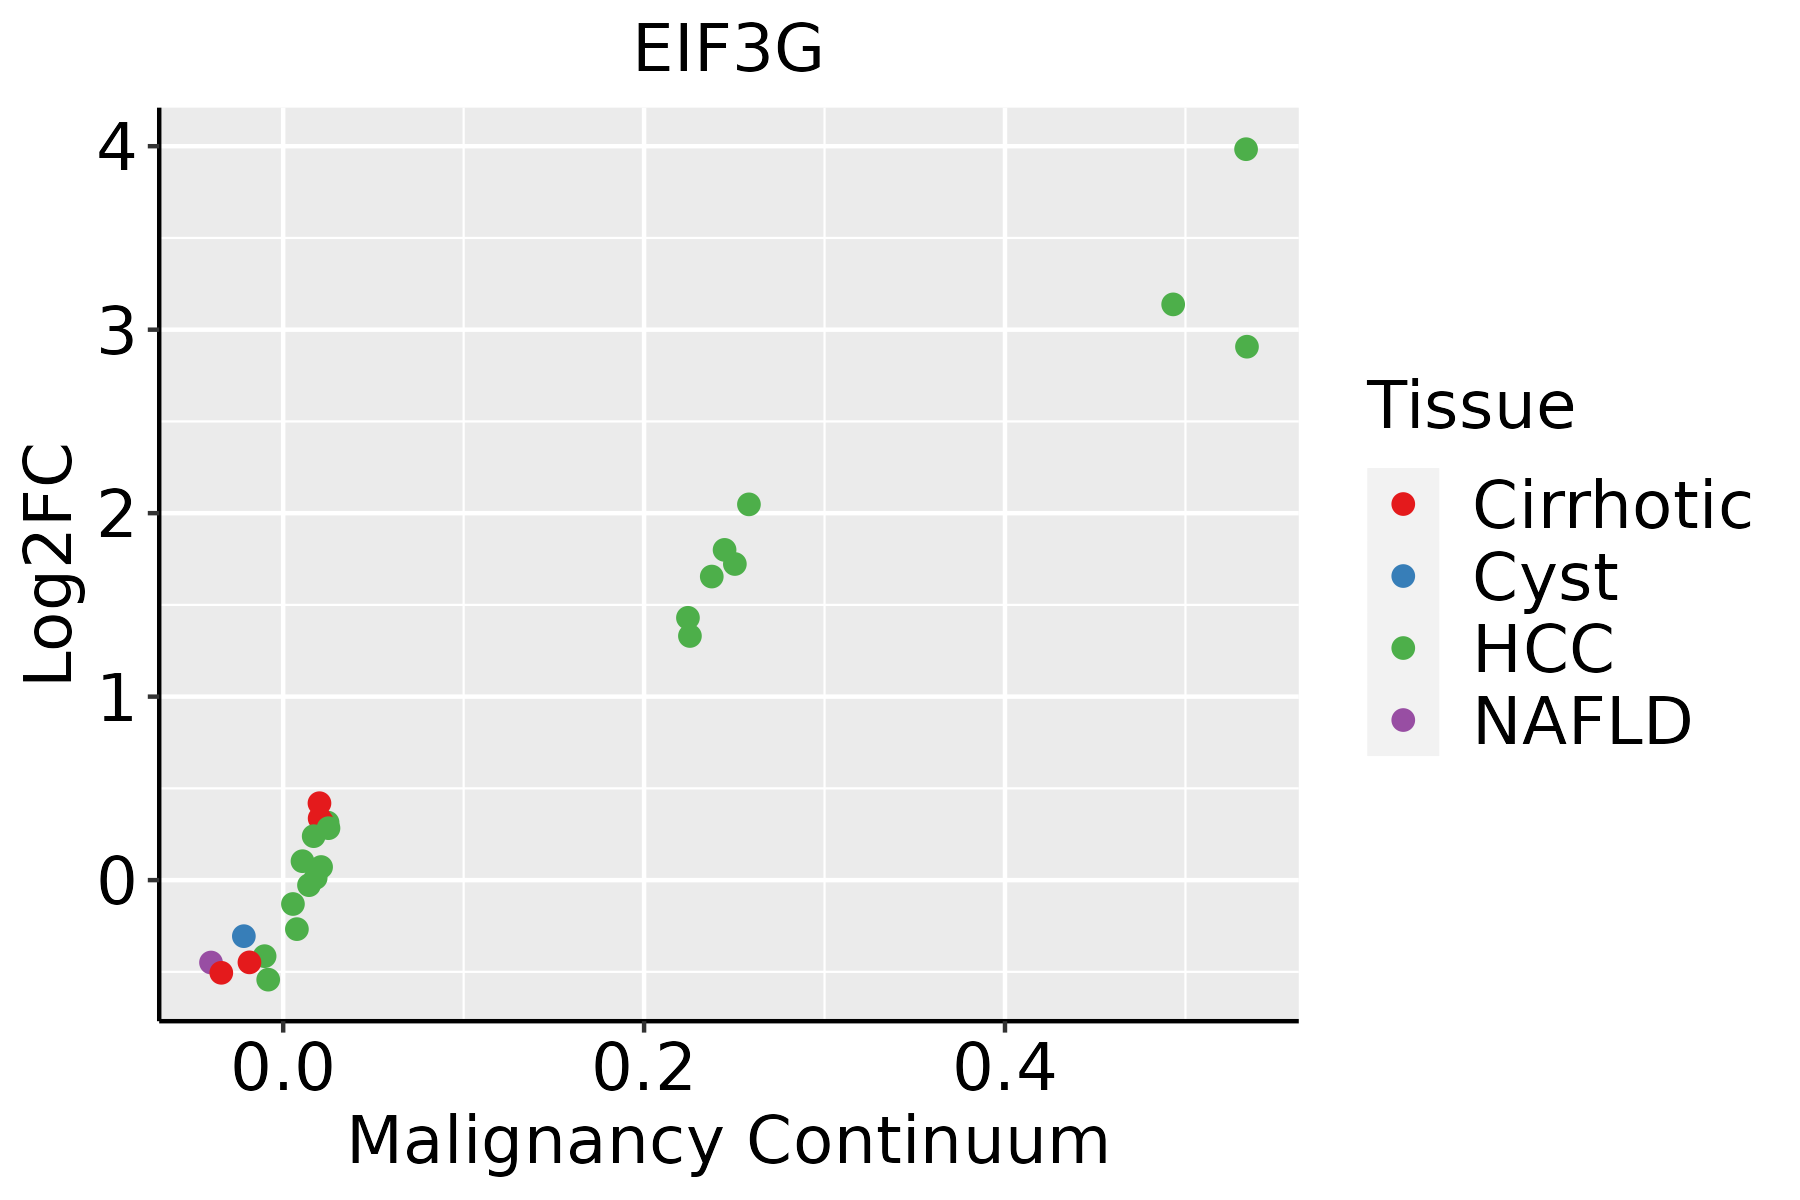 | HCC: Hepatocellular carcinoma |
| NAFLD: Non-alcoholic fatty liver disease |
| Oral Cavity |  | EOLP: Erosive Oral lichen planus |
| LP: leukoplakia |
| NEOLP: Non-erosive oral lichen planus |
| OSCC: Oral squamous cell carcinoma |
| Prostate |  | BPH: Benign Prostatic Hyperplasia |
| Skin |  | AK: Actinic keratosis |
| cSCC: Cutaneous squamous cell carcinoma |
| SCCIS:squamous cell carcinoma in situ |
| Thyroid |  | ATC: Anaplastic thyroid cancer |
| HT: Hashimoto's thyroiditis |
| PTC: Papillary thyroid cancer |
| GO ID | Tissue | Disease Stage | Description | Gene Ratio | Bg Ratio | pvalue | p.adjust | Count |
| GO:000218110 | Cervix | CC | cytoplasmic translation | 96/2311 | 148/18723 | 4.87e-51 | 2.91e-47 | 96 |
| GO:001603210 | Cervix | CC | viral process | 109/2311 | 415/18723 | 5.40e-15 | 6.46e-12 | 109 |
| GO:002261310 | Cervix | CC | ribonucleoprotein complex biogenesis | 88/2311 | 463/18723 | 2.11e-05 | 3.82e-04 | 88 |
| GO:002261810 | Cervix | CC | ribonucleoprotein complex assembly | 49/2311 | 220/18723 | 2.52e-05 | 4.29e-04 | 49 |
| GO:007182610 | Cervix | CC | ribonucleoprotein complex subunit organization | 49/2311 | 227/18723 | 5.91e-05 | 8.54e-04 | 49 |
| GO:00064139 | Cervix | CC | translational initiation | 25/2311 | 118/18723 | 4.54e-03 | 2.75e-02 | 25 |
| GO:00190807 | Cervix | CC | viral gene expression | 21/2311 | 94/18723 | 4.68e-03 | 2.82e-02 | 21 |
| GO:00021839 | Cervix | CC | cytoplasmic translational initiation | 10/2311 | 34/18723 | 6.40e-03 | 3.58e-02 | 10 |
| GO:00017329 | Cervix | CC | formation of cytoplasmic translation initiation complex | 6/2311 | 16/18723 | 9.35e-03 | 4.66e-02 | 6 |
| GO:00190817 | Cervix | CC | viral translation | 6/2311 | 16/18723 | 9.35e-03 | 4.66e-02 | 6 |
| GO:000218115 | Cervix | HSIL_HPV | cytoplasmic translation | 86/737 | 148/18723 | 3.97e-82 | 1.91e-78 | 86 |
| GO:002261315 | Cervix | HSIL_HPV | ribonucleoprotein complex biogenesis | 52/737 | 463/18723 | 9.85e-12 | 6.81e-09 | 52 |
| GO:002261815 | Cervix | HSIL_HPV | ribonucleoprotein complex assembly | 29/737 | 220/18723 | 1.19e-08 | 1.30e-06 | 29 |
| GO:007182615 | Cervix | HSIL_HPV | ribonucleoprotein complex subunit organization | 29/737 | 227/18723 | 2.42e-08 | 2.18e-06 | 29 |
| GO:001603215 | Cervix | HSIL_HPV | viral process | 41/737 | 415/18723 | 6.43e-08 | 4.49e-06 | 41 |
| GO:000641314 | Cervix | HSIL_HPV | translational initiation | 16/737 | 118/18723 | 1.56e-05 | 4.80e-04 | 16 |
| GO:000218314 | Cervix | HSIL_HPV | cytoplasmic translational initiation | 8/737 | 34/18723 | 4.06e-05 | 1.08e-03 | 8 |
| GO:000173214 | Cervix | HSIL_HPV | formation of cytoplasmic translation initiation complex | 5/737 | 16/18723 | 2.83e-04 | 4.69e-03 | 5 |
| GO:000218125 | Cervix | N_HPV | cytoplasmic translation | 42/534 | 148/18723 | 2.61e-30 | 1.19e-26 | 42 |
| GO:001603225 | Cervix | N_HPV | viral process | 33/534 | 415/18723 | 1.23e-07 | 1.15e-05 | 33 |
| Hugo Symbol | Variant Class | Variant Classification | dbSNP RS | HGVSc | HGVSp | HGVSp Short | SWISSPROT | BIOTYPE | SIFT | PolyPhen | Tumor Sample Barcode | Tissue | Histology | Sex | Age | Stage | Therapy Types | Drugs | Outcome |
| EIF3G | SNV | Missense_Mutation | | c.133N>T | p.Pro45Ser | p.P45S | O75821 | protein_coding | tolerated(0.35) | possibly_damaging(0.901) | TCGA-C8-A135-01 | Breast | breast invasive carcinoma | Female | <65 | I/II | Chemotherapy | 5-fluorouracil | CR |
| EIF3G | SNV | Missense_Mutation | | c.248N>A | p.Arg83His | p.R83H | O75821 | protein_coding | deleterious(0.05) | probably_damaging(0.98) | TCGA-D8-A1XK-01 | Breast | breast invasive carcinoma | Female | <65 | I/II | Chemotherapy | doxorubicine+cyclophosphamide | SD |
| EIF3G | SNV | Missense_Mutation | rs771861822 | c.23N>T | p.Ser8Leu | p.S8L | O75821 | protein_coding | tolerated(0.39) | benign(0.007) | TCGA-EA-A3HR-01 | Cervix | cervical & endocervical cancer | Female | <65 | I/II | Unknown | Unknown | SD |
| EIF3G | SNV | Missense_Mutation | | c.49N>A | p.Glu17Lys | p.E17K | O75821 | protein_coding | deleterious(0.02) | benign(0.14) | TCGA-EK-A2PM-01 | Cervix | cervical & endocervical cancer | Female | >=65 | I/II | Unknown | Unknown | SD |
| EIF3G | SNV | Missense_Mutation | | c.8N>T | p.Thr3Ile | p.T3I | O75821 | protein_coding | deleterious(0.04) | benign(0.027) | TCGA-AA-3713-01 | Colorectum | colon adenocarcinoma | Male | >=65 | III/IV | Chemotherapy | 5-fluorouracil | PR |
| EIF3G | SNV | Missense_Mutation | rs868284931 | c.715N>A | p.Ala239Thr | p.A239T | O75821 | protein_coding | tolerated(0.25) | probably_damaging(0.945) | TCGA-CK-4951-01 | Colorectum | colon adenocarcinoma | Female | >=65 | I/II | Unknown | Unknown | PD |
| EIF3G | SNV | Missense_Mutation | novel | c.664G>A | p.Ala222Thr | p.A222T | O75821 | protein_coding | deleterious(0.01) | benign(0.154) | TCGA-A5-A0G2-01 | Endometrium | uterine corpus endometrioid carcinoma | Female | <65 | III/IV | Unknown | Unknown | SD |
| EIF3G | SNV | Missense_Mutation | novel | c.404A>T | p.Glu135Val | p.E135V | O75821 | protein_coding | deleterious(0) | probably_damaging(0.99) | TCGA-AJ-A3EK-01 | Endometrium | uterine corpus endometrioid carcinoma | Female | <65 | I/II | Chemotherapy | carboplatin | CR |
| EIF3G | SNV | Missense_Mutation | | c.621G>T | p.Gln207His | p.Q207H | O75821 | protein_coding | tolerated(0.12) | benign(0.188) | TCGA-AP-A0LM-01 | Endometrium | uterine corpus endometrioid carcinoma | Female | <65 | III/IV | Chemotherapy | cisplatin | SD |
| EIF3G | SNV | Missense_Mutation | rs747937250 | c.127C>T | p.Pro43Ser | p.P43S | O75821 | protein_coding | tolerated_low_confidence(0.69) | benign(0) | TCGA-AP-A0LM-01 | Endometrium | uterine corpus endometrioid carcinoma | Female | <65 | III/IV | Chemotherapy | cisplatin | SD |


