
|
|||||
|
 | |
| |
| |
| |
| |
| |
|
Gene: EIF3E |
Gene summary for EIF3E |
| Gene information | Species | Human | Gene symbol | EIF3E | Gene ID | 3646 |
| Gene name | eukaryotic translation initiation factor 3 subunit E | |
| Gene Alias | EIF3-P48 | |
| Cytomap | 8q23.1 | |
| Gene Type | protein-coding | GO ID | GO:0000184 | UniProtAcc | P60228 |
Top |
Malignant transformation analysis |
| Identification of the aberrant gene expression in precancerous and cancerous lesions by comparing the gene expression of stem-like cells in diseased tissues with normal stem cells |
| Entrez ID | Symbol | Replicates | Species | Organ | Tissue | Adj P-value | Log2FC | Malignancy |
| 3646 | EIF3E | GSM4909281 | Human | Breast | IDC | 5.01e-13 | 3.68e-01 | 0.21 |
| 3646 | EIF3E | GSM4909286 | Human | Breast | IDC | 5.85e-04 | 3.24e-01 | 0.1081 |
| 3646 | EIF3E | GSM4909287 | Human | Breast | IDC | 1.10e-05 | 1.57e-01 | 0.2057 |
| 3646 | EIF3E | GSM4909290 | Human | Breast | IDC | 6.45e-25 | -7.58e-01 | 0.2096 |
| 3646 | EIF3E | GSM4909291 | Human | Breast | IDC | 1.50e-11 | -6.62e-01 | 0.1753 |
| 3646 | EIF3E | GSM4909294 | Human | Breast | IDC | 1.71e-08 | 8.22e-02 | 0.2022 |
| 3646 | EIF3E | GSM4909295 | Human | Breast | IDC | 2.15e-06 | 3.10e-01 | 0.0898 |
| 3646 | EIF3E | GSM4909296 | Human | Breast | IDC | 6.88e-16 | -5.02e-01 | 0.1524 |
| 3646 | EIF3E | GSM4909297 | Human | Breast | IDC | 1.83e-23 | 6.30e-02 | 0.1517 |
| 3646 | EIF3E | GSM4909298 | Human | Breast | IDC | 4.27e-10 | -3.75e-01 | 0.1551 |
| 3646 | EIF3E | GSM4909301 | Human | Breast | IDC | 8.37e-45 | -8.99e-01 | 0.1577 |
| 3646 | EIF3E | GSM4909302 | Human | Breast | IDC | 1.10e-08 | -5.20e-01 | 0.1545 |
| 3646 | EIF3E | GSM4909305 | Human | Breast | IDC | 1.37e-18 | 4.18e-01 | 0.0436 |
| 3646 | EIF3E | GSM4909307 | Human | Breast | IDC | 1.56e-04 | -2.95e-01 | 0.1569 |
| 3646 | EIF3E | GSM4909308 | Human | Breast | IDC | 9.53e-09 | 2.41e-01 | 0.158 |
| 3646 | EIF3E | GSM4909311 | Human | Breast | IDC | 6.42e-46 | -4.37e-01 | 0.1534 |
| 3646 | EIF3E | GSM4909312 | Human | Breast | IDC | 3.48e-35 | 4.46e-01 | 0.1552 |
| 3646 | EIF3E | GSM4909317 | Human | Breast | IDC | 2.15e-03 | -1.51e-01 | 0.1355 |
| 3646 | EIF3E | GSM4909319 | Human | Breast | IDC | 1.94e-66 | -7.56e-01 | 0.1563 |
| 3646 | EIF3E | GSM4909320 | Human | Breast | IDC | 3.09e-15 | -9.49e-01 | 0.1575 |
| Page: 1 2 3 4 5 6 7 8 9 10 11 12 13 14 15 16 |
| Tissue | Expression Dynamics | Abbreviation |
| Breast |  | IDC: Invasive ductal carcinoma |
| DCIS: Ductal carcinoma in situ | ||
| Precancer(BRCA1-mut): Precancerous lesion from BRCA1 mutation carriers | ||
| Colorectum (GSE201348) |  | FAP: Familial adenomatous polyposis |
| CRC: Colorectal cancer | ||
| Colorectum (HTA11) |  | AD: Adenomas |
| SER: Sessile serrated lesions | ||
| MSI-H: Microsatellite-high colorectal cancer | ||
| MSS: Microsatellite stable colorectal cancer | ||
| Endometrium | 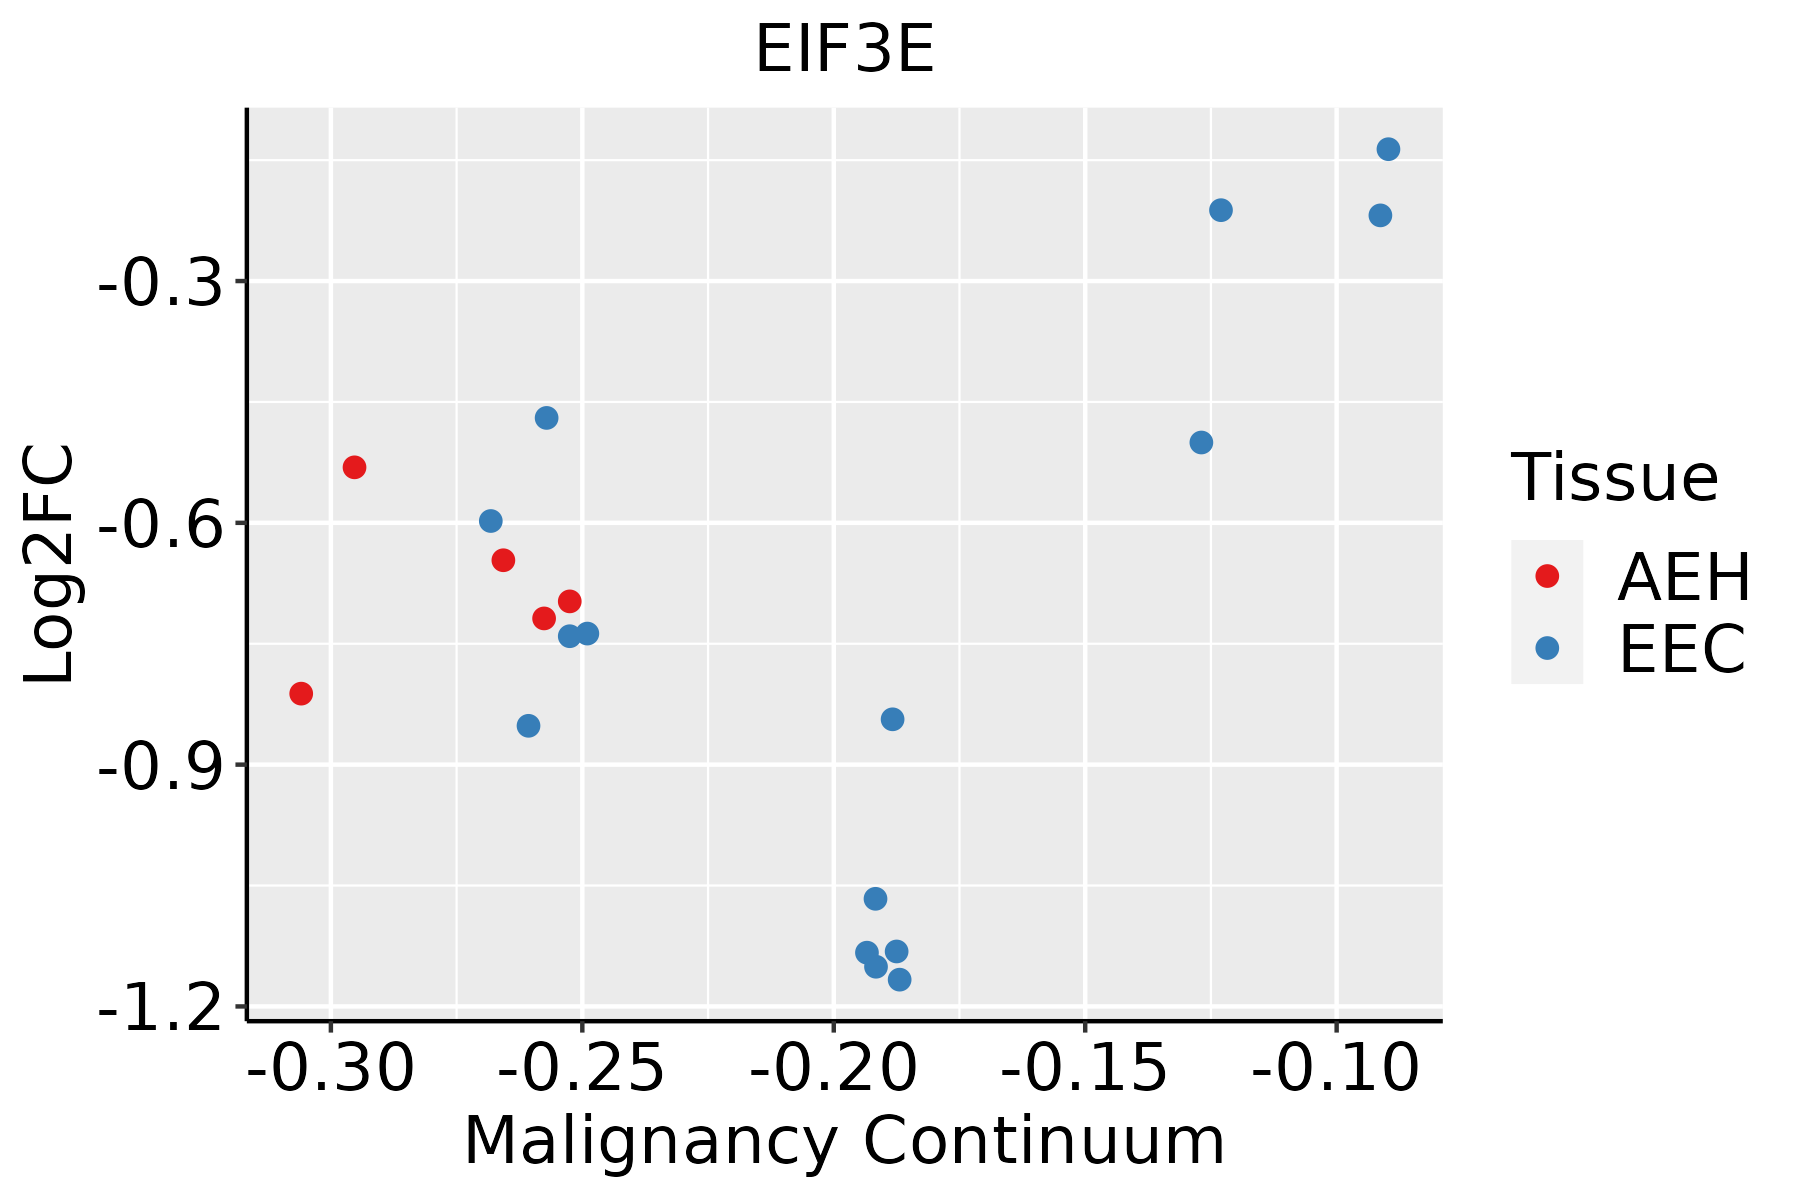 | AEH: Atypical endometrial hyperplasia |
| EEC: Endometrioid Cancer | ||
| Esophagus | 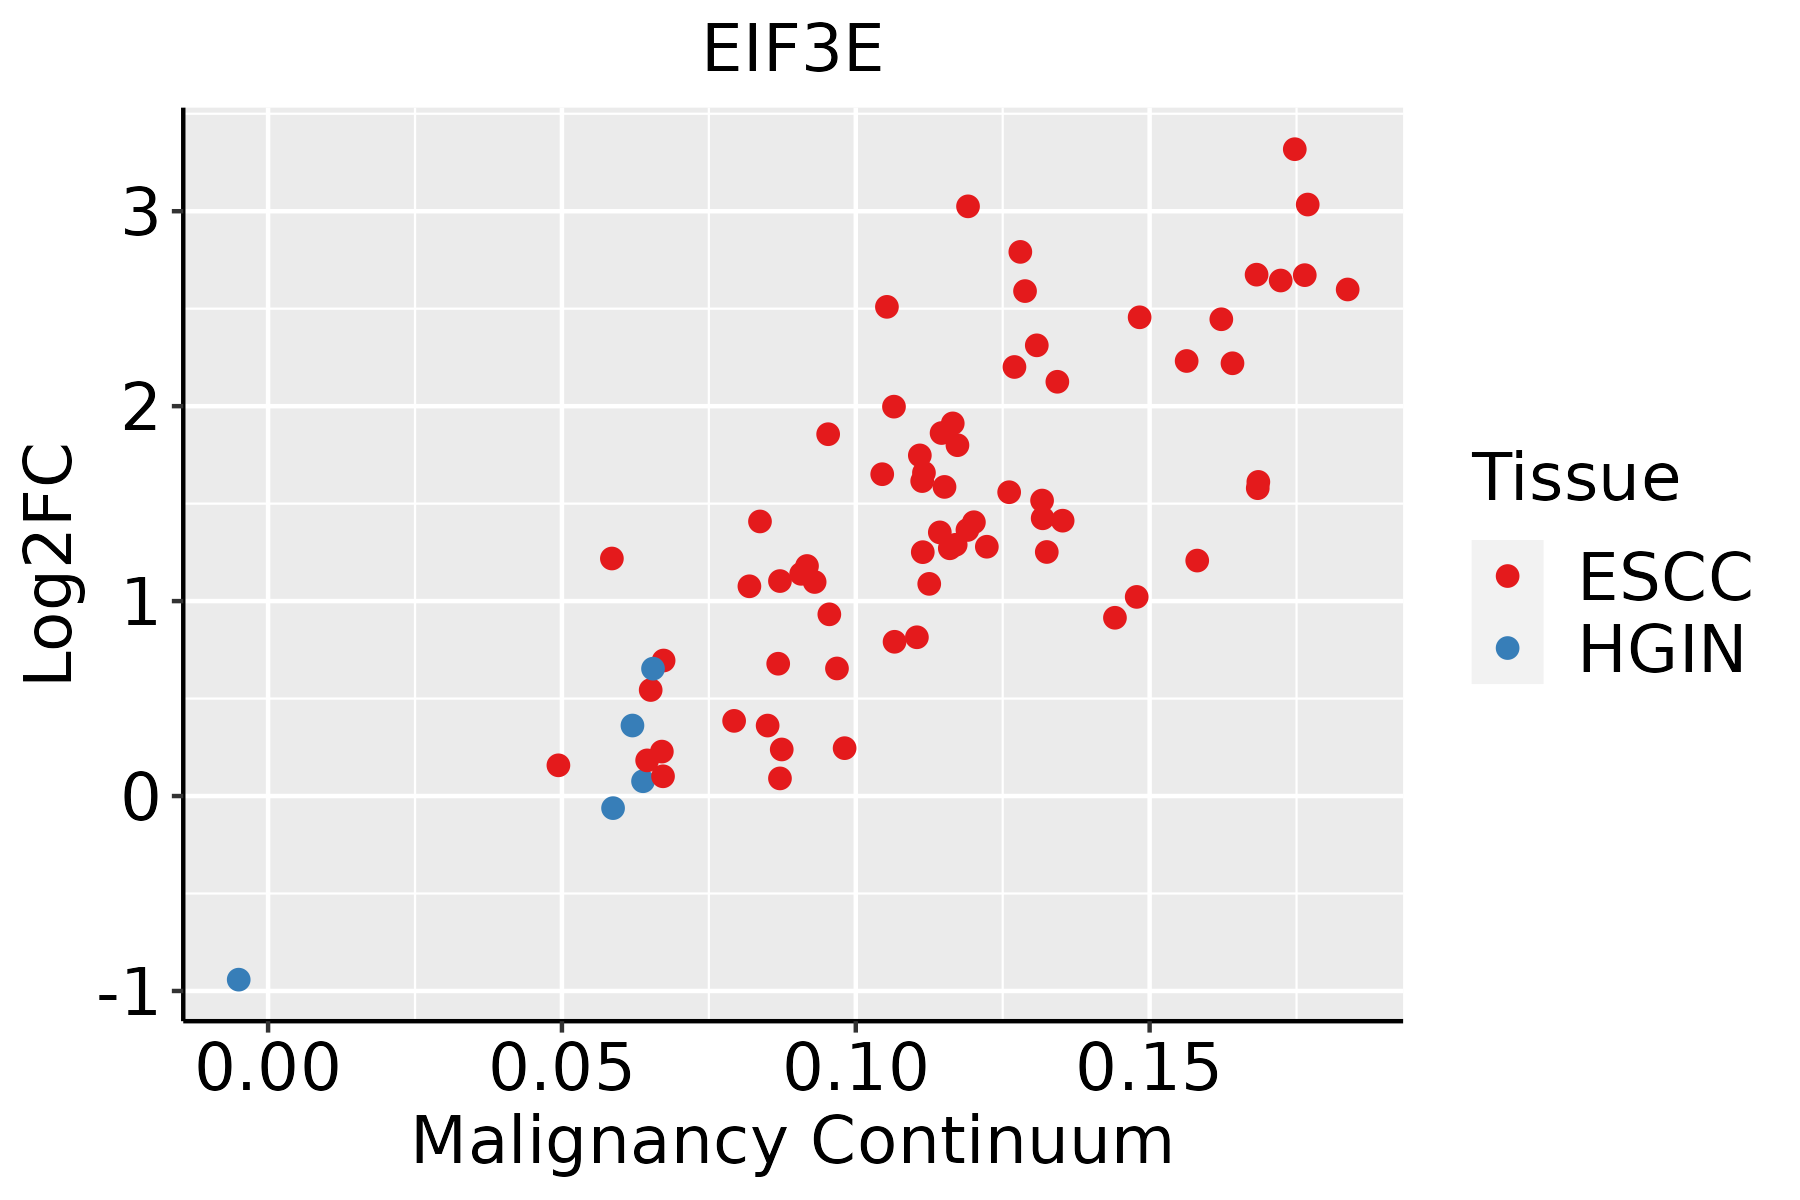 | ESCC: Esophageal squamous cell carcinoma |
| HGIN: High-grade intraepithelial neoplasias | ||
| LGIN: Low-grade intraepithelial neoplasias | ||
| GC |  | CAG: Chronic atrophic gastritis |
| CAG with IM: Chronic atrophic gastritis with intestinal metaplasia | ||
| CSG: Chronic superficial gastritis | ||
| GC: Gastric cancer | ||
| SIM: Severe intestinal metaplasia | ||
| WIM: Wild intestinal metaplasia | ||
| Liver |  | HCC: Hepatocellular carcinoma |
| NAFLD: Non-alcoholic fatty liver disease | ||
| Oral Cavity | 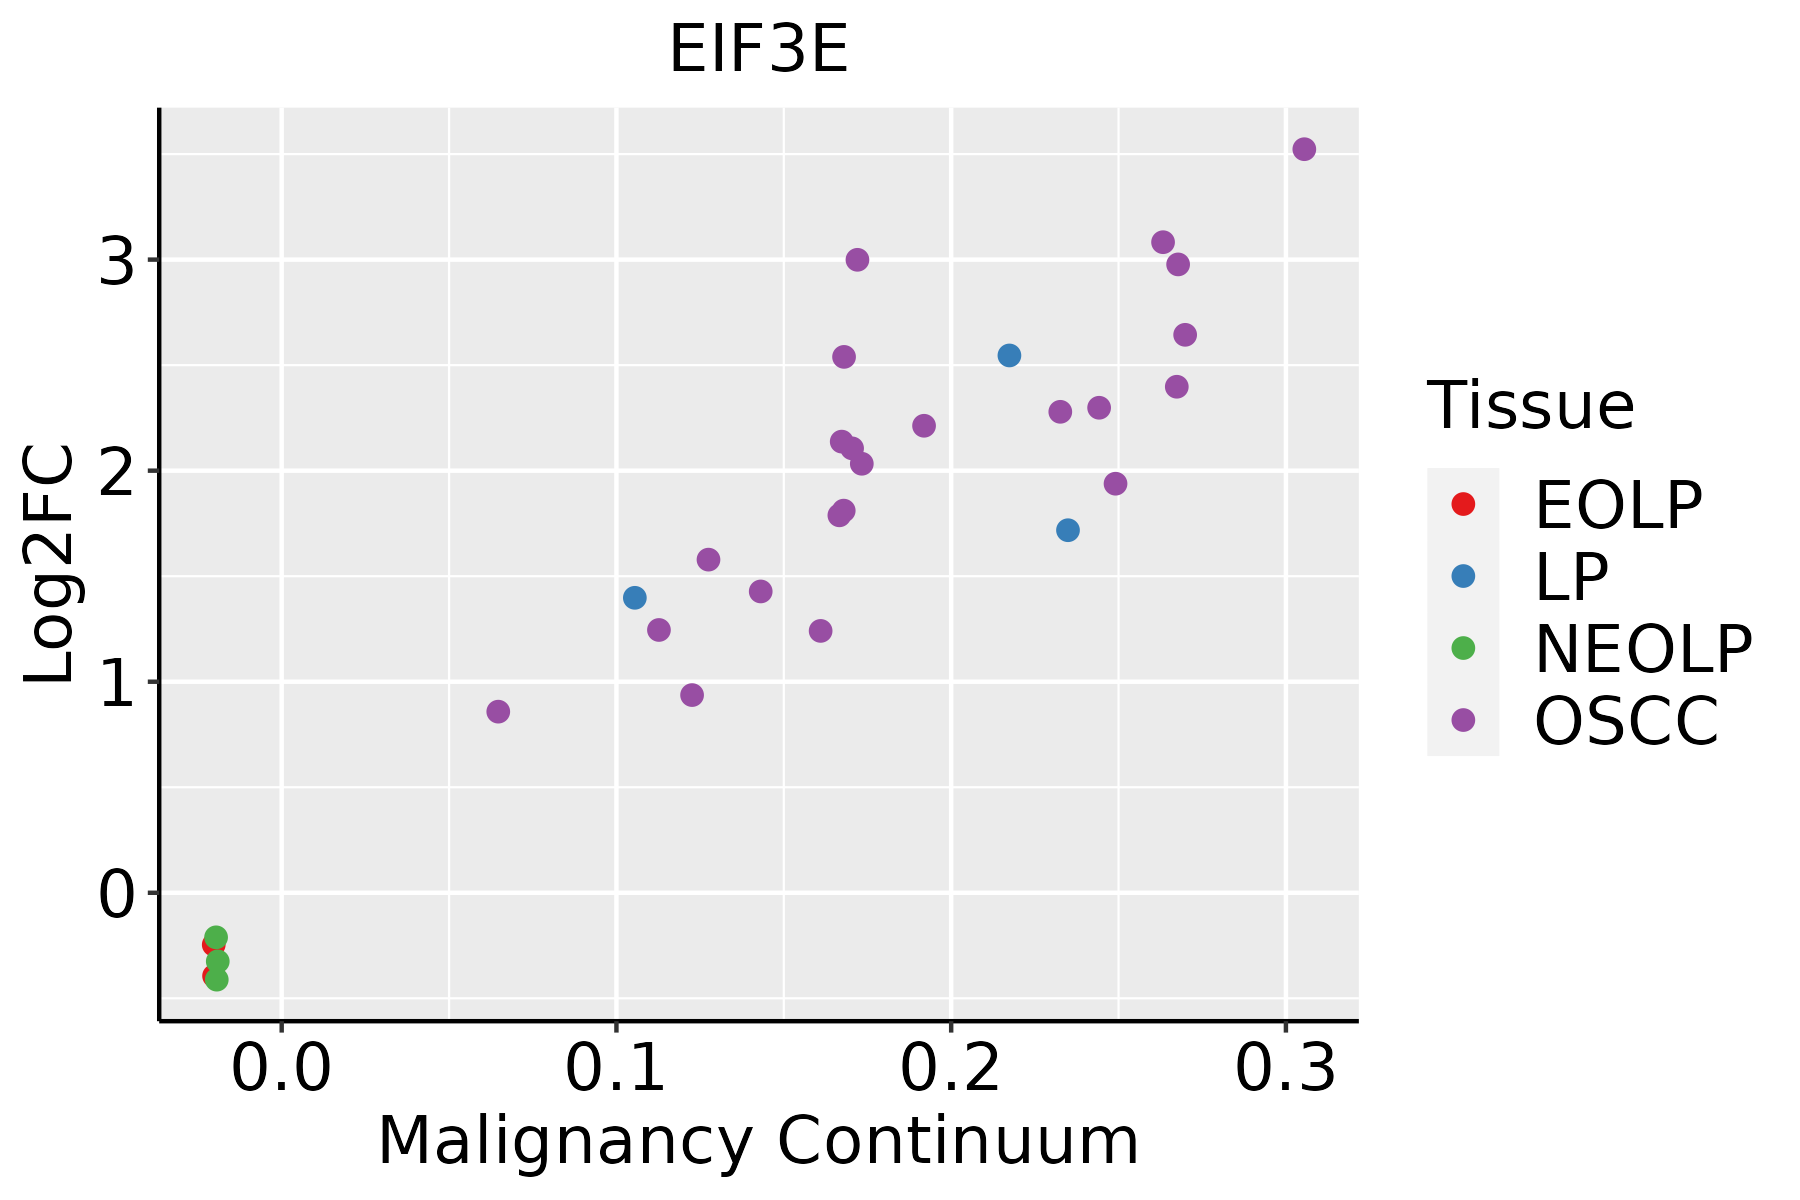 | EOLP: Erosive Oral lichen planus |
| LP: leukoplakia | ||
| NEOLP: Non-erosive oral lichen planus | ||
| OSCC: Oral squamous cell carcinoma | ||
| Prostate |  | BPH: Benign Prostatic Hyperplasia |
| Skin | 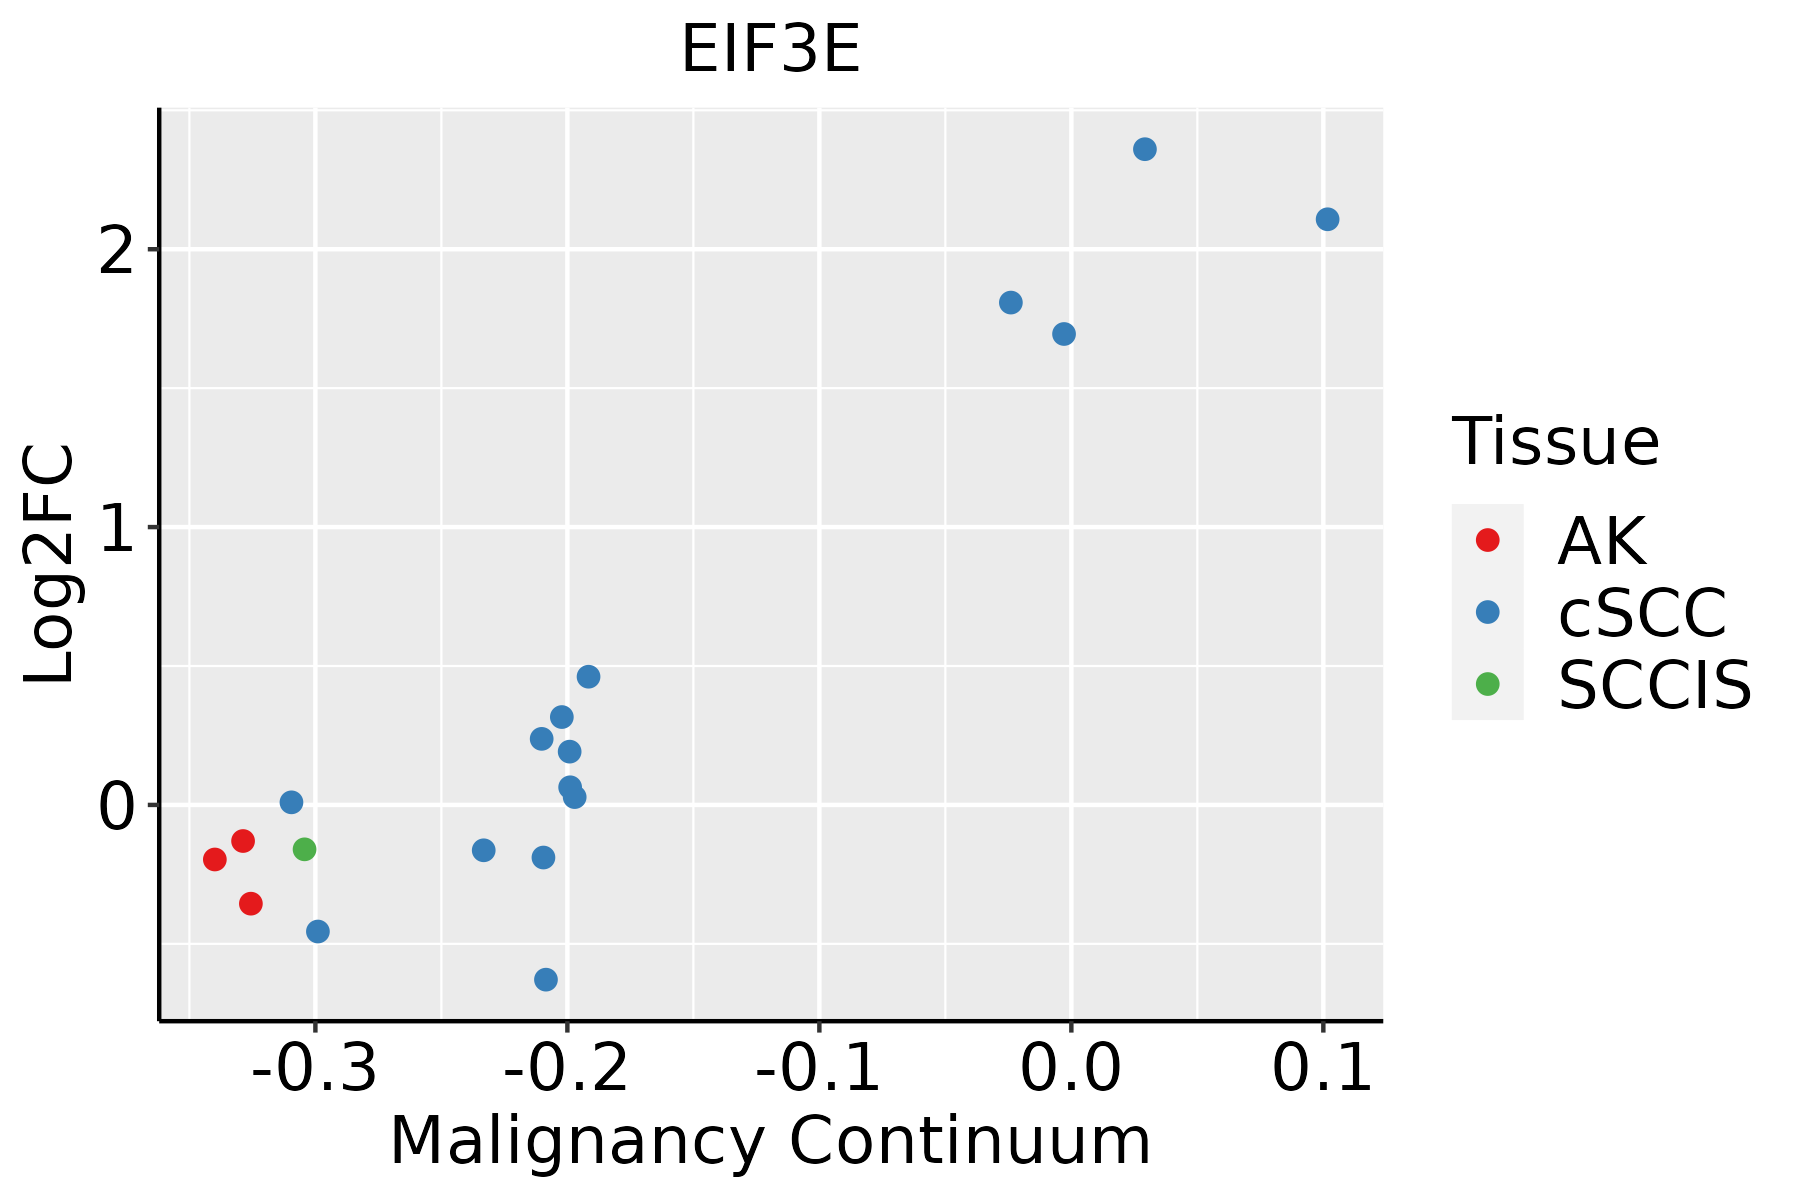 | AK: Actinic keratosis |
| cSCC: Cutaneous squamous cell carcinoma | ||
| SCCIS:squamous cell carcinoma in situ | ||
| Thyroid | 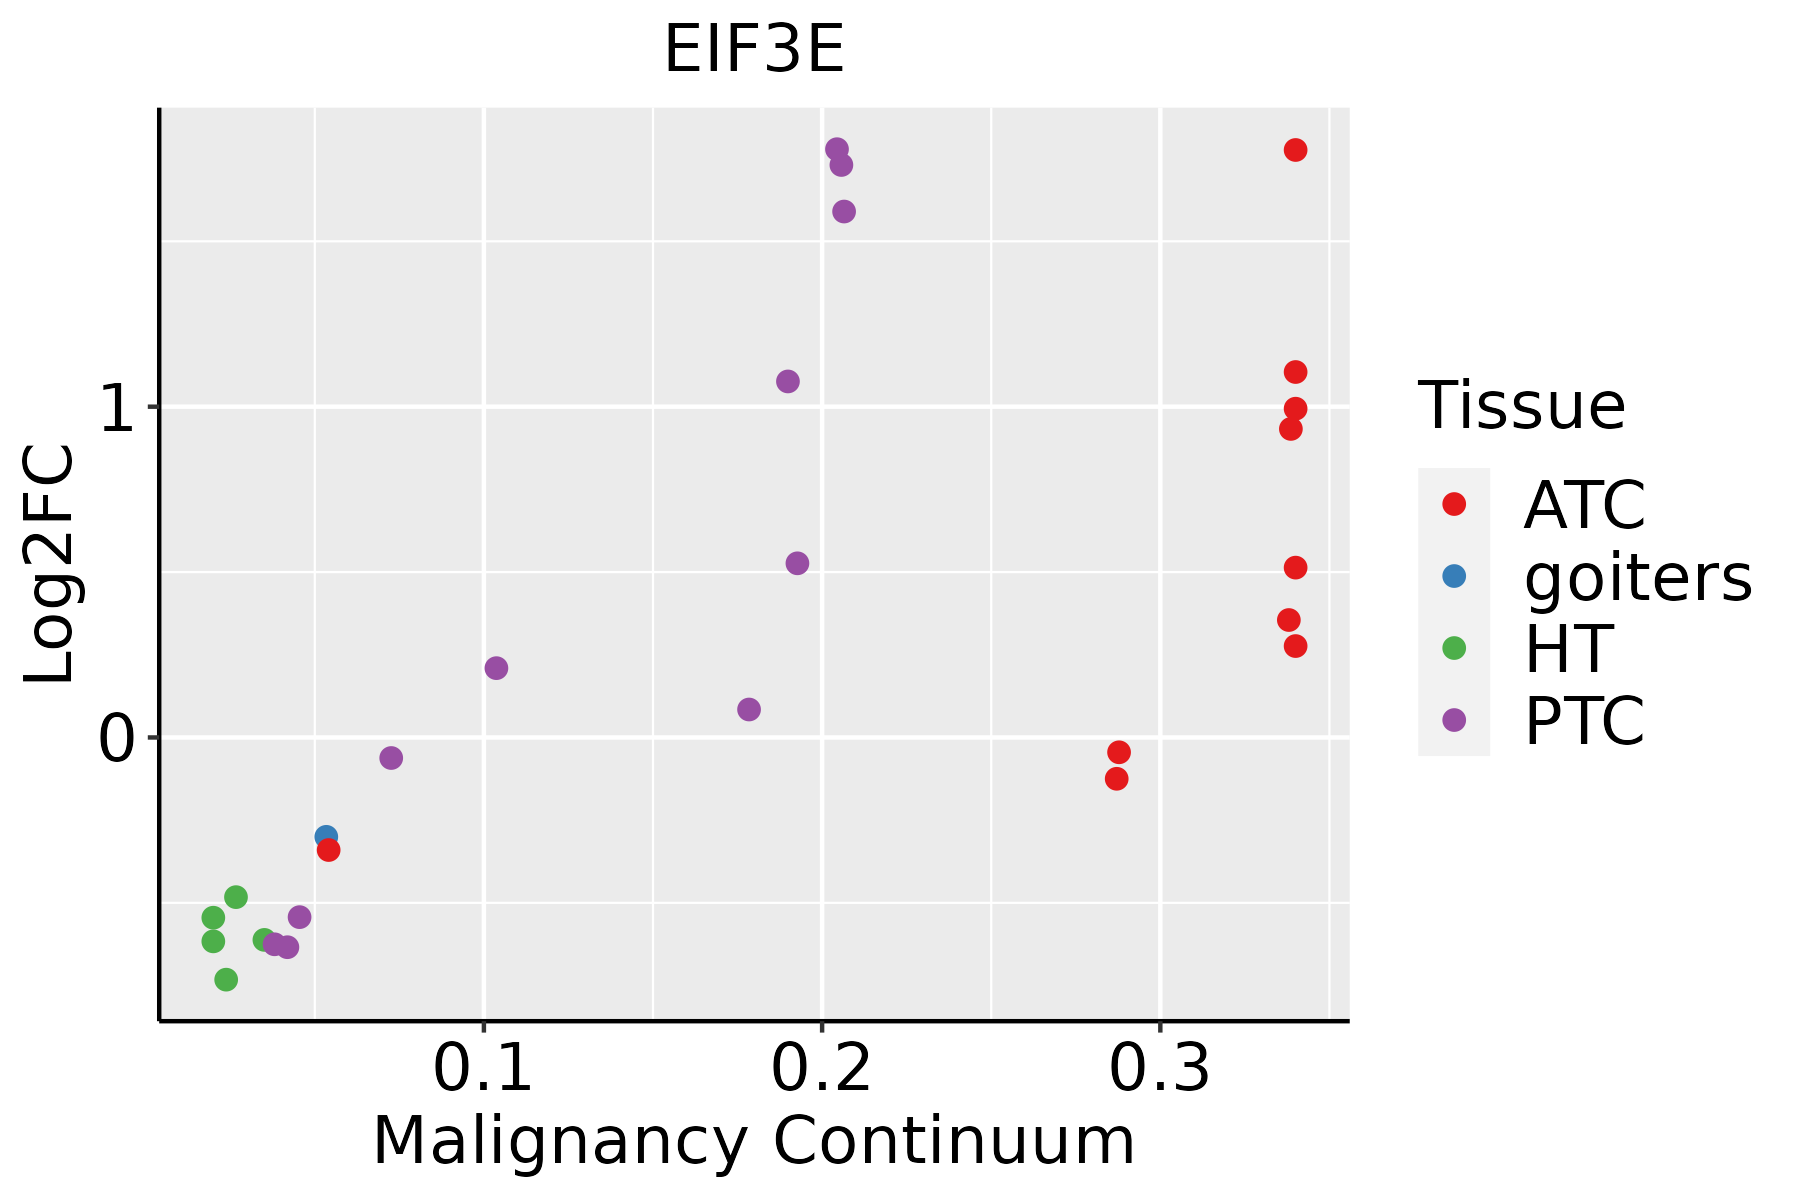 | ATC: Anaplastic thyroid cancer |
| HT: Hashimoto's thyroiditis | ||
| PTC: Papillary thyroid cancer |
| ∗log2FC in expression of this searched gene in stem-like cells from each diseased tissue sample relative to stem-like cells in normal samples in each tissue plotted against the malignancy continuum. Samples are colored based on if they are from different disease stage. |
Top |
Malignant transformation related pathway analysis |
| Find out the enriched GO biological processes and KEGG pathways involved in transition from healthy to precancer to cancer |
| Tissue | Disease Stage | Enriched GO biological Processes |
| Colorectum | AD |  |
| Colorectum | SER |  |
| Colorectum | MSS |  |
| Colorectum | MSI-H |  |
| Colorectum | FAP |  |
| ∗Top 15 enriched GO BP terms are showed in the bar plot of each disease state in each tissue. Each row represents a significant GO biological process which is colored according to the -log10(p.adjust). |
| Page: 1 2 3 4 5 6 7 8 9 |
| GO ID | Tissue | Disease Stage | Description | Gene Ratio | Bg Ratio | pvalue | p.adjust | Count |
| GO:00021819 | Breast | Precancer | cytoplasmic translation | 80/1080 | 148/18723 | 1.59e-59 | 8.54e-56 | 80 |
| GO:00226139 | Breast | Precancer | ribonucleoprotein complex biogenesis | 79/1080 | 463/18723 | 2.11e-18 | 1.03e-15 | 79 |
| GO:00718269 | Breast | Precancer | ribonucleoprotein complex subunit organization | 48/1080 | 227/18723 | 2.68e-15 | 8.45e-13 | 48 |
| GO:00226189 | Breast | Precancer | ribonucleoprotein complex assembly | 47/1080 | 220/18723 | 3.47e-15 | 1.03e-12 | 47 |
| GO:00064138 | Breast | Precancer | translational initiation | 30/1080 | 118/18723 | 3.23e-12 | 5.58e-10 | 30 |
| GO:00064179 | Breast | Precancer | regulation of translation | 67/1080 | 468/18723 | 4.71e-12 | 7.64e-10 | 67 |
| GO:00457279 | Breast | Precancer | positive regulation of translation | 32/1080 | 136/18723 | 5.89e-12 | 9.27e-10 | 32 |
| GO:00342509 | Breast | Precancer | positive regulation of cellular amide metabolic process | 33/1080 | 162/18723 | 1.72e-10 | 1.77e-08 | 33 |
| GO:00064466 | Breast | Precancer | regulation of translational initiation | 19/1080 | 79/18723 | 7.99e-08 | 4.60e-06 | 19 |
| GO:00021838 | Breast | Precancer | cytoplasmic translational initiation | 11/1080 | 34/18723 | 1.87e-06 | 6.63e-05 | 11 |
| GO:00510989 | Breast | Precancer | regulation of binding | 44/1080 | 363/18723 | 2.59e-06 | 8.65e-05 | 44 |
| GO:00064028 | Breast | Precancer | mRNA catabolic process | 31/1080 | 232/18723 | 1.12e-05 | 2.93e-04 | 31 |
| GO:00017328 | Breast | Precancer | formation of cytoplasmic translation initiation complex | 7/1080 | 16/18723 | 1.50e-05 | 3.71e-04 | 7 |
| GO:00064018 | Breast | Precancer | RNA catabolic process | 34/1080 | 278/18723 | 2.88e-05 | 6.39e-04 | 34 |
| GO:00510999 | Breast | Precancer | positive regulation of binding | 23/1080 | 173/18723 | 1.58e-04 | 2.68e-03 | 23 |
| GO:00346558 | Breast | Precancer | nucleobase-containing compound catabolic process | 42/1080 | 407/18723 | 1.91e-04 | 3.06e-03 | 42 |
| GO:00467007 | Breast | Precancer | heterocycle catabolic process | 44/1080 | 445/18723 | 3.49e-04 | 4.88e-03 | 44 |
| GO:00442708 | Breast | Precancer | cellular nitrogen compound catabolic process | 44/1080 | 451/18723 | 4.64e-04 | 6.12e-03 | 44 |
| GO:00009566 | Breast | Precancer | nuclear-transcribed mRNA catabolic process | 16/1080 | 112/18723 | 6.87e-04 | 8.36e-03 | 16 |
| GO:00194397 | Breast | Precancer | aromatic compound catabolic process | 44/1080 | 467/18723 | 9.55e-04 | 1.07e-02 | 44 |
| Page: 1 2 3 4 5 6 7 8 9 10 11 12 13 14 15 16 17 18 19 20 21 22 23 24 25 26 27 28 29 30 31 32 33 34 35 |
| Pathway ID | Tissue | Disease Stage | Description | Gene Ratio | Bg Ratio | pvalue | p.adjust | qvalue | Count |
| hsa05160 | Colorectum | AD | Hepatitis C | 54/2092 | 157/8465 | 3.87e-03 | 1.96e-02 | 1.25e-02 | 54 |
| hsa051601 | Colorectum | AD | Hepatitis C | 54/2092 | 157/8465 | 3.87e-03 | 1.96e-02 | 1.25e-02 | 54 |
| hsa051602 | Colorectum | MSS | Hepatitis C | 52/1875 | 157/8465 | 9.29e-04 | 5.58e-03 | 3.42e-03 | 52 |
| hsa051603 | Colorectum | MSS | Hepatitis C | 52/1875 | 157/8465 | 9.29e-04 | 5.58e-03 | 3.42e-03 | 52 |
| hsa051609 | Esophagus | ESCC | Hepatitis C | 107/4205 | 157/8465 | 1.75e-06 | 1.08e-05 | 5.55e-06 | 107 |
| hsa0516016 | Esophagus | ESCC | Hepatitis C | 107/4205 | 157/8465 | 1.75e-06 | 1.08e-05 | 5.55e-06 | 107 |
| hsa051605 | Liver | Cirrhotic | Hepatitis C | 63/2530 | 157/8465 | 3.67e-03 | 1.49e-02 | 9.20e-03 | 63 |
| hsa0516012 | Liver | Cirrhotic | Hepatitis C | 63/2530 | 157/8465 | 3.67e-03 | 1.49e-02 | 9.20e-03 | 63 |
| hsa0516021 | Liver | HCC | Hepatitis C | 94/4020 | 157/8465 | 1.11e-03 | 4.10e-03 | 2.28e-03 | 94 |
| hsa0516031 | Liver | HCC | Hepatitis C | 94/4020 | 157/8465 | 1.11e-03 | 4.10e-03 | 2.28e-03 | 94 |
| hsa051608 | Oral cavity | OSCC | Hepatitis C | 103/3704 | 157/8465 | 2.17e-08 | 1.96e-07 | 9.99e-08 | 103 |
| hsa0516015 | Oral cavity | OSCC | Hepatitis C | 103/3704 | 157/8465 | 2.17e-08 | 1.96e-07 | 9.99e-08 | 103 |
| hsa0516024 | Oral cavity | LP | Hepatitis C | 73/2418 | 157/8465 | 1.14e-06 | 1.36e-05 | 8.74e-06 | 73 |
| hsa0516034 | Oral cavity | LP | Hepatitis C | 73/2418 | 157/8465 | 1.14e-06 | 1.36e-05 | 8.74e-06 | 73 |
| hsa0516041 | Oral cavity | EOLP | Hepatitis C | 52/1218 | 157/8465 | 1.79e-09 | 4.81e-08 | 2.84e-08 | 52 |
| hsa0516051 | Oral cavity | EOLP | Hepatitis C | 52/1218 | 157/8465 | 1.79e-09 | 4.81e-08 | 2.84e-08 | 52 |
| hsa0516061 | Oral cavity | NEOLP | Hepatitis C | 43/1112 | 157/8465 | 1.26e-06 | 1.34e-05 | 8.43e-06 | 43 |
| hsa0516071 | Oral cavity | NEOLP | Hepatitis C | 43/1112 | 157/8465 | 1.26e-06 | 1.34e-05 | 8.43e-06 | 43 |
| hsa051607 | Prostate | BPH | Hepatitis C | 48/1718 | 157/8465 | 1.36e-03 | 5.85e-03 | 3.62e-03 | 48 |
| hsa0516014 | Prostate | BPH | Hepatitis C | 48/1718 | 157/8465 | 1.36e-03 | 5.85e-03 | 3.62e-03 | 48 |
| Page: 1 2 |
Top |
Cell-cell communication analysis |
| Identification of potential cell-cell interactions between two cell types and their ligand-receptor pairs for different disease states |
| Ligand | Receptor | LRpair | Pathway | Tissue | Disease Stage |
| Page: 1 |
Top |
Single-cell gene regulatory network inference analysis |
| Find out the significant the regulons (TFs) and the target genes of each regulon across cell types for different disease states |
| TF | Cell Type | Tissue | Disease Stage | Target Gene | RSS | Regulon Activity |
| ∗The dot plots of a searched regulon are shown for all cell subpopulations in each disease state of each tissue based on the regulon specific score inferred using pySCENIC and by calculating the average expression. |
| Page: 1 |
Top |
Somatic mutation of malignant transformation related genes |
| Annotation of somatic variants for genes involved in malignant transformation |
| Hugo Symbol | Variant Class | Variant Classification | dbSNP RS | HGVSc | HGVSp | HGVSp Short | SWISSPROT | BIOTYPE | SIFT | PolyPhen | Tumor Sample Barcode | Tissue | Histology | Sex | Age | Stage | Therapy Types | Drugs | Outcome |
| EIF3E | SNV | Missense_Mutation | c.1096N>A | p.Glu366Lys | p.E366K | P60228 | protein_coding | deleterious(0.02) | benign(0.349) | TCGA-AN-A0XW-01 | Breast | breast invasive carcinoma | Female | <65 | III/IV | Unknown | Unknown | SD | |
| EIF3E | SNV | Missense_Mutation | c.1265T>C | p.Ile422Thr | p.I422T | P60228 | protein_coding | deleterious(0.04) | benign(0.265) | TCGA-AO-A03O-01 | Breast | breast invasive carcinoma | Female | >=65 | I/II | Chemotherapy | doxorubicin | SD | |
| EIF3E | SNV | Missense_Mutation | c.222N>T | p.Arg74Ser | p.R74S | P60228 | protein_coding | deleterious(0) | probably_damaging(0.992) | TCGA-BI-A0VR-01 | Cervix | cervical & endocervical cancer | Female | <65 | III/IV | Unknown | Unknown | SD | |
| EIF3E | SNV | Missense_Mutation | c.30N>G | p.Ile10Met | p.I10M | P60228 | protein_coding | tolerated(0.62) | benign(0.216) | TCGA-C5-A1M8-01 | Cervix | cervical & endocervical cancer | Female | <65 | I/II | Unknown | Unknown | SD | |
| EIF3E | SNV | Missense_Mutation | rs201452382 | c.52N>G | p.Leu18Val | p.L18V | P60228 | protein_coding | deleterious(0) | probably_damaging(0.984) | TCGA-GH-A9DA-01 | Cervix | cervical & endocervical cancer | Female | <65 | I/II | Unknown | Unknown | SD |
| EIF3E | SNV | Missense_Mutation | novel | c.62N>T | p.Pro21Leu | p.P21L | P60228 | protein_coding | deleterious(0) | probably_damaging(0.96) | TCGA-Q1-A5R2-01 | Cervix | cervical & endocervical cancer | Female | <65 | I/II | Chemotherapy | cisplatin | PR |
| EIF3E | SNV | Missense_Mutation | c.1229G>A | p.Ser410Asn | p.S410N | P60228 | protein_coding | tolerated(0.71) | benign(0.003) | TCGA-AA-3864-01 | Colorectum | colon adenocarcinoma | Male | >=65 | I/II | Unknown | Unknown | SD | |
| EIF3E | SNV | Missense_Mutation | novel | c.803N>A | p.Arg268Gln | p.R268Q | P60228 | protein_coding | tolerated(0.07) | benign(0.011) | TCGA-AA-3977-01 | Colorectum | colon adenocarcinoma | Male | >=65 | I/II | Unknown | Unknown | SD |
| EIF3E | SNV | Missense_Mutation | novel | c.1261N>C | p.Asn421His | p.N421H | P60228 | protein_coding | tolerated(0.13) | benign(0.021) | TCGA-CA-6717-01 | Colorectum | colon adenocarcinoma | Male | <65 | I/II | Chemotherapy | oxaliplatin | CR |
| EIF3E | SNV | Missense_Mutation | c.669N>A | p.Phe223Leu | p.F223L | P60228 | protein_coding | deleterious(0) | probably_damaging(0.912) | TCGA-F4-6459-01 | Colorectum | colon adenocarcinoma | Female | <65 | III/IV | Unknown | Unknown | SD |
| Page: 1 2 3 4 5 6 |
Top |
Related drugs of malignant transformation related genes |
| Identification of chemicals and drugs interact with genes involved in malignant transfromation |
| (DGIdb 4.0) |
| Entrez ID | Symbol | Category | Interaction Types | Drug Claim Name | Drug Name | PMIDs |
| Page: 1 |

Copyright 2023-Present -The University of Texas Health Science Center at Houston |