Schematic overview of the cellular and molecular mechanisms involved in the cancer progression, including the proposed cellular and molecular mechanisms in cancer cells trajectory. AT1: alveolar type 1 cells; AT2: alveolar type 2 cells; AAH: atypical adenomatous hyperplasia; AIS: adenocarcinoma in situ; MIA: minimally invasive adenocarcinoma; IA: invasive adenocarcinoma; EMT: epithelial-mesenchymal transition

Home

Download

Statistics

Help

Contact

Center for Computational Systems Medicine
leaf

Gene summary

leaf

Malignant transformation analysis

leaf

Malignant transformation related pathway analysis

leaf

Cell-cell communication analysis

leaf

Single-cell gene regulatory network inference analysis

leaf

Somatic mutation of malignant transformation related genes

leaf

Related drugs of malignant transformation related genes

Gene: EIF3D

Gene summary for EIF3D

check button Gene summary.

Gene informationSpeciesHuman
Gene symbol

EIF3D

Gene ID

8664

Gene nameeukaryotic translation initiation factor 3 subunit D
Gene AliasEIF3S7
Cytomap22q12.3
Gene Typeprotein-coding
GO ID

GO:0001732

UniProtAcc

O15371


Top

Malignant transformation analysis

check button Identification of the aberrant gene expression in precancerous and cancerous lesions by comparing the gene expression of stem-like cells in diseased tissues with normal stem cells
check button Malignant transformation involving gene list.
Entrez IDSymbolReplicatesSpeciesOrganTissueAdj P-valueLog2FCMalignancy
8664EIF3DGSM4909281HumanBreastIDC1.97e-04-2.89e-010.21
8664EIF3DGSM4909287HumanBreastIDC3.42e-10-4.63e-010.2057
8664EIF3DGSM4909291HumanBreastIDC8.11e-10-5.41e-010.1753
8664EIF3DGSM4909293HumanBreastIDC4.05e-16-4.76e-010.1581
8664EIF3DGSM4909294HumanBreastIDC2.30e-14-4.28e-010.2022
8664EIF3DGSM4909296HumanBreastIDC6.43e-34-6.15e-010.1524
8664EIF3DGSM4909297HumanBreastIDC6.96e-23-3.08e-010.1517
8664EIF3DGSM4909298HumanBreastIDC5.84e-04-3.02e-010.1551
8664EIF3DGSM4909301HumanBreastIDC5.77e-35-7.09e-010.1577
8664EIF3DGSM4909302HumanBreastIDC3.63e-11-4.72e-010.1545
8664EIF3DGSM4909304HumanBreastIDC8.46e-13-4.31e-010.1636
8664EIF3DGSM4909305HumanBreastIDC3.42e-032.95e-010.0436
8664EIF3DGSM4909307HumanBreastIDC5.24e-05-3.38e-010.1569
8664EIF3DGSM4909309HumanBreastIDC4.25e-04-2.85e-010.0483
8664EIF3DGSM4909311HumanBreastIDC1.29e-46-4.00e-010.1534
8664EIF3DGSM4909312HumanBreastIDC1.28e-19-5.57e-020.1552
8664EIF3DGSM4909313HumanBreastIDC9.84e-071.20e-020.0391
8664EIF3DGSM4909315HumanBreastIDC1.87e-09-4.25e-010.21
8664EIF3DGSM4909316HumanBreastIDC8.62e-05-5.22e-010.21
8664EIF3DGSM4909317HumanBreastIDC1.77e-02-2.84e-010.1355
Page: 1 2 3 4 5 6 7 8 9 10 11 12 13 

check button Transcriptomic changes along malignancy continuum.
TissueExpression DynamicsAbbreviation
BreastThe image shows the transcriptomic changes along malignancy continuum.log2FC in expression of this searched gene in stem-like cells from each diseased tissue sample relative to stem-like cells in normal samples in each tissue plotted against the malignancy continuum. Samples are colored based on if they are from different disease stage.
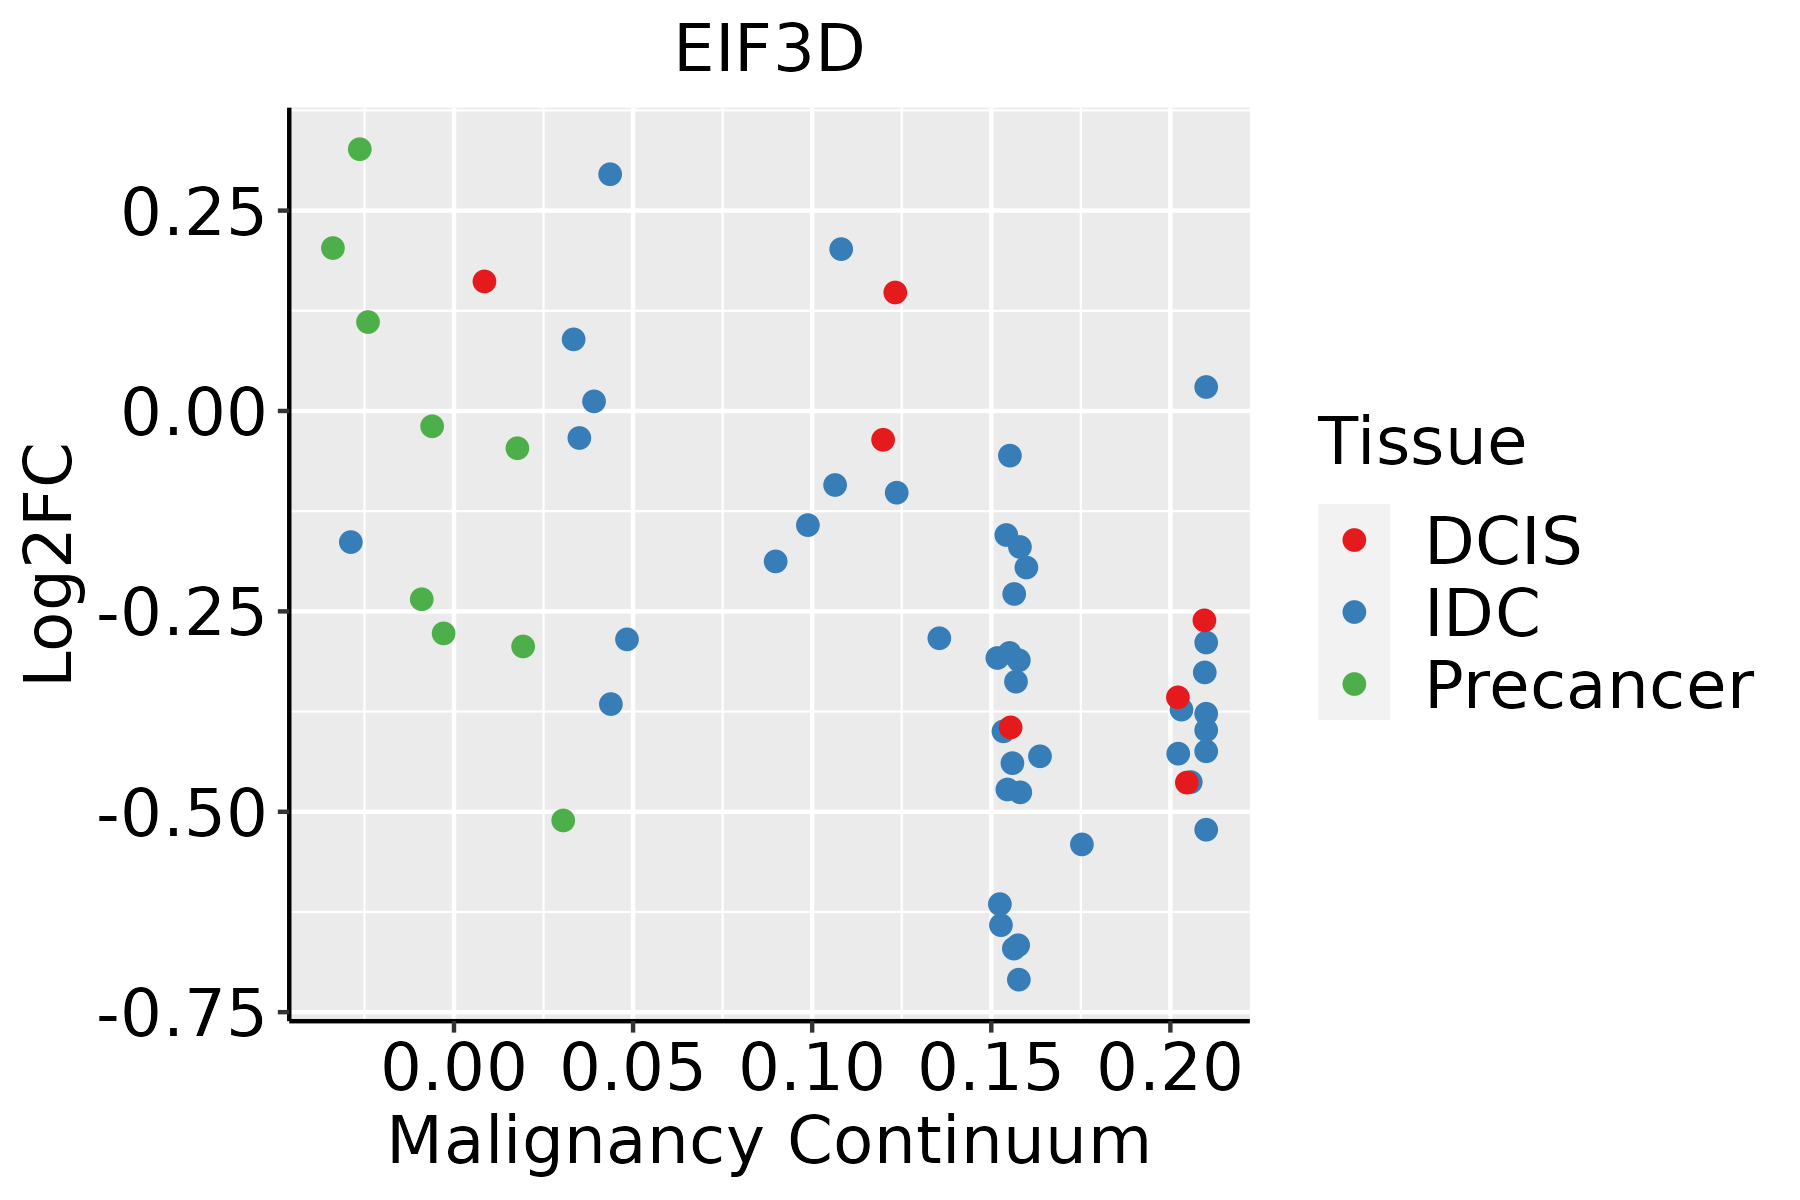
IDC: Invasive ductal carcinoma
DCIS: Ductal carcinoma in situ
Precancer(BRCA1-mut): Precancerous lesion from BRCA1 mutation carriers
Colorectum (GSE201348)The image shows the transcriptomic changes along malignancy continuum.log2FC in expression of this searched gene in stem-like cells from each diseased tissue sample relative to stem-like cells in normal samples in each tissue plotted against the malignancy continuum. Samples are colored based on if they are from different disease stage.FAP: Familial adenomatous polyposis
CRC: Colorectal cancer
Colorectum (HTA11)The image shows the transcriptomic changes along malignancy continuum.log2FC in expression of this searched gene in stem-like cells from each diseased tissue sample relative to stem-like cells in normal samples in each tissue plotted against the malignancy continuum. Samples are colored based on if they are from different disease stage.AD: Adenomas
SER: Sessile serrated lesions
MSI-H: Microsatellite-high colorectal cancer
MSS: Microsatellite stable colorectal cancer
EndometriumThe image shows the transcriptomic changes along malignancy continuum.log2FC in expression of this searched gene in stem-like cells from each diseased tissue sample relative to stem-like cells in normal samples in each tissue plotted against the malignancy continuum. Samples are colored based on if they are from different disease stage.
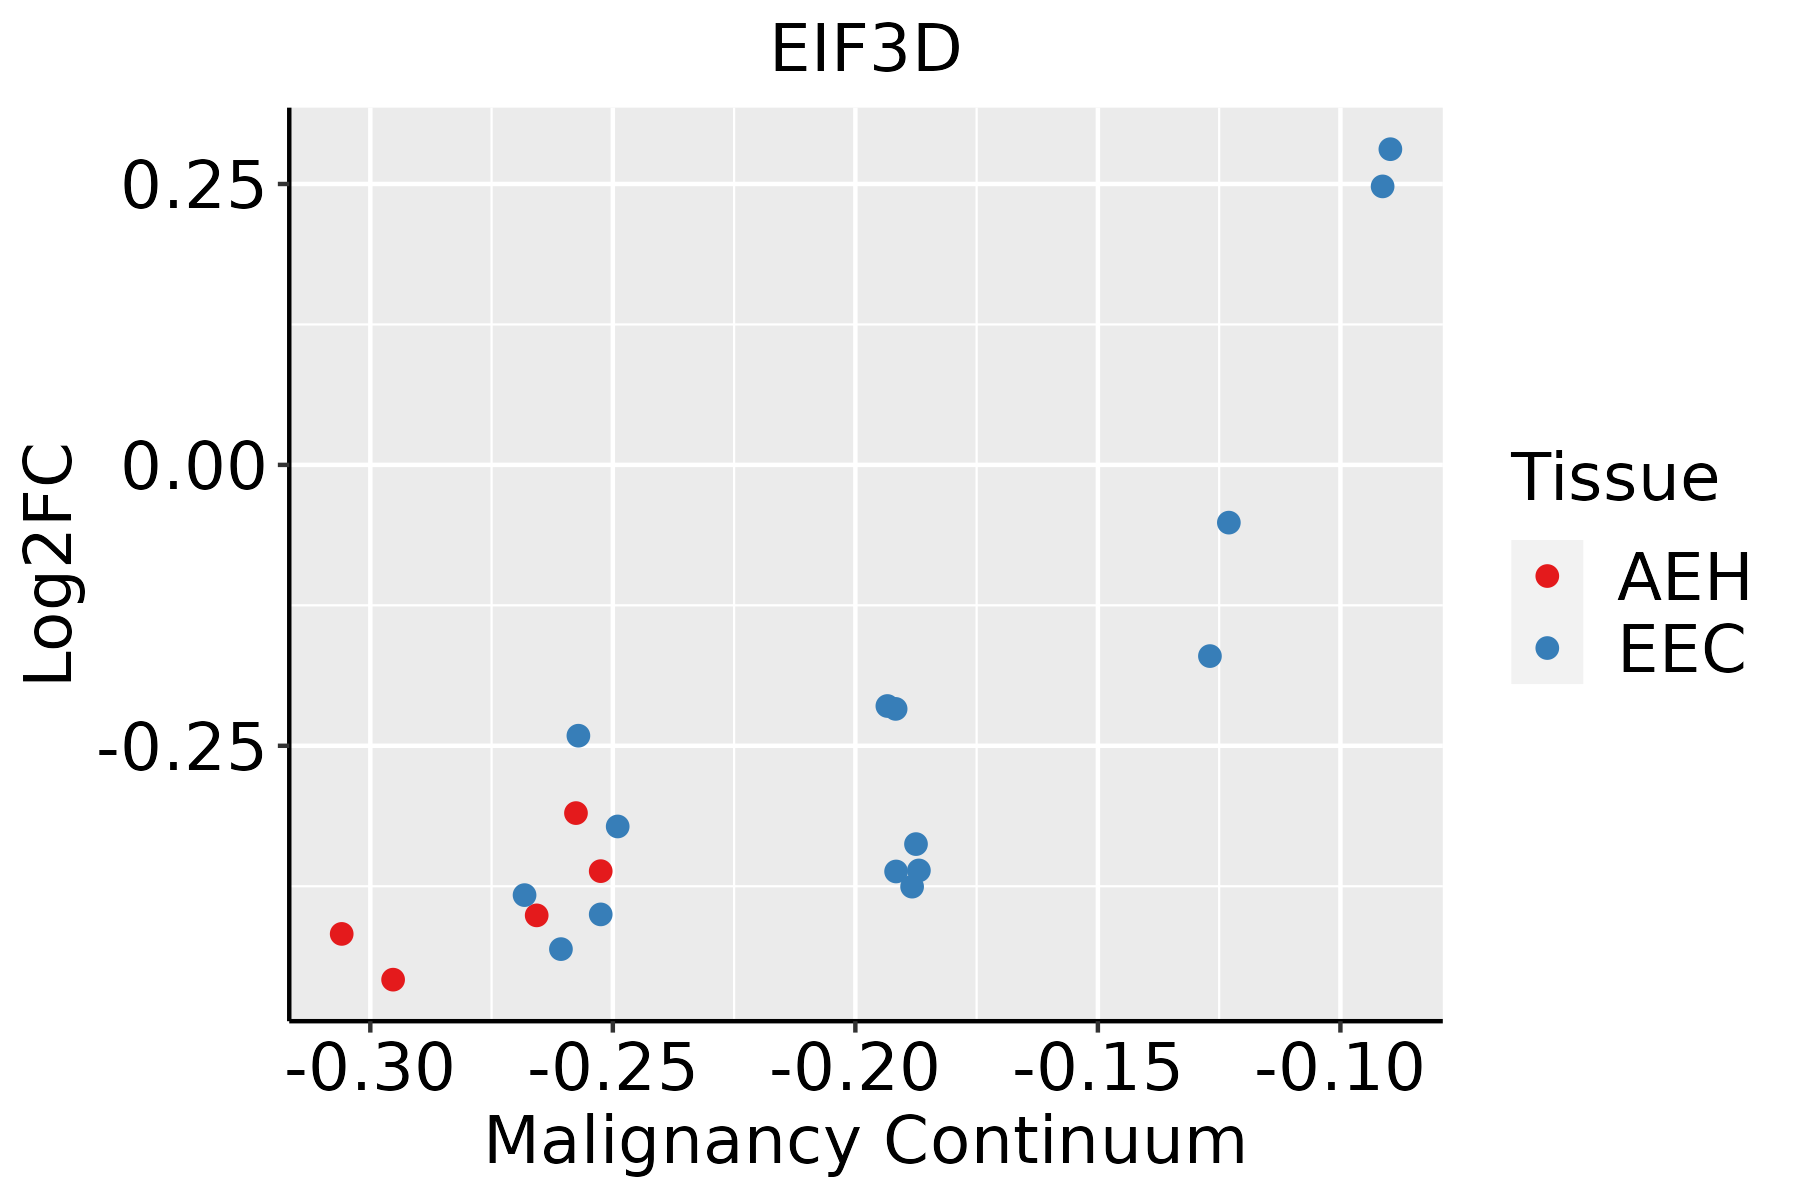
AEH: Atypical endometrial hyperplasia
EEC: Endometrioid Cancer
EsophagusThe image shows the transcriptomic changes along malignancy continuum.log2FC in expression of this searched gene in stem-like cells from each diseased tissue sample relative to stem-like cells in normal samples in each tissue plotted against the malignancy continuum. Samples are colored based on if they are from different disease stage.ESCC: Esophageal squamous cell carcinoma
HGIN: High-grade intraepithelial neoplasias
LGIN: Low-grade intraepithelial neoplasias
LiverThe image shows the transcriptomic changes along malignancy continuum.log2FC in expression of this searched gene in stem-like cells from each diseased tissue sample relative to stem-like cells in normal samples in each tissue plotted against the malignancy continuum. Samples are colored based on if they are from different disease stage.
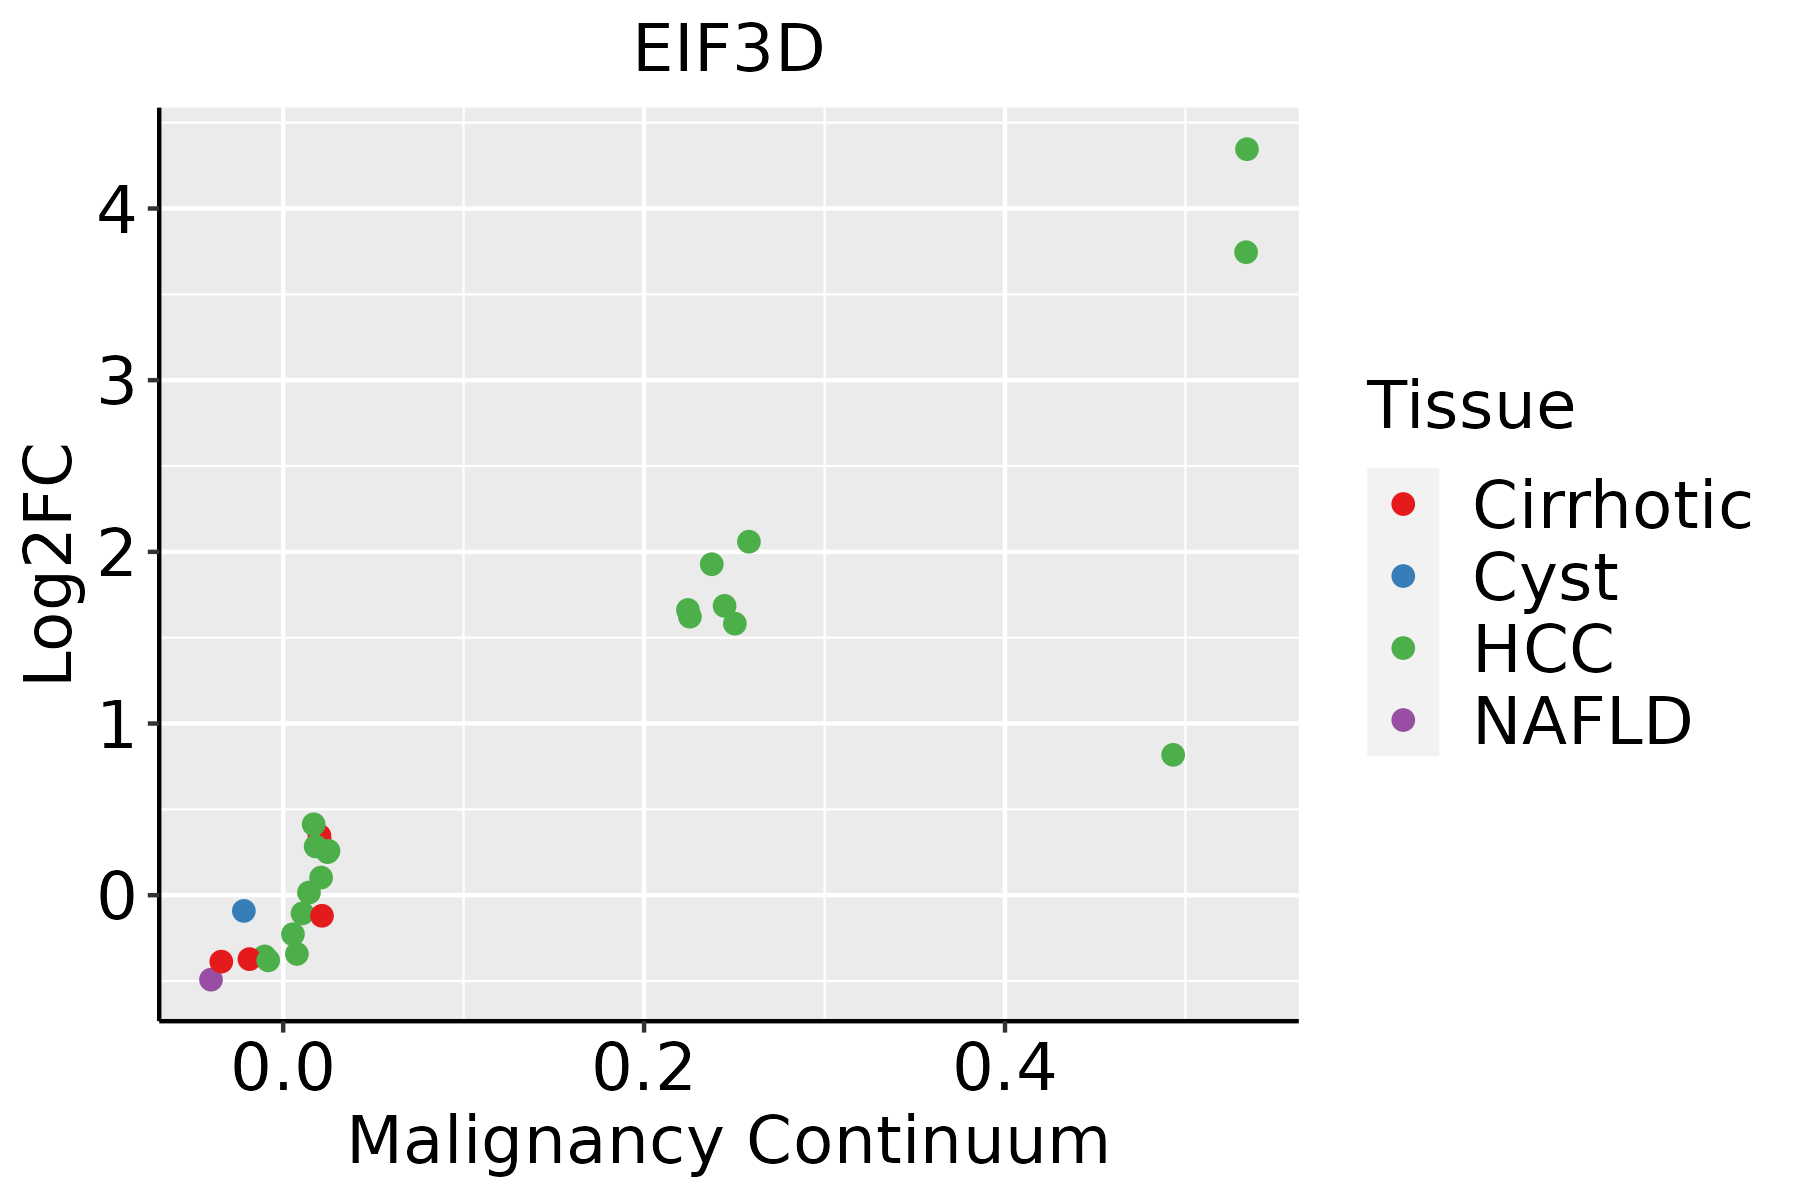
HCC: Hepatocellular carcinoma
NAFLD: Non-alcoholic fatty liver disease
Oral CavityThe image shows the transcriptomic changes along malignancy continuum.log2FC in expression of this searched gene in stem-like cells from each diseased tissue sample relative to stem-like cells in normal samples in each tissue plotted against the malignancy continuum. Samples are colored based on if they are from different disease stage.
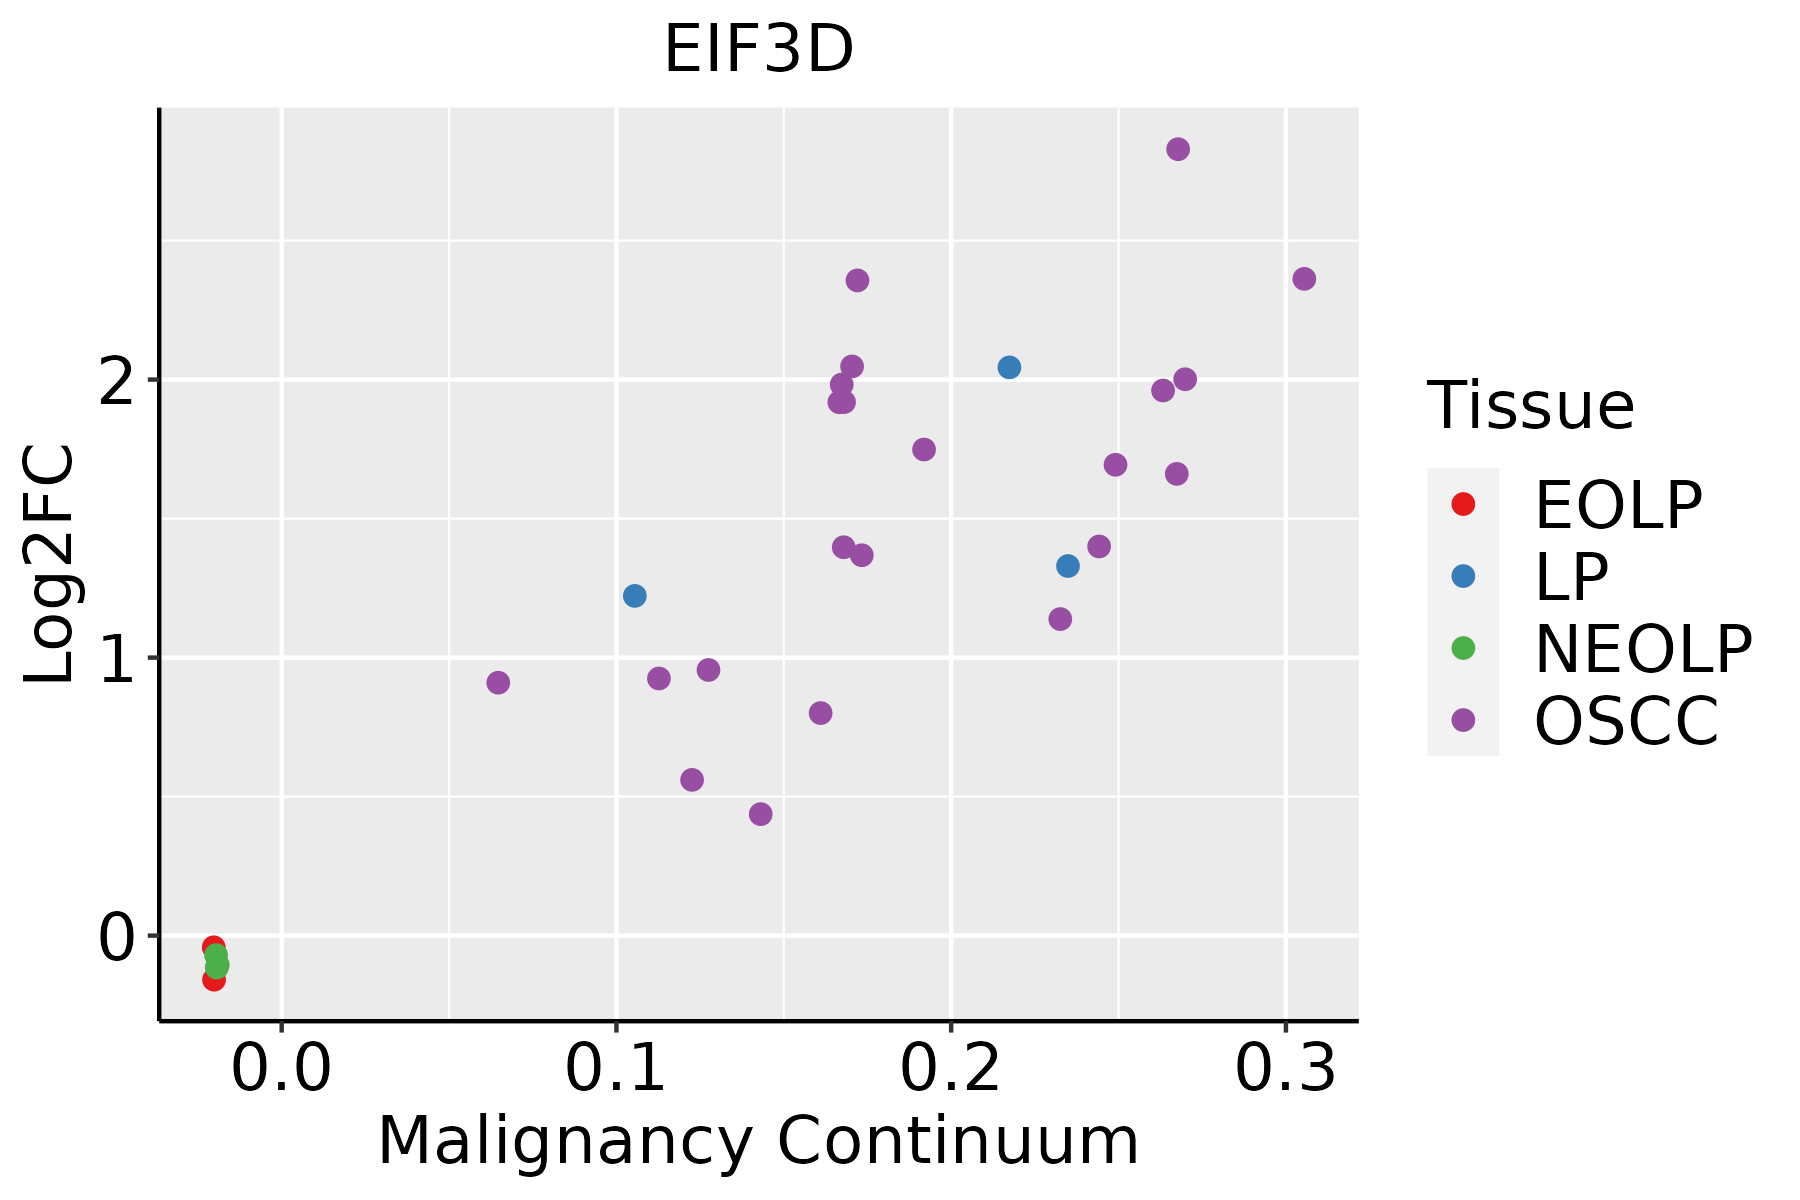
EOLP: Erosive Oral lichen planus
LP: leukoplakia
NEOLP: Non-erosive oral lichen planus
OSCC: Oral squamous cell carcinoma
ProstateThe image shows the transcriptomic changes along malignancy continuum.log2FC in expression of this searched gene in stem-like cells from each diseased tissue sample relative to stem-like cells in normal samples in each tissue plotted against the malignancy continuum. Samples are colored based on if they are from different disease stage.
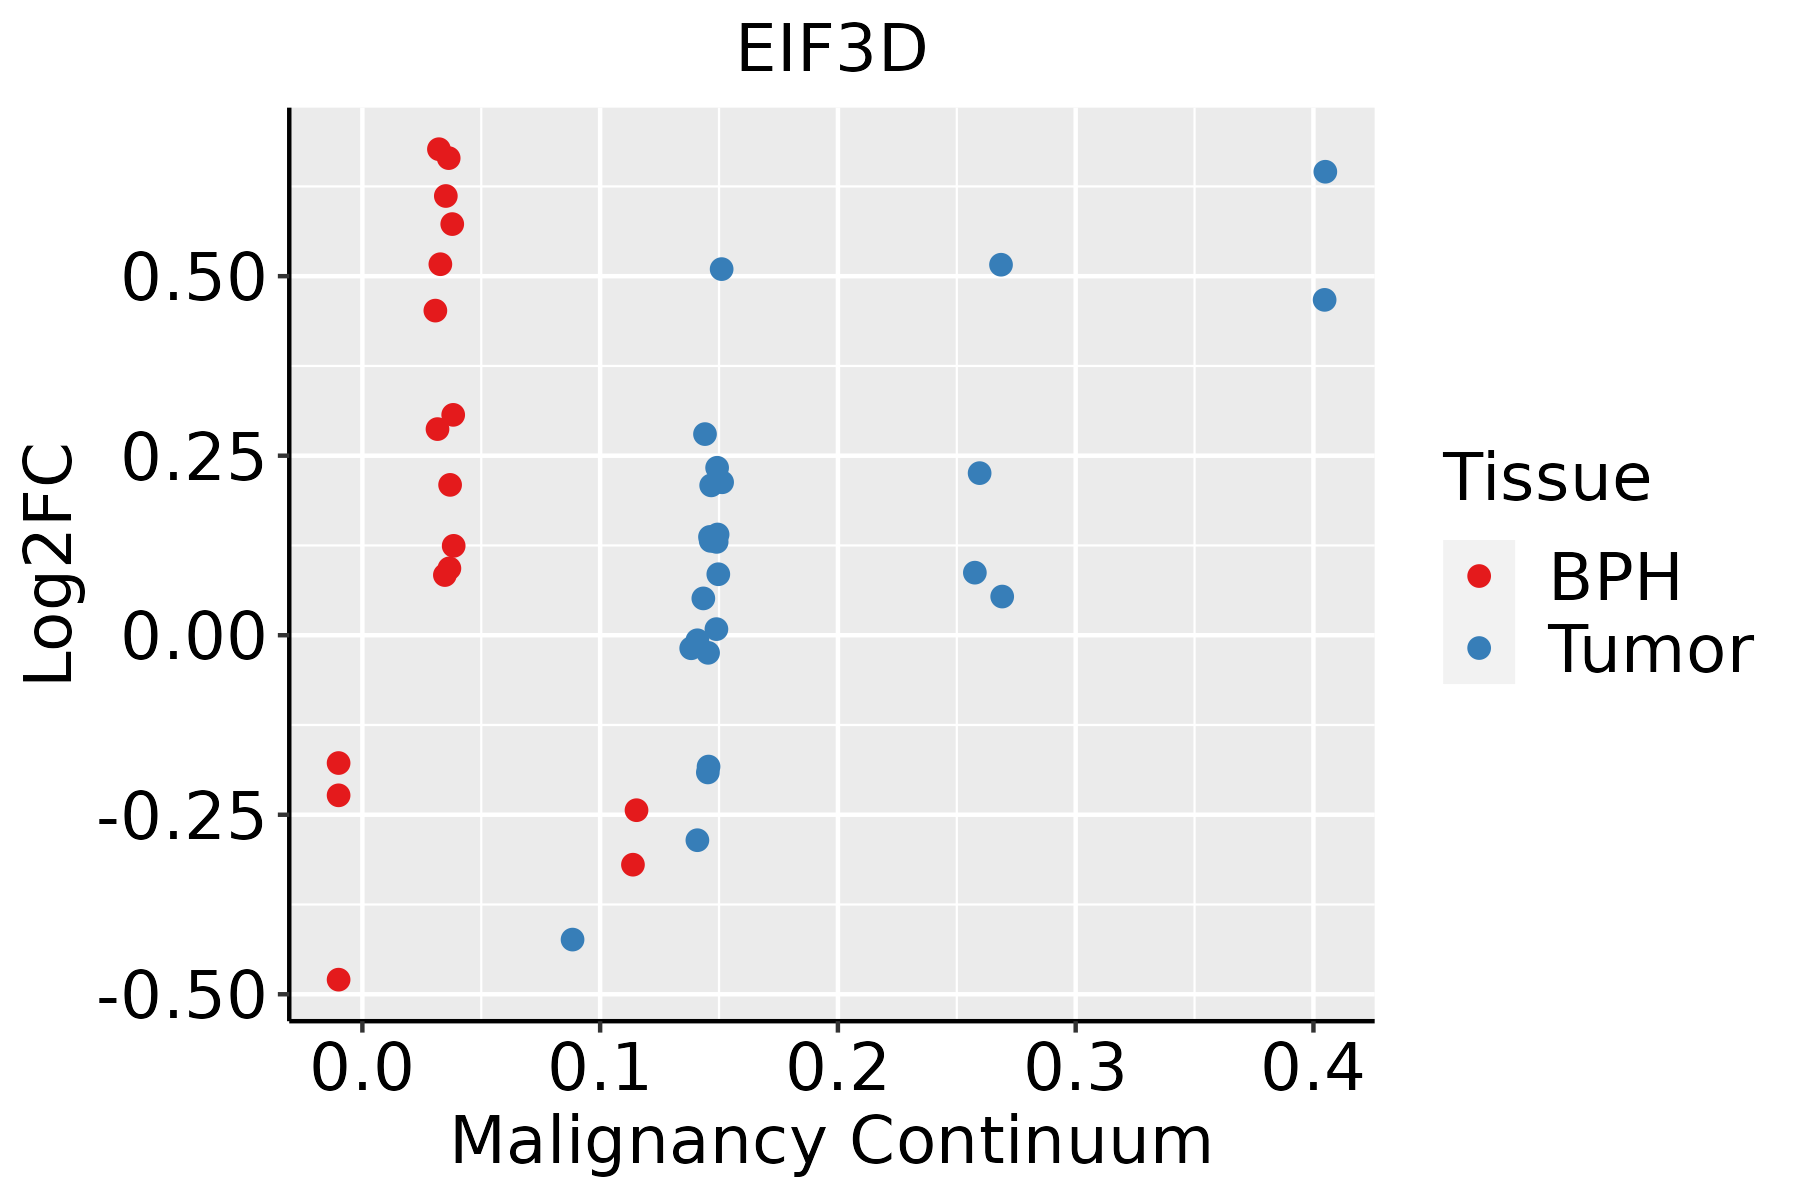
BPH: Benign Prostatic Hyperplasia
SkinThe image shows the transcriptomic changes along malignancy continuum.log2FC in expression of this searched gene in stem-like cells from each diseased tissue sample relative to stem-like cells in normal samples in each tissue plotted against the malignancy continuum. Samples are colored based on if they are from different disease stage.
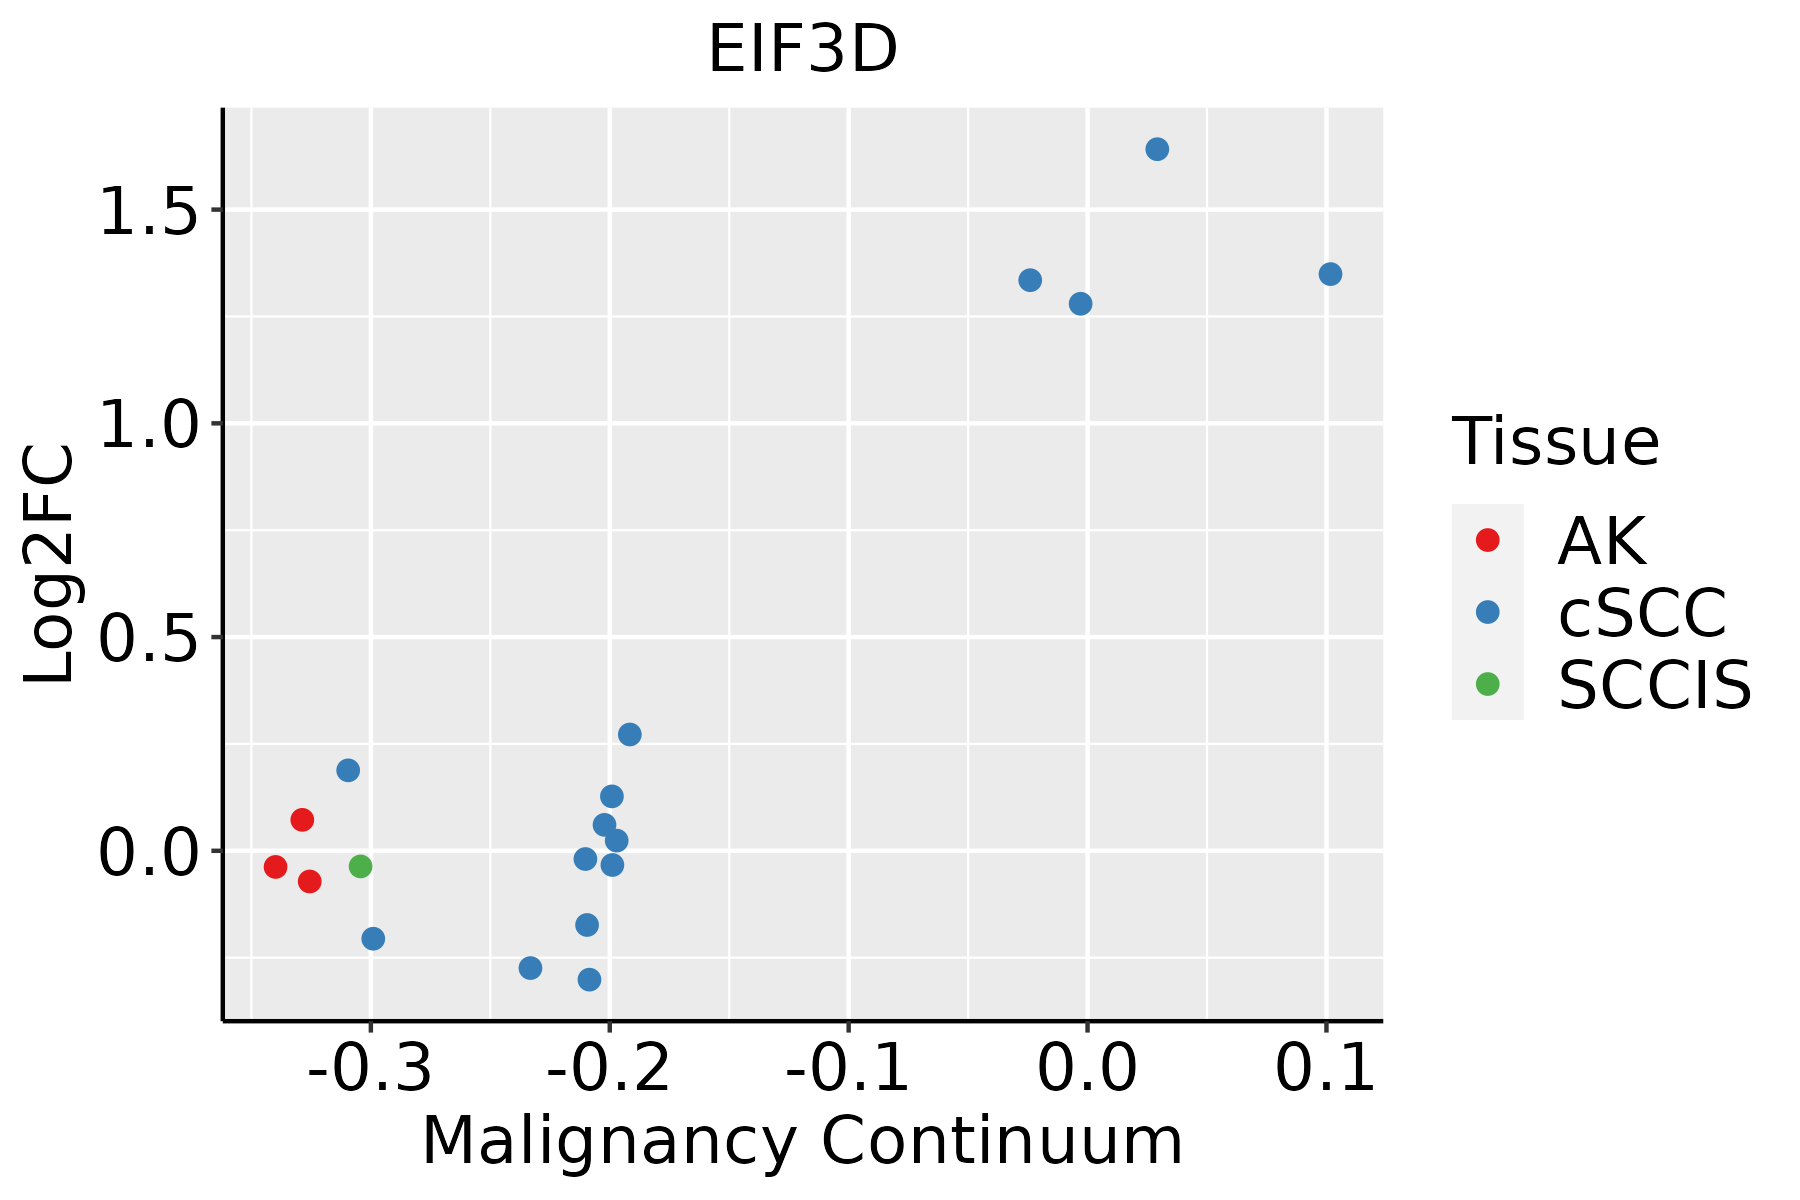
AK: Actinic keratosis
cSCC: Cutaneous squamous cell carcinoma
SCCIS:squamous cell carcinoma in situ
ThyroidThe image shows the transcriptomic changes along malignancy continuum.log2FC in expression of this searched gene in stem-like cells from each diseased tissue sample relative to stem-like cells in normal samples in each tissue plotted against the malignancy continuum. Samples are colored based on if they are from different disease stage.
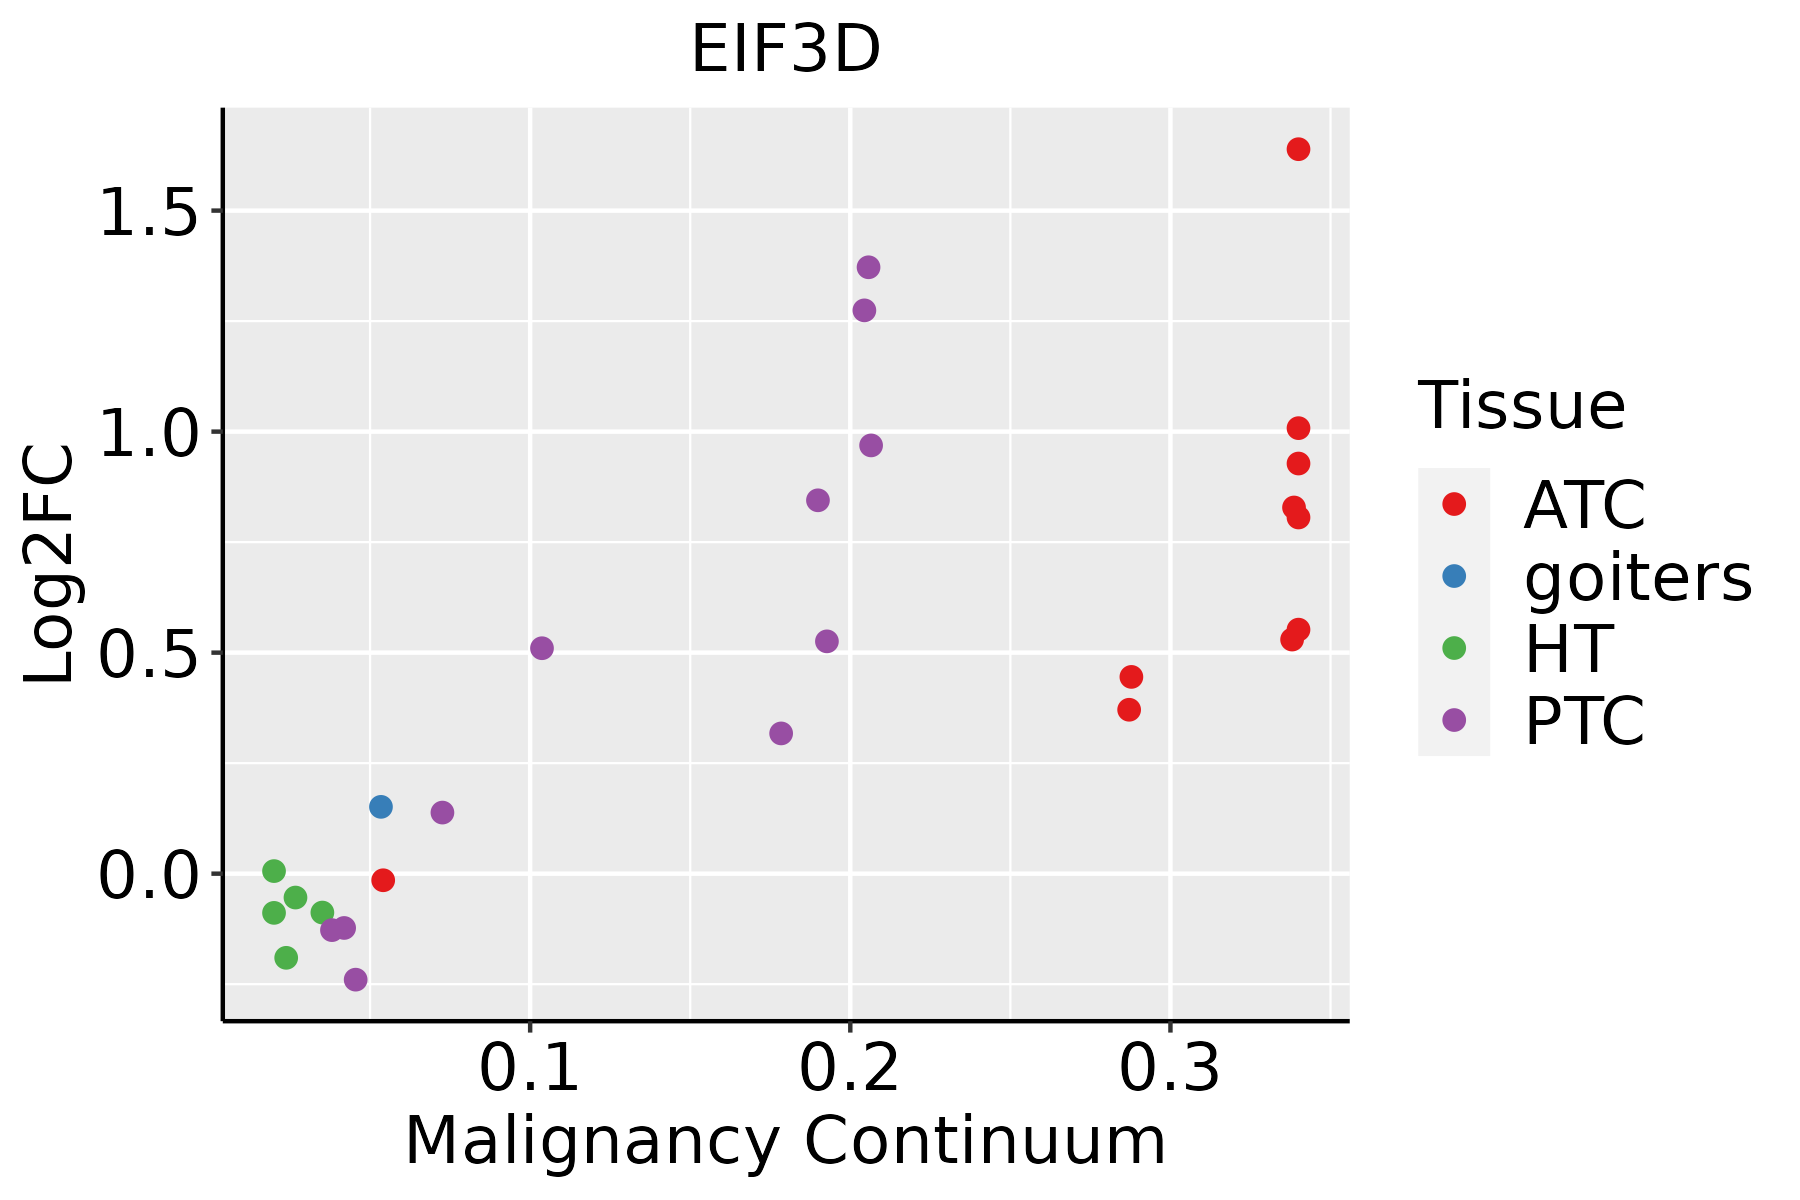
ATC: Anaplastic thyroid cancer
HT: Hashimoto's thyroiditis
PTC: Papillary thyroid cancer
∗log2FC in expression of this searched gene in stem-like cells from each diseased tissue sample relative to stem-like cells in normal samples in each tissue plotted against the malignancy continuum. Samples are colored based on if they are from different disease stage.

Top

Malignant transformation related pathway analysis

check buttonFind out the enriched GO biological processes and KEGG pathways involved in transition from healthy to precancer to cancer
check button Figure of enriched GO biological processes.
TissueDisease StageEnriched GO biological Processes
ColorectumADGO analysis - Figure of enriched GO biological processes: Top 15 enriched GO BP terms are showed in the bar plot of each disease state in each tissue. Each row represents a significant GO biological process which is colored according to the -log10(p.adjust).
ColorectumSERGO analysis - Figure of enriched GO biological processes: Top 15 enriched GO BP terms are showed in the bar plot of each disease state in each tissue. Each row represents a significant GO biological process which is colored according to the -log10(p.adjust).
ColorectumMSSGO analysis - Figure of enriched GO biological processes: Top 15 enriched GO BP terms are showed in the bar plot of each disease state in each tissue. Each row represents a significant GO biological process which is colored according to the -log10(p.adjust).
ColorectumMSI-HGO analysis - Figure of enriched GO biological processes: Top 15 enriched GO BP terms are showed in the bar plot of each disease state in each tissue. Each row represents a significant GO biological process which is colored according to the -log10(p.adjust).
ColorectumFAPGO analysis - Figure of enriched GO biological processes: Top 15 enriched GO BP terms are showed in the bar plot of each disease state in each tissue. Each row represents a significant GO biological process which is colored according to the -log10(p.adjust).
∗Top 15 enriched GO BP terms are showed in the bar plot of each disease state in each tissue. Each row represents a significant GO biological process which is colored according to the -log10(p.adjust).
Page: 1 2 3 4 5 6 7 8 9 

check button Enriched GO biological processes.
GO IDTissueDisease StageDescriptionGene RatioBg Ratiopvaluep.adjustCount
GO:00021819BreastPrecancercytoplasmic translation80/1080148/187231.59e-598.54e-5680
GO:00226139BreastPrecancerribonucleoprotein complex biogenesis79/1080463/187232.11e-181.03e-1579
GO:00718269BreastPrecancerribonucleoprotein complex subunit organization48/1080227/187232.68e-158.45e-1348
GO:00226189BreastPrecancerribonucleoprotein complex assembly47/1080220/187233.47e-151.03e-1247
GO:00064138BreastPrecancertranslational initiation30/1080118/187233.23e-125.58e-1030
GO:00064179BreastPrecancerregulation of translation67/1080468/187234.71e-127.64e-1067
GO:00457279BreastPrecancerpositive regulation of translation32/1080136/187235.89e-129.27e-1032
GO:00342509BreastPrecancerpositive regulation of cellular amide metabolic process33/1080162/187231.72e-101.77e-0833
GO:00160329BreastPrecancerviral process58/1080415/187233.42e-103.16e-0858
GO:00021838BreastPrecancercytoplasmic translational initiation11/108034/187231.87e-066.63e-0511
GO:00510989BreastPrecancerregulation of binding44/1080363/187232.59e-068.65e-0544
GO:00017328BreastPrecancerformation of cytoplasmic translation initiation complex7/108016/187231.50e-053.71e-047
GO:00510999BreastPrecancerpositive regulation of binding23/1080173/187231.58e-042.68e-0323
GO:000218114BreastIDCcytoplasmic translation82/1434148/187232.60e-521.48e-4882
GO:002261314BreastIDCribonucleoprotein complex biogenesis83/1434463/187232.01e-135.20e-1183
GO:007182614BreastIDCribonucleoprotein complex subunit organization52/1434227/187235.18e-131.21e-1052
GO:002261814BreastIDCribonucleoprotein complex assembly51/1434220/187235.32e-131.21e-1051
GO:001603214BreastIDCviral process75/1434415/187231.98e-124.02e-1075
GO:000641313BreastIDCtranslational initiation31/1434118/187237.29e-107.52e-0831
GO:000641714BreastIDCregulation of translation74/1434468/187231.67e-091.53e-0774
Page: 1 2 3 4 5 6 7 8 9 10 11 12 13 14 15 16 17 

check button Enriched KEGG pathways.
Pathway IDTissueDisease StageDescriptionGene RatioBg Ratiopvaluep.adjustqvalueCount
Page: 1 

Top

Cell-cell communication analysis

check buttonIdentification of potential cell-cell interactions between two cell types and their ligand-receptor pairs for different disease states
LigandReceptorLRpairPathwayTissueDisease Stage
Page: 1 

Top

Single-cell gene regulatory network inference analysis

check buttonFind out the significant the regulons (TFs) and the target genes of each regulon across cell types for different disease states
TFCell TypeTissueDisease StageTarget GeneRSSRegulon Activity
∗The dot plots of a searched regulon are shown for all cell subpopulations in each disease state of each tissue based on the regulon specific score inferred using pySCENIC and by calculating the average expression.
Page: 1 

Top

Somatic mutation of malignant transformation related genes

check buttonAnnotation of somatic variants for genes involved in malignant transformation
Hugo SymbolVariant ClassVariant ClassificationdbSNP RSHGVScHGVSpHGVSp ShortSWISSPROTBIOTYPESIFTPolyPhenTumor Sample BarcodeTissueHistologySexAgeStageTherapy TypesDrugsOutcome
EIF3DSNVMissense_Mutationrs761711093c.89N>Cp.Tyr30Serp.Y30SO15371protein_codingdeleterious(0)probably_damaging(0.972)TCGA-A2-A0CS-01Breastbreast invasive carcinomaFemale>=65III/IVHormone TherapyanastrozoleSD
EIF3DSNVMissense_Mutationrs761711093c.89A>Cp.Tyr30Serp.Y30SO15371protein_codingdeleterious(0)probably_damaging(0.972)TCGA-A2-A1FW-01Breastbreast invasive carcinomaFemale<65III/IVChemotherapycytoxanSD
EIF3DSNVMissense_Mutationrs761711093c.89N>Cp.Tyr30Serp.Y30SO15371protein_codingdeleterious(0)probably_damaging(0.972)TCGA-A2-A1G0-01Breastbreast invasive carcinomaFemale<65I/IIChemotherapytaxotereSD
EIF3DSNVMissense_Mutationrs761711093c.89N>Cp.Tyr30Serp.Y30SO15371protein_codingdeleterious(0)probably_damaging(0.972)TCGA-A2-A1G4-01Breastbreast invasive carcinomaFemale>=65III/IVChemotherapyadriamycinSD
EIF3DSNVMissense_Mutationnovelc.892N>Ap.Pro298Thrp.P298TO15371protein_codingdeleterious(0)probably_damaging(0.994)TCGA-AR-A0TY-01Breastbreast invasive carcinomaFemale<65I/IIUnspecificPaclitaxelPD
EIF3DSNVMissense_Mutationrs761711093c.89N>Cp.Tyr30Serp.Y30SO15371protein_codingdeleterious(0)probably_damaging(0.972)TCGA-BH-A0HU-01Breastbreast invasive carcinomaFemale<65I/IIChemotherapydocetaxelSD
EIF3DSNVMissense_Mutationrs761711093c.89N>Cp.Tyr30Serp.Y30SO15371protein_codingdeleterious(0)probably_damaging(0.972)TCGA-D8-A1JD-01Breastbreast invasive carcinomaFemale<65I/IIChemotherapyadriamycinSD
EIF3DSNVMissense_Mutationrs761711093c.89N>Cp.Tyr30Serp.Y30SO15371protein_codingdeleterious(0)probably_damaging(0.972)TCGA-D8-A1JK-01Breastbreast invasive carcinomaFemale>=65I/IIUnknownUnknownSD
EIF3DSNVMissense_Mutationrs761711093c.89N>Cp.Tyr30Serp.Y30SO15371protein_codingdeleterious(0)probably_damaging(0.972)TCGA-D8-A1X6-01Breastbreast invasive carcinomaFemale>=65III/IVHormone TherapytamoxiphenSD
EIF3DSNVMissense_Mutationrs761711093c.89N>Cp.Tyr30Serp.Y30SO15371protein_codingdeleterious(0)probably_damaging(0.972)TCGA-D8-A1XG-01Breastbreast invasive carcinomaFemale>=65III/IVUnknownUnknownSD
Page: 1 2 3 4 5 6 

Top

Related drugs of malignant transformation related genes

check buttonIdentification of chemicals and drugs interact with genes involved in malignant transfromation
(DGIdb 4.0)
Entrez IDSymbolCategoryInteraction TypesDrug Claim NameDrug NamePMIDs
Page: 1