
|
|||||
|
 | |
| |
| |
| |
| |
| |
|
Gene: EIF3C |
Gene summary for EIF3C |
| Gene information | Species | Human | Gene symbol | EIF3C | Gene ID | 8663 |
| Gene name | eukaryotic translation initiation factor 3 subunit C | |
| Gene Alias | EIF3CL | |
| Cytomap | 16p11.2 | |
| Gene Type | protein-coding | GO ID | GO:0001732 | UniProtAcc | A0A024QYU9 |
Top |
Malignant transformation analysis |
| Identification of the aberrant gene expression in precancerous and cancerous lesions by comparing the gene expression of stem-like cells in diseased tissues with normal stem cells |
| Entrez ID | Symbol | Replicates | Species | Organ | Tissue | Adj P-value | Log2FC | Malignancy |
| 8663 | EIF3C | HTA11_3410_2000001011 | Human | Colorectum | AD | 8.69e-28 | 5.84e-01 | 0.0155 |
| 8663 | EIF3C | HTA11_2487_2000001011 | Human | Colorectum | SER | 1.89e-34 | 1.03e+00 | -0.1808 |
| 8663 | EIF3C | HTA11_2951_2000001011 | Human | Colorectum | AD | 4.43e-19 | 1.10e+00 | 0.0216 |
| 8663 | EIF3C | HTA11_1938_2000001011 | Human | Colorectum | AD | 6.23e-47 | 1.24e+00 | -0.0811 |
| 8663 | EIF3C | HTA11_78_2000001011 | Human | Colorectum | AD | 3.92e-47 | 1.36e+00 | -0.1088 |
| 8663 | EIF3C | HTA11_347_2000001011 | Human | Colorectum | AD | 1.23e-47 | 9.02e-01 | -0.1954 |
| 8663 | EIF3C | HTA11_411_2000001011 | Human | Colorectum | SER | 4.58e-20 | 1.43e+00 | -0.2602 |
| 8663 | EIF3C | HTA11_2112_2000001011 | Human | Colorectum | SER | 8.84e-15 | 1.03e+00 | -0.2196 |
| 8663 | EIF3C | HTA11_3361_2000001011 | Human | Colorectum | AD | 2.49e-36 | 1.29e+00 | -0.1207 |
| 8663 | EIF3C | HTA11_83_2000001011 | Human | Colorectum | SER | 6.63e-22 | 7.71e-01 | -0.1526 |
| 8663 | EIF3C | HTA11_696_2000001011 | Human | Colorectum | AD | 2.71e-74 | 1.40e+00 | -0.1464 |
| 8663 | EIF3C | HTA11_866_2000001011 | Human | Colorectum | AD | 9.06e-57 | 1.06e+00 | -0.1001 |
| 8663 | EIF3C | HTA11_1391_2000001011 | Human | Colorectum | AD | 6.55e-65 | 1.71e+00 | -0.059 |
| 8663 | EIF3C | HTA11_2992_2000001011 | Human | Colorectum | SER | 1.68e-23 | 1.24e+00 | -0.1706 |
| 8663 | EIF3C | HTA11_5212_2000001011 | Human | Colorectum | AD | 4.45e-12 | 7.04e-01 | -0.2061 |
| 8663 | EIF3C | HTA11_5216_2000001011 | Human | Colorectum | SER | 7.65e-23 | 1.01e+00 | -0.1462 |
| 8663 | EIF3C | HTA11_546_2000001011 | Human | Colorectum | AD | 1.64e-27 | 1.05e+00 | -0.0842 |
| 8663 | EIF3C | HTA11_9341_2000001011 | Human | Colorectum | SER | 4.07e-17 | 1.19e+00 | -0.00410000000000005 |
| 8663 | EIF3C | HTA11_7862_2000001011 | Human | Colorectum | AD | 1.88e-24 | 8.28e-01 | -0.0179 |
| 8663 | EIF3C | HTA11_866_3004761011 | Human | Colorectum | AD | 1.79e-67 | 1.32e+00 | 0.096 |
| Page: 1 2 3 4 5 6 |
| Tissue | Expression Dynamics | Abbreviation |
| Colorectum (GSE201348) |  | FAP: Familial adenomatous polyposis |
| CRC: Colorectal cancer | ||
| Colorectum (HTA11) |  | AD: Adenomas |
| SER: Sessile serrated lesions | ||
| MSI-H: Microsatellite-high colorectal cancer | ||
| MSS: Microsatellite stable colorectal cancer | ||
| Endometrium | 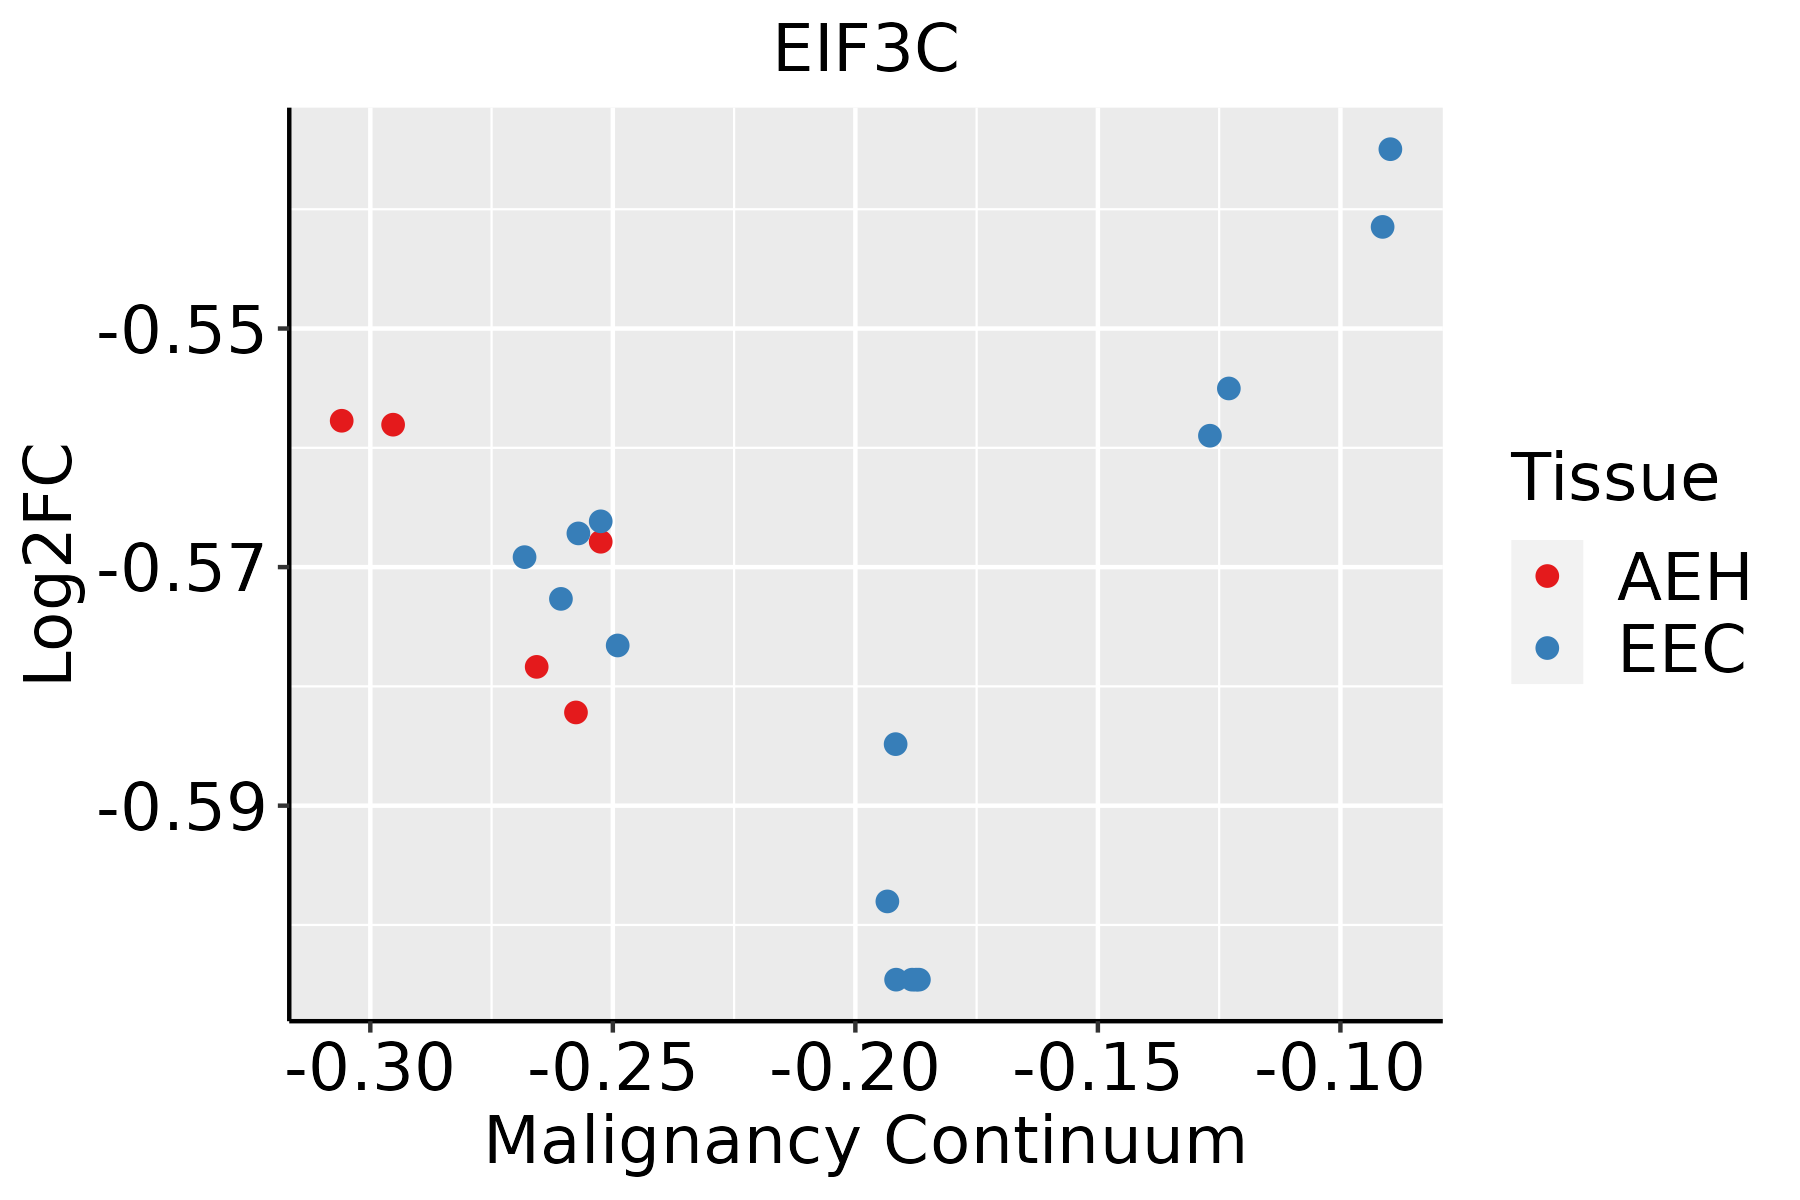 | AEH: Atypical endometrial hyperplasia |
| EEC: Endometrioid Cancer | ||
| Esophagus | 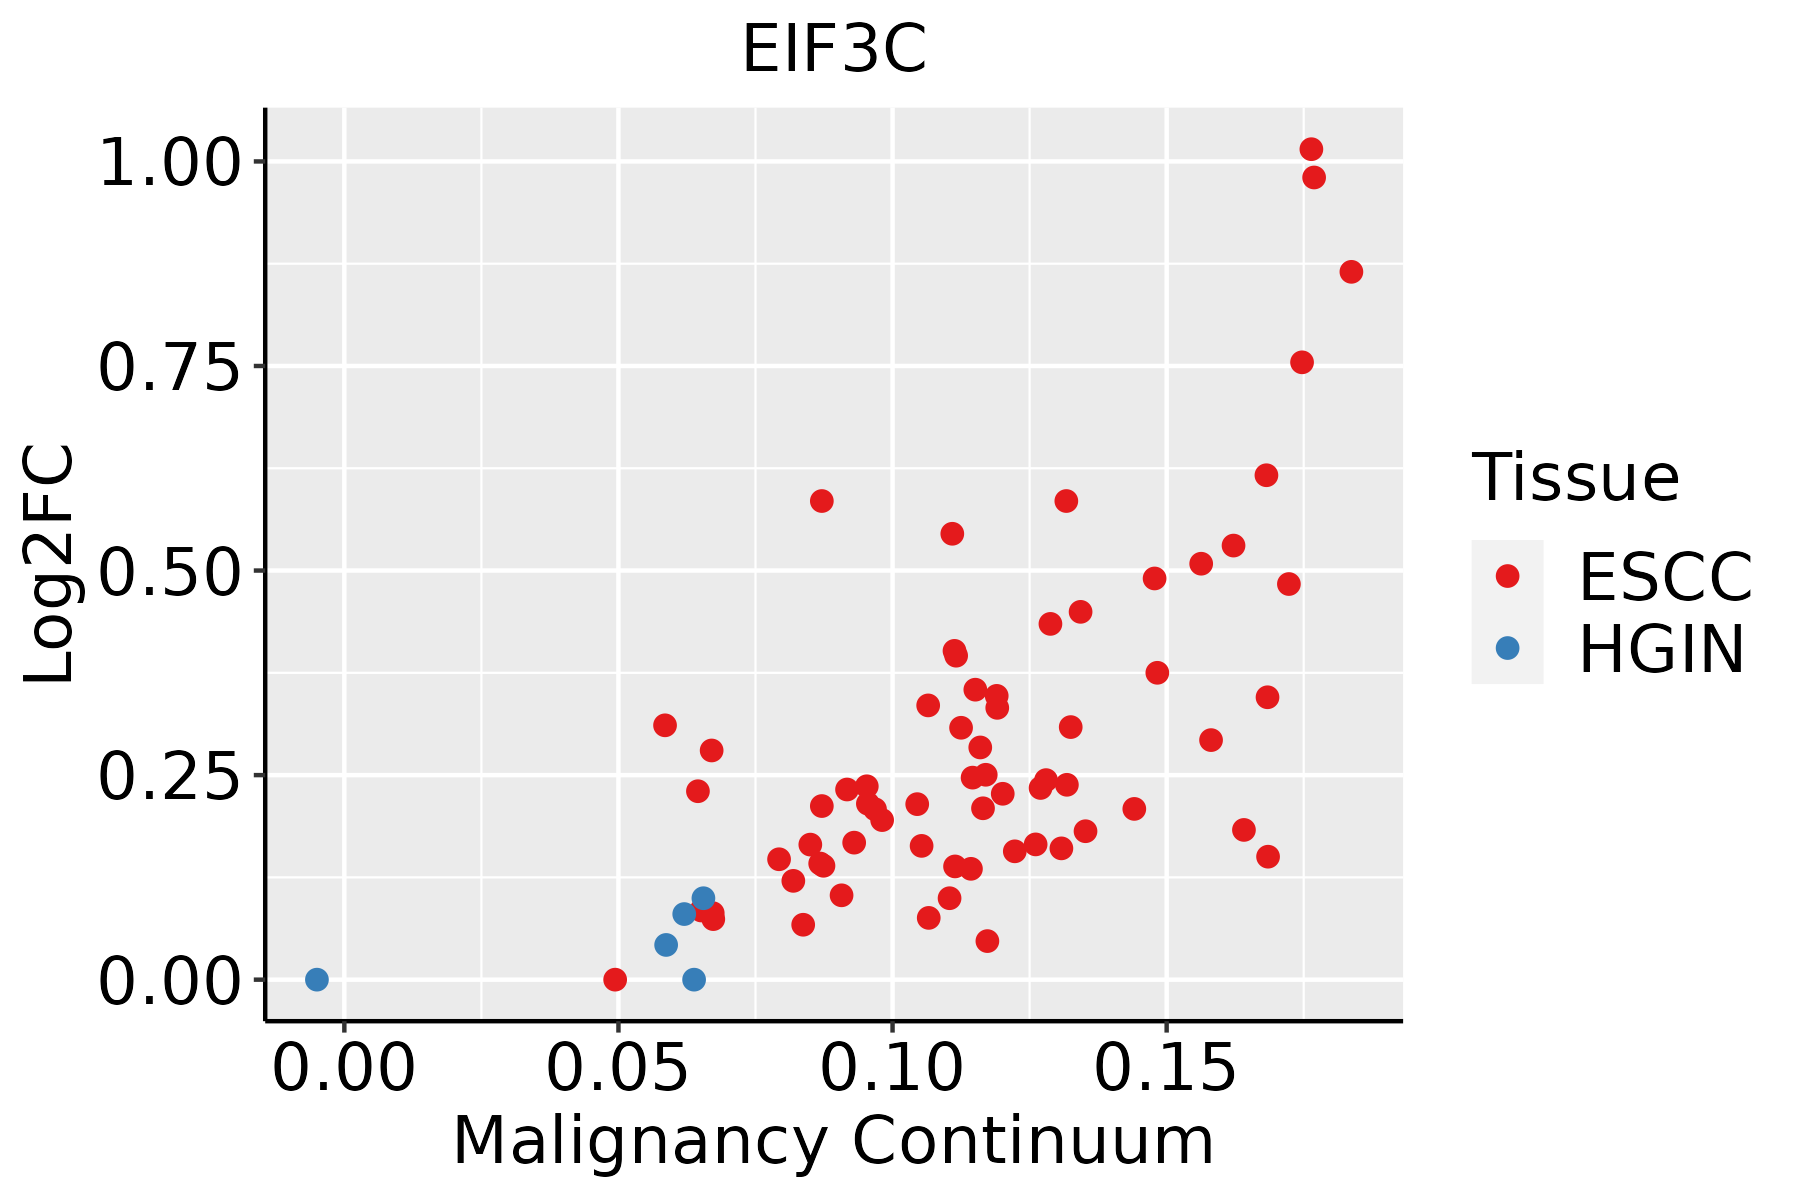 | ESCC: Esophageal squamous cell carcinoma |
| HGIN: High-grade intraepithelial neoplasias | ||
| LGIN: Low-grade intraepithelial neoplasias |
| ∗log2FC in expression of this searched gene in stem-like cells from each diseased tissue sample relative to stem-like cells in normal samples in each tissue plotted against the malignancy continuum. Samples are colored based on if they are from different disease stage. |
Top |
Malignant transformation related pathway analysis |
| Find out the enriched GO biological processes and KEGG pathways involved in transition from healthy to precancer to cancer |
| Tissue | Disease Stage | Enriched GO biological Processes |
| Colorectum | AD |  |
| Colorectum | SER |  |
| Colorectum | MSS |  |
| Colorectum | MSI-H |  |
| Colorectum | FAP |  |
| ∗Top 15 enriched GO BP terms are showed in the bar plot of each disease state in each tissue. Each row represents a significant GO biological process which is colored according to the -log10(p.adjust). |
| Page: 1 2 3 4 5 6 7 8 9 |
| GO ID | Tissue | Disease Stage | Description | Gene Ratio | Bg Ratio | pvalue | p.adjust | Count |
| GO:0002181 | Colorectum | AD | cytoplasmic translation | 109/3918 | 148/18723 | 3.40e-43 | 2.13e-39 | 109 |
| GO:0022618 | Colorectum | AD | ribonucleoprotein complex assembly | 92/3918 | 220/18723 | 1.49e-12 | 2.60e-10 | 92 |
| GO:0071826 | Colorectum | AD | ribonucleoprotein complex subunit organization | 94/3918 | 227/18723 | 1.70e-12 | 2.87e-10 | 94 |
| GO:0051098 | Colorectum | AD | regulation of binding | 126/3918 | 363/18723 | 6.01e-10 | 4.88e-08 | 126 |
| GO:0022613 | Colorectum | AD | ribonucleoprotein complex biogenesis | 151/3918 | 463/18723 | 1.96e-09 | 1.39e-07 | 151 |
| GO:0051099 | Colorectum | AD | positive regulation of binding | 66/3918 | 173/18723 | 1.47e-07 | 6.64e-06 | 66 |
| GO:0002183 | Colorectum | AD | cytoplasmic translational initiation | 21/3918 | 34/18723 | 2.73e-07 | 1.09e-05 | 21 |
| GO:0001732 | Colorectum | AD | formation of cytoplasmic translation initiation complex | 13/3918 | 16/18723 | 4.27e-07 | 1.64e-05 | 13 |
| GO:0006417 | Colorectum | AD | regulation of translation | 141/3918 | 468/18723 | 1.32e-06 | 4.22e-05 | 141 |
| GO:0006413 | Colorectum | AD | translational initiation | 45/3918 | 118/18723 | 1.35e-05 | 2.92e-04 | 45 |
| GO:0034250 | Colorectum | AD | positive regulation of cellular amide metabolic process | 53/3918 | 162/18723 | 2.98e-04 | 3.60e-03 | 53 |
| GO:0045727 | Colorectum | AD | positive regulation of translation | 45/3918 | 136/18723 | 6.24e-04 | 6.48e-03 | 45 |
| GO:00021811 | Colorectum | SER | cytoplasmic translation | 102/2897 | 148/18723 | 1.38e-48 | 8.49e-45 | 102 |
| GO:00226181 | Colorectum | SER | ribonucleoprotein complex assembly | 69/2897 | 220/18723 | 2.25e-09 | 2.15e-07 | 69 |
| GO:00718261 | Colorectum | SER | ribonucleoprotein complex subunit organization | 70/2897 | 227/18723 | 3.83e-09 | 3.51e-07 | 70 |
| GO:00510981 | Colorectum | SER | regulation of binding | 97/2897 | 363/18723 | 1.98e-08 | 1.43e-06 | 97 |
| GO:00021831 | Colorectum | SER | cytoplasmic translational initiation | 18/2897 | 34/18723 | 4.42e-07 | 2.24e-05 | 18 |
| GO:00226131 | Colorectum | SER | ribonucleoprotein complex biogenesis | 112/2897 | 463/18723 | 5.01e-07 | 2.48e-05 | 112 |
| GO:00017321 | Colorectum | SER | formation of cytoplasmic translation initiation complex | 10/2897 | 16/18723 | 2.52e-05 | 6.96e-04 | 10 |
| GO:00064131 | Colorectum | SER | translational initiation | 36/2897 | 118/18723 | 2.84e-05 | 7.63e-04 | 36 |
| Page: 1 2 3 4 5 |
| Pathway ID | Tissue | Disease Stage | Description | Gene Ratio | Bg Ratio | pvalue | p.adjust | qvalue | Count |
| Page: 1 |
Top |
Cell-cell communication analysis |
| Identification of potential cell-cell interactions between two cell types and their ligand-receptor pairs for different disease states |
| Ligand | Receptor | LRpair | Pathway | Tissue | Disease Stage |
| Page: 1 |
Top |
Single-cell gene regulatory network inference analysis |
| Find out the significant the regulons (TFs) and the target genes of each regulon across cell types for different disease states |
| TF | Cell Type | Tissue | Disease Stage | Target Gene | RSS | Regulon Activity |
| ∗The dot plots of a searched regulon are shown for all cell subpopulations in each disease state of each tissue based on the regulon specific score inferred using pySCENIC and by calculating the average expression. |
| Page: 1 |
Top |
Somatic mutation of malignant transformation related genes |
| Annotation of somatic variants for genes involved in malignant transformation |
| Hugo Symbol | Variant Class | Variant Classification | dbSNP RS | HGVSc | HGVSp | HGVSp Short | SWISSPROT | BIOTYPE | SIFT | PolyPhen | Tumor Sample Barcode | Tissue | Histology | Sex | Age | Stage | Therapy Types | Drugs | Outcome |
| EIF3C | SNV | Missense_Mutation | c.964N>T | p.Thr322Ser | p.T322S | Q99613 | protein_coding | tolerated(0.17) | probably_damaging(0.989) | TCGA-A8-A09Z-01 | Breast | breast invasive carcinoma | Female | >=65 | I/II | Unknown | Unknown | SD | |
| EIF3C | SNV | Missense_Mutation | c.801N>C | p.Lys267Asn | p.K267N | Q99613 | protein_coding | tolerated(0.18) | benign(0.399) | TCGA-JW-A5VL-01 | Cervix | cervical & endocervical cancer | Female | <65 | I/II | Unknown | Unknown | SD | |
| EIF3C | SNV | Missense_Mutation | c.832G>A | p.Ala278Thr | p.A278T | Q99613 | protein_coding | tolerated(0.45) | benign(0.029) | TCGA-G4-6588-01 | Colorectum | colon adenocarcinoma | Female | <65 | I/II | Unknown | Unknown | SD | |
| EIF3C | SNV | Missense_Mutation | novel | c.1015G>A | p.Ala339Thr | p.A339T | Q99613 | protein_coding | deleterious(0.04) | probably_damaging(0.949) | TCGA-AP-A0LN-01 | Endometrium | uterine corpus endometrioid carcinoma | Female | <65 | I/II | Unknown | Unknown | SD |
| EIF3C | SNV | Missense_Mutation | novel | c.784A>G | p.Thr262Ala | p.T262A | Q99613 | protein_coding | tolerated(0.73) | benign(0) | TCGA-AX-A0J0-01 | Endometrium | uterine corpus endometrioid carcinoma | Female | <65 | I/II | Unknown | Unknown | SD |
| EIF3C | SNV | Missense_Mutation | novel | c.778N>A | p.Ala260Thr | p.A260T | Q99613 | protein_coding | tolerated(0.57) | benign(0.009) | TCGA-AX-A1CE-01 | Endometrium | uterine corpus endometrioid carcinoma | Female | <65 | I/II | Unspecific | Paclitaxel | SD |
| EIF3C | SNV | Missense_Mutation | rs766394588 | c.811N>A | p.Glu271Lys | p.E271K | Q99613 | protein_coding | tolerated(0.88) | benign(0.003) | TCGA-AX-A2HC-01 | Endometrium | uterine corpus endometrioid carcinoma | Female | <65 | III/IV | Chemotherapy | paclitaxel | PD |
| EIF3C | SNV | Missense_Mutation | novel | c.1039N>A | p.Arg347Ser | p.R347S | Q99613 | protein_coding | deleterious(0) | probably_damaging(0.995) | TCGA-AX-A2HC-01 | Endometrium | uterine corpus endometrioid carcinoma | Female | <65 | III/IV | Chemotherapy | paclitaxel | PD |
| EIF3C | SNV | Missense_Mutation | rs767062124 | c.993G>T | p.Lys331Asn | p.K331N | Q99613 | protein_coding | tolerated(0.15) | probably_damaging(0.997) | TCGA-D1-A16X-01 | Endometrium | uterine corpus endometrioid carcinoma | Female | <65 | I/II | Unknown | Unknown | SD |
| EIF3C | SNV | Missense_Mutation | rs757977079 | c.913N>T | p.Arg305Trp | p.R305W | Q99613 | protein_coding | deleterious(0) | benign(0.381) | TCGA-DF-A2KN-01 | Endometrium | uterine corpus endometrioid carcinoma | Female | Unknown | I/II | Unknown | Unknown | SD |
| Page: 1 2 |
Top |
Related drugs of malignant transformation related genes |
| Identification of chemicals and drugs interact with genes involved in malignant transfromation |
| (DGIdb 4.0) |
| Entrez ID | Symbol | Category | Interaction Types | Drug Claim Name | Drug Name | PMIDs |
| Page: 1 |

Copyright 2023-Present -The University of Texas Health Science Center at Houston |