
|
|||||
|
 | |
| |
| |
| |
| |
| |
|
Gene: EIF2S1 |
Gene summary for EIF2S1 |
| Gene information | Species | Human | Gene symbol | EIF2S1 | Gene ID | 1965 |
| Gene name | eukaryotic translation initiation factor 2 subunit alpha | |
| Gene Alias | EIF-2 | |
| Cytomap | 14q23.3 | |
| Gene Type | protein-coding | GO ID | GO:0006412 | UniProtAcc | P05198 |
Top |
Malignant transformation analysis |
| Identification of the aberrant gene expression in precancerous and cancerous lesions by comparing the gene expression of stem-like cells in diseased tissues with normal stem cells |
| Entrez ID | Symbol | Replicates | Species | Organ | Tissue | Adj P-value | Log2FC | Malignancy |
| 1965 | EIF2S1 | LZE2T | Human | Esophagus | ESCC | 3.15e-02 | 9.96e-01 | 0.082 |
| 1965 | EIF2S1 | LZE4T | Human | Esophagus | ESCC | 8.33e-11 | 6.93e-01 | 0.0811 |
| 1965 | EIF2S1 | LZE7T | Human | Esophagus | ESCC | 3.72e-07 | 3.49e-01 | 0.0667 |
| 1965 | EIF2S1 | LZE20T | Human | Esophagus | ESCC | 1.90e-06 | 2.84e-01 | 0.0662 |
| 1965 | EIF2S1 | LZE22D1 | Human | Esophagus | HGIN | 1.27e-06 | 5.92e-02 | 0.0595 |
| 1965 | EIF2S1 | LZE24T | Human | Esophagus | ESCC | 1.43e-09 | 4.14e-01 | 0.0596 |
| 1965 | EIF2S1 | LZE21T | Human | Esophagus | ESCC | 1.09e-04 | 1.54e-02 | 0.0655 |
| 1965 | EIF2S1 | LZE6T | Human | Esophagus | ESCC | 3.34e-09 | 5.31e-01 | 0.0845 |
| 1965 | EIF2S1 | P2T-E | Human | Esophagus | ESCC | 1.41e-21 | 3.55e-01 | 0.1177 |
| 1965 | EIF2S1 | P4T-E | Human | Esophagus | ESCC | 1.16e-27 | 9.12e-01 | 0.1323 |
| 1965 | EIF2S1 | P5T-E | Human | Esophagus | ESCC | 1.08e-32 | 9.27e-01 | 0.1327 |
| 1965 | EIF2S1 | P8T-E | Human | Esophagus | ESCC | 1.74e-22 | 4.20e-01 | 0.0889 |
| 1965 | EIF2S1 | P9T-E | Human | Esophagus | ESCC | 1.77e-10 | 2.83e-01 | 0.1131 |
| 1965 | EIF2S1 | P10T-E | Human | Esophagus | ESCC | 3.06e-43 | 7.94e-01 | 0.116 |
| 1965 | EIF2S1 | P11T-E | Human | Esophagus | ESCC | 1.20e-12 | 7.58e-01 | 0.1426 |
| 1965 | EIF2S1 | P12T-E | Human | Esophagus | ESCC | 1.70e-37 | 9.46e-01 | 0.1122 |
| 1965 | EIF2S1 | P15T-E | Human | Esophagus | ESCC | 1.81e-39 | 1.19e+00 | 0.1149 |
| 1965 | EIF2S1 | P16T-E | Human | Esophagus | ESCC | 8.88e-27 | 6.25e-01 | 0.1153 |
| 1965 | EIF2S1 | P17T-E | Human | Esophagus | ESCC | 1.72e-08 | 9.54e-01 | 0.1278 |
| 1965 | EIF2S1 | P19T-E | Human | Esophagus | ESCC | 1.03e-05 | 1.26e+00 | 0.1662 |
| Page: 1 2 3 4 5 6 7 |
| Tissue | Expression Dynamics | Abbreviation |
| Esophagus | 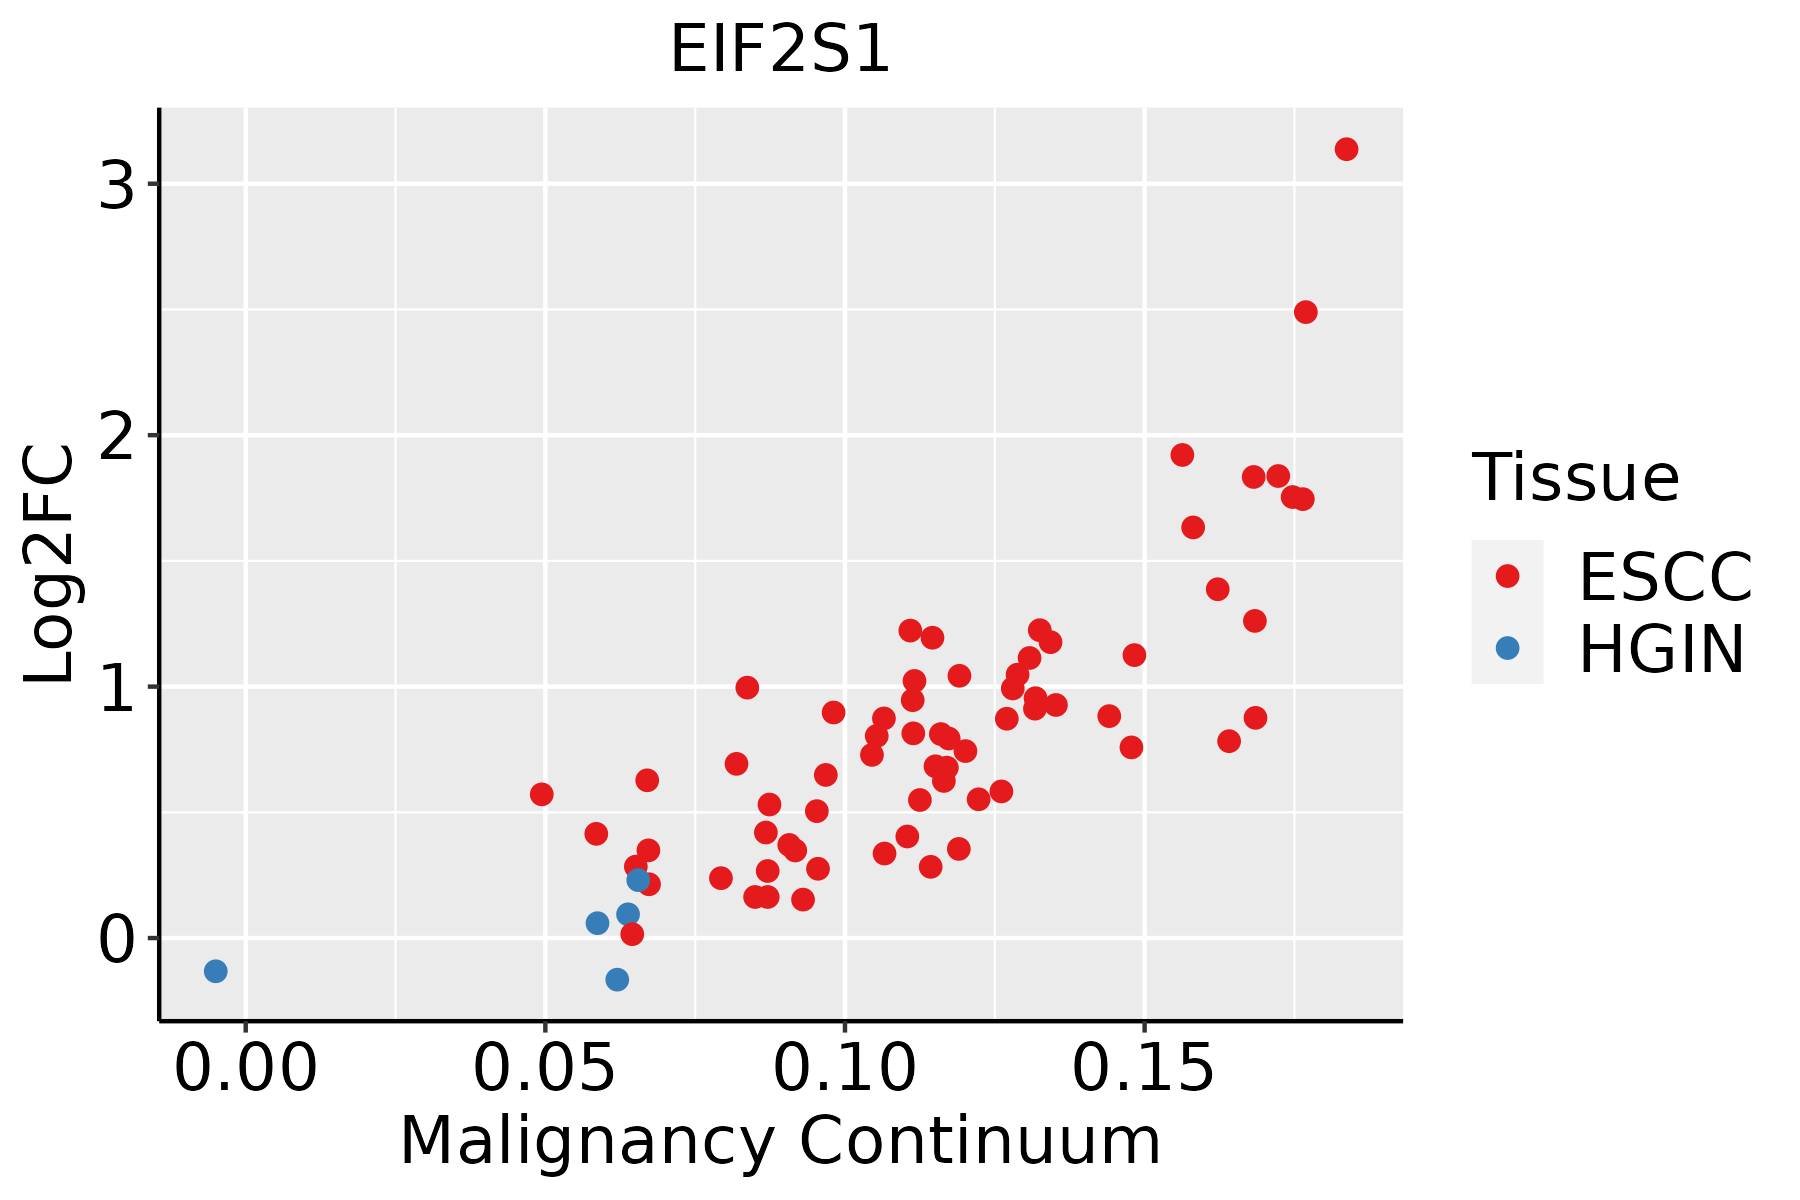 | ESCC: Esophageal squamous cell carcinoma |
| HGIN: High-grade intraepithelial neoplasias | ||
| LGIN: Low-grade intraepithelial neoplasias | ||
| Liver |  | HCC: Hepatocellular carcinoma |
| NAFLD: Non-alcoholic fatty liver disease | ||
| Oral Cavity | 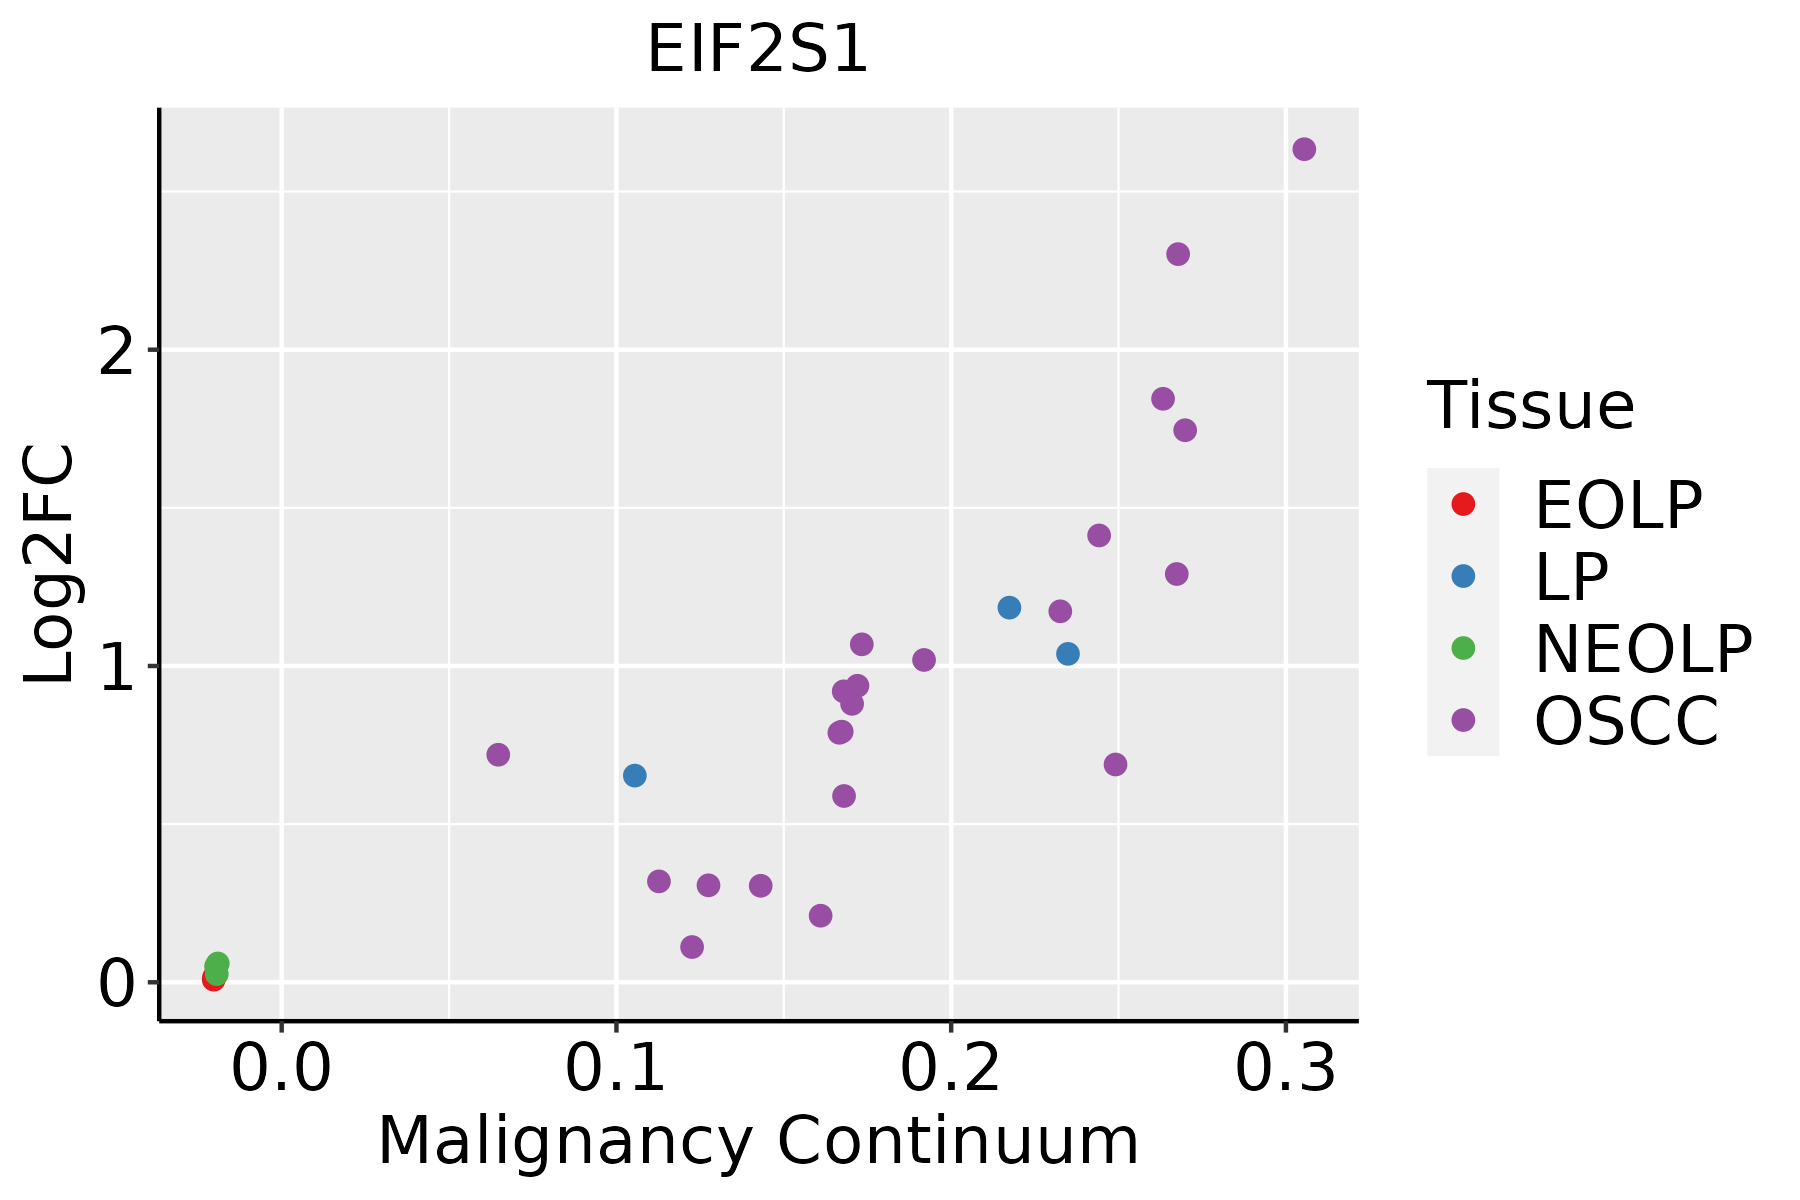 | EOLP: Erosive Oral lichen planus |
| LP: leukoplakia | ||
| NEOLP: Non-erosive oral lichen planus | ||
| OSCC: Oral squamous cell carcinoma | ||
| Prostate | 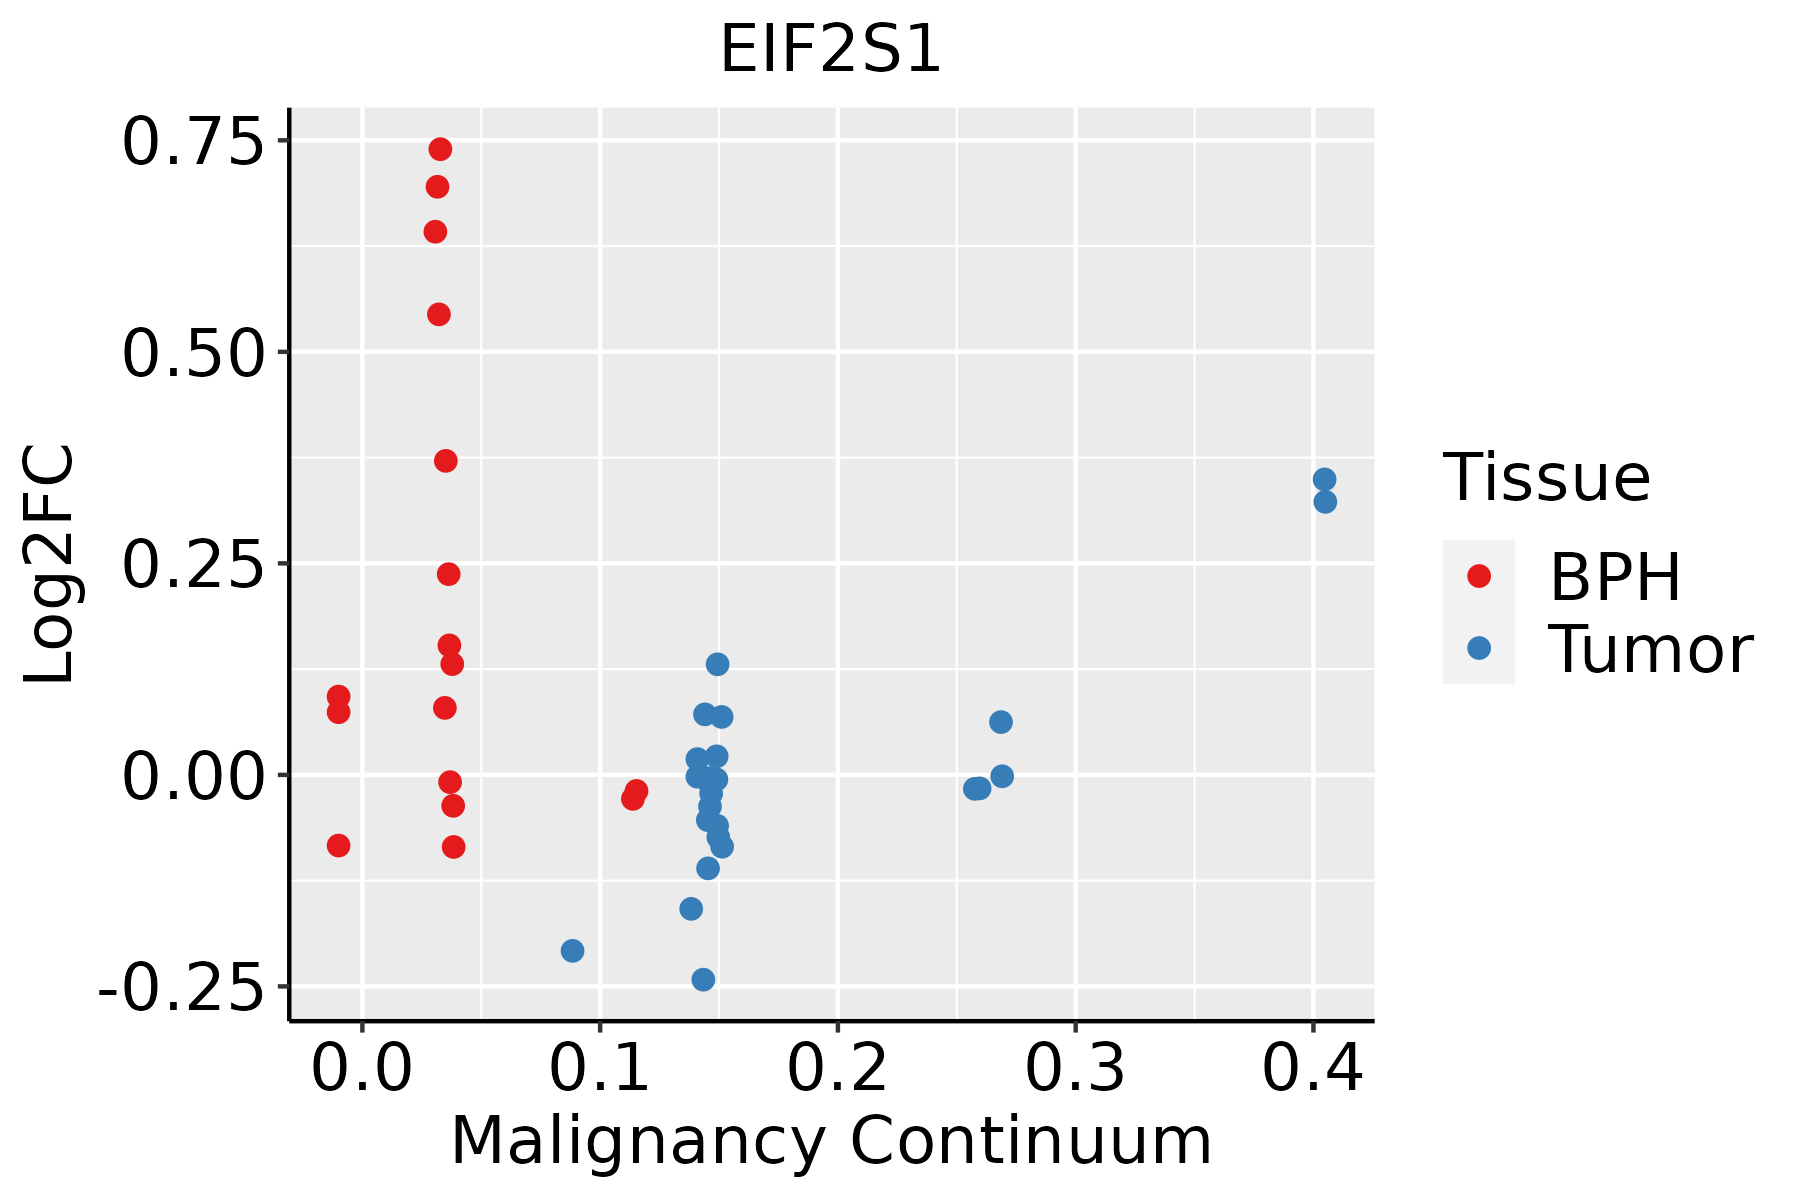 | BPH: Benign Prostatic Hyperplasia |
| Skin | 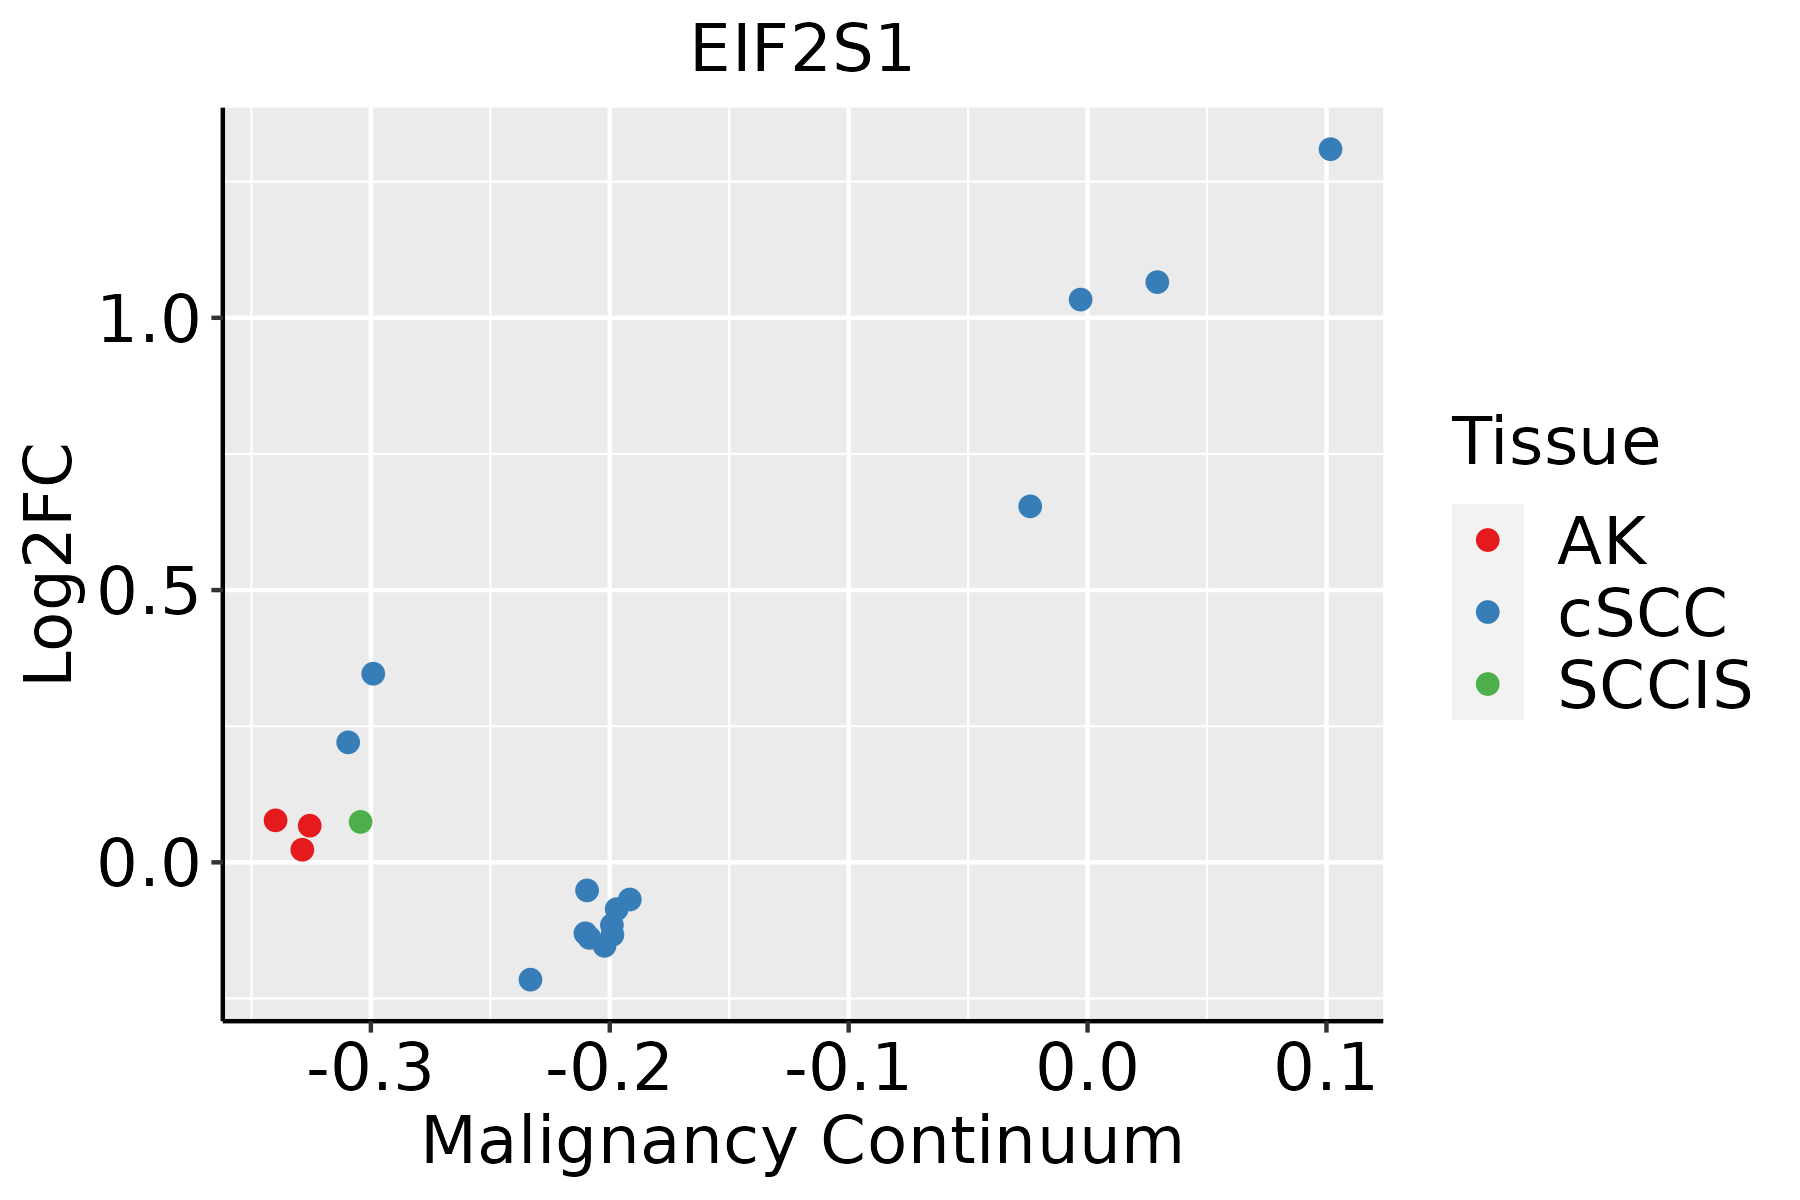 | AK: Actinic keratosis |
| cSCC: Cutaneous squamous cell carcinoma | ||
| SCCIS:squamous cell carcinoma in situ | ||
| Thyroid | 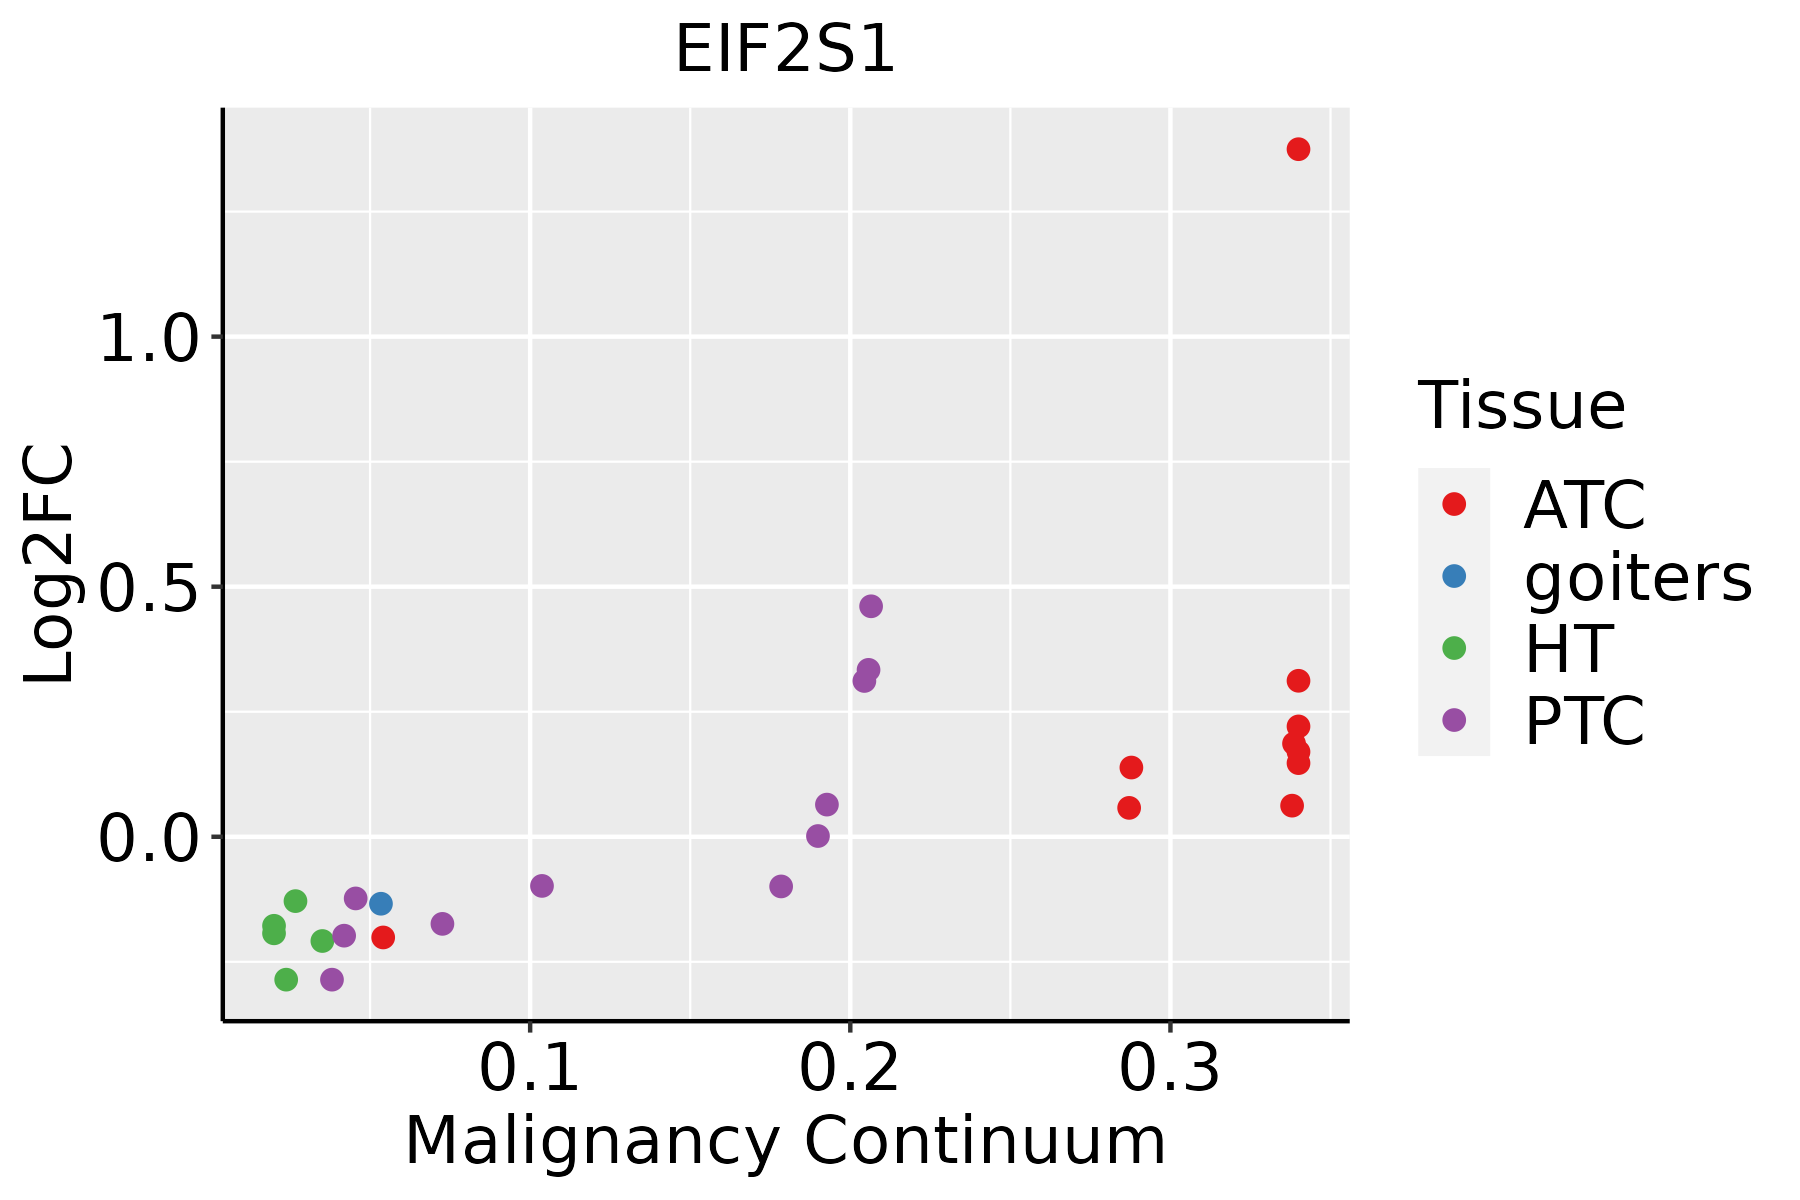 | ATC: Anaplastic thyroid cancer |
| HT: Hashimoto's thyroiditis | ||
| PTC: Papillary thyroid cancer |
| ∗log2FC in expression of this searched gene in stem-like cells from each diseased tissue sample relative to stem-like cells in normal samples in each tissue plotted against the malignancy continuum. Samples are colored based on if they are from different disease stage. |
Top |
Malignant transformation related pathway analysis |
| Find out the enriched GO biological processes and KEGG pathways involved in transition from healthy to precancer to cancer |
| Tissue | Disease Stage | Enriched GO biological Processes |
| Colorectum | AD |  |
| Colorectum | SER |  |
| Colorectum | MSS |  |
| Colorectum | MSI-H |  |
| Colorectum | FAP |  |
| ∗Top 15 enriched GO BP terms are showed in the bar plot of each disease state in each tissue. Each row represents a significant GO biological process which is colored according to the -log10(p.adjust). |
| Page: 1 2 3 4 5 6 7 8 9 |
| GO ID | Tissue | Disease Stage | Description | Gene Ratio | Bg Ratio | pvalue | p.adjust | Count |
| GO:000641727 | Esophagus | HGIN | regulation of translation | 139/2587 | 468/18723 | 1.46e-19 | 7.98e-17 | 139 |
| GO:000641320 | Esophagus | HGIN | translational initiation | 55/2587 | 118/18723 | 7.33e-18 | 2.31e-15 | 55 |
| GO:003497625 | Esophagus | HGIN | response to endoplasmic reticulum stress | 81/2587 | 256/18723 | 1.47e-13 | 2.32e-11 | 81 |
| GO:003596625 | Esophagus | HGIN | response to topologically incorrect protein | 54/2587 | 159/18723 | 8.53e-11 | 8.89e-09 | 54 |
| GO:000644610 | Esophagus | HGIN | regulation of translational initiation | 34/2587 | 79/18723 | 2.09e-10 | 1.97e-08 | 34 |
| GO:000698625 | Esophagus | HGIN | response to unfolded protein | 48/2587 | 137/18723 | 2.80e-10 | 2.54e-08 | 48 |
| GO:003460520 | Esophagus | HGIN | cellular response to heat | 30/2587 | 69/18723 | 1.78e-09 | 1.35e-07 | 30 |
| GO:000697927 | Esophagus | HGIN | response to oxidative stress | 107/2587 | 446/18723 | 3.91e-09 | 2.76e-07 | 107 |
| GO:003596725 | Esophagus | HGIN | cellular response to topologically incorrect protein | 41/2587 | 116/18723 | 4.07e-09 | 2.84e-07 | 41 |
| GO:003462020 | Esophagus | HGIN | cellular response to unfolded protein | 36/2587 | 96/18723 | 5.82e-09 | 3.88e-07 | 36 |
| GO:00342496 | Esophagus | HGIN | negative regulation of cellular amide metabolic process | 66/2587 | 273/18723 | 2.74e-06 | 9.60e-05 | 66 |
| GO:000940819 | Esophagus | HGIN | response to heat | 34/2587 | 110/18723 | 2.94e-06 | 1.01e-04 | 34 |
| GO:000698410 | Esophagus | HGIN | ER-nucleus signaling pathway | 19/2587 | 46/18723 | 4.28e-06 | 1.41e-04 | 19 |
| GO:007099727 | Esophagus | HGIN | neuron death | 81/2587 | 361/18723 | 5.01e-06 | 1.61e-04 | 81 |
| GO:006219727 | Esophagus | HGIN | cellular response to chemical stress | 76/2587 | 337/18723 | 8.00e-06 | 2.41e-04 | 76 |
| GO:00171486 | Esophagus | HGIN | negative regulation of translation | 59/2587 | 245/18723 | 1.03e-05 | 2.96e-04 | 59 |
| GO:007149626 | Esophagus | HGIN | cellular response to external stimulus | 71/2587 | 320/18723 | 2.77e-05 | 7.19e-04 | 71 |
| GO:003096817 | Esophagus | HGIN | endoplasmic reticulum unfolded protein response | 24/2587 | 74/18723 | 3.39e-05 | 8.61e-04 | 24 |
| GO:003459926 | Esophagus | HGIN | cellular response to oxidative stress | 65/2587 | 288/18723 | 3.42e-05 | 8.66e-04 | 65 |
| GO:005109825 | Esophagus | HGIN | regulation of binding | 78/2587 | 363/18723 | 3.73e-05 | 9.30e-04 | 78 |
| Page: 1 2 3 4 5 6 7 8 9 10 11 12 13 14 15 16 17 18 19 20 21 22 23 24 25 26 27 |
| Pathway ID | Tissue | Disease Stage | Description | Gene Ratio | Bg Ratio | pvalue | p.adjust | qvalue | Count |
| hsa0501239 | Esophagus | HGIN | Parkinson disease | 124/1383 | 266/8465 | 5.95e-32 | 9.70e-30 | 7.70e-30 | 124 |
| hsa0502030 | Esophagus | HGIN | Prion disease | 117/1383 | 273/8465 | 4.15e-26 | 3.38e-24 | 2.69e-24 | 117 |
| hsa0501430 | Esophagus | HGIN | Amyotrophic lateral sclerosis | 140/1383 | 364/8465 | 2.13e-25 | 1.16e-23 | 9.19e-24 | 140 |
| hsa0502230 | Esophagus | HGIN | Pathways of neurodegeneration - multiple diseases | 153/1383 | 476/8465 | 1.22e-18 | 4.41e-17 | 3.50e-17 | 153 |
| hsa0501030 | Esophagus | HGIN | Alzheimer disease | 130/1383 | 384/8465 | 5.26e-18 | 1.71e-16 | 1.36e-16 | 130 |
| hsa0493230 | Esophagus | HGIN | Non-alcoholic fatty liver disease | 66/1383 | 155/8465 | 5.21e-15 | 1.21e-13 | 9.64e-14 | 66 |
| hsa0414139 | Esophagus | HGIN | Protein processing in endoplasmic reticulum | 67/1383 | 174/8465 | 1.06e-12 | 2.16e-11 | 1.72e-11 | 67 |
| hsa0421020 | Esophagus | HGIN | Apoptosis | 36/1383 | 136/8465 | 1.67e-03 | 1.52e-02 | 1.20e-02 | 36 |
| hsa0541739 | Esophagus | HGIN | Lipid and atherosclerosis | 51/1383 | 215/8465 | 2.95e-03 | 2.41e-02 | 1.91e-02 | 51 |
| hsa0516420 | Esophagus | HGIN | Influenza A | 42/1383 | 171/8465 | 3.41e-03 | 2.54e-02 | 2.02e-02 | 42 |
| hsa05012114 | Esophagus | HGIN | Parkinson disease | 124/1383 | 266/8465 | 5.95e-32 | 9.70e-30 | 7.70e-30 | 124 |
| hsa05020113 | Esophagus | HGIN | Prion disease | 117/1383 | 273/8465 | 4.15e-26 | 3.38e-24 | 2.69e-24 | 117 |
| hsa05014113 | Esophagus | HGIN | Amyotrophic lateral sclerosis | 140/1383 | 364/8465 | 2.13e-25 | 1.16e-23 | 9.19e-24 | 140 |
| hsa05022113 | Esophagus | HGIN | Pathways of neurodegeneration - multiple diseases | 153/1383 | 476/8465 | 1.22e-18 | 4.41e-17 | 3.50e-17 | 153 |
| hsa05010113 | Esophagus | HGIN | Alzheimer disease | 130/1383 | 384/8465 | 5.26e-18 | 1.71e-16 | 1.36e-16 | 130 |
| hsa04932113 | Esophagus | HGIN | Non-alcoholic fatty liver disease | 66/1383 | 155/8465 | 5.21e-15 | 1.21e-13 | 9.64e-14 | 66 |
| hsa04141114 | Esophagus | HGIN | Protein processing in endoplasmic reticulum | 67/1383 | 174/8465 | 1.06e-12 | 2.16e-11 | 1.72e-11 | 67 |
| hsa04210110 | Esophagus | HGIN | Apoptosis | 36/1383 | 136/8465 | 1.67e-03 | 1.52e-02 | 1.20e-02 | 36 |
| hsa05417114 | Esophagus | HGIN | Lipid and atherosclerosis | 51/1383 | 215/8465 | 2.95e-03 | 2.41e-02 | 1.91e-02 | 51 |
| hsa05164110 | Esophagus | HGIN | Influenza A | 42/1383 | 171/8465 | 3.41e-03 | 2.54e-02 | 2.02e-02 | 42 |
| Page: 1 2 3 4 5 6 7 8 9 10 |
Top |
Cell-cell communication analysis |
| Identification of potential cell-cell interactions between two cell types and their ligand-receptor pairs for different disease states |
| Ligand | Receptor | LRpair | Pathway | Tissue | Disease Stage |
| Page: 1 |
Top |
Single-cell gene regulatory network inference analysis |
| Find out the significant the regulons (TFs) and the target genes of each regulon across cell types for different disease states |
| TF | Cell Type | Tissue | Disease Stage | Target Gene | RSS | Regulon Activity |
| ∗The dot plots of a searched regulon are shown for all cell subpopulations in each disease state of each tissue based on the regulon specific score inferred using pySCENIC and by calculating the average expression. |
| Page: 1 |
Top |
Somatic mutation of malignant transformation related genes |
| Annotation of somatic variants for genes involved in malignant transformation |
| Hugo Symbol | Variant Class | Variant Classification | dbSNP RS | HGVSc | HGVSp | HGVSp Short | SWISSPROT | BIOTYPE | SIFT | PolyPhen | Tumor Sample Barcode | Tissue | Histology | Sex | Age | Stage | Therapy Types | Drugs | Outcome |
| EIF2S1 | SNV | Missense_Mutation | c.43N>A | p.Glu15Lys | p.E15K | P05198 | protein_coding | tolerated(0.05) | benign(0.072) | TCGA-BH-A0HF-01 | Breast | breast invasive carcinoma | Female | >=65 | I/II | Hormone Therapy | arimidex | SD | |
| EIF2S1 | SNV | Missense_Mutation | c.575N>A | p.Arg192Gln | p.R192Q | P05198 | protein_coding | deleterious(0.04) | possibly_damaging(0.736) | TCGA-E2-A14V-01 | Breast | breast invasive carcinoma | Female | <65 | I/II | Chemotherapy | cyclophosphamide | SD | |
| EIF2S1 | SNV | Missense_Mutation | novel | c.179N>G | p.Asn60Ser | p.N60S | P05198 | protein_coding | tolerated(0.26) | benign(0.317) | TCGA-2W-A8YY-01 | Cervix | cervical & endocervical cancer | Female | <65 | I/II | Chemotherapy | cisplatin | CR |
| EIF2S1 | SNV | Missense_Mutation | c.847N>A | p.Glu283Lys | p.E283K | P05198 | protein_coding | deleterious(0) | possibly_damaging(0.822) | TCGA-C5-A1BE-01 | Cervix | cervical & endocervical cancer | Female | <65 | I/II | Chemotherapy | cisplatin | PD | |
| EIF2S1 | SNV | Missense_Mutation | c.910N>C | p.Asp304His | p.D304H | P05198 | protein_coding | deleterious(0) | benign(0.193) | TCGA-DR-A0ZM-01 | Cervix | cervical & endocervical cancer | Female | <65 | III/IV | Unspecific | Cisplatin | SD | |
| EIF2S1 | SNV | Missense_Mutation | c.552N>C | p.Leu184Phe | p.L184F | P05198 | protein_coding | deleterious(0.01) | probably_damaging(0.989) | TCGA-DS-A0VM-01 | Cervix | cervical & endocervical cancer | Female | <65 | I/II | Chemotherapy | cisplatin | PD | |
| EIF2S1 | SNV | Missense_Mutation | c.253N>G | p.Leu85Val | p.L85V | P05198 | protein_coding | deleterious(0) | probably_damaging(0.964) | TCGA-AA-3510-01 | Colorectum | colon adenocarcinoma | Male | >=65 | I/II | Unknown | Unknown | SD | |
| EIF2S1 | SNV | Missense_Mutation | novel | c.711N>T | p.Met237Ile | p.M237I | P05198 | protein_coding | tolerated(0.41) | benign(0.012) | TCGA-F5-6814-01 | Colorectum | rectum adenocarcinoma | Male | <65 | I/II | Unknown | Unknown | SD |
| EIF2S1 | SNV | Missense_Mutation | novel | c.337C>T | p.Arg113Cys | p.R113C | P05198 | protein_coding | deleterious(0) | probably_damaging(0.981) | TCGA-A5-A0G2-01 | Endometrium | uterine corpus endometrioid carcinoma | Female | <65 | III/IV | Unknown | Unknown | SD |
| EIF2S1 | SNV | Missense_Mutation | c.4C>T | p.Pro2Ser | p.P2S | P05198 | protein_coding | tolerated(0.49) | benign(0.114) | TCGA-A5-A0GA-01 | Endometrium | uterine corpus endometrioid carcinoma | Female | >=65 | III/IV | Chemotherapy | taxol | PD |
| Page: 1 2 3 |
Top |
Related drugs of malignant transformation related genes |
| Identification of chemicals and drugs interact with genes involved in malignant transfromation |
| (DGIdb 4.0) |
| Entrez ID | Symbol | Category | Interaction Types | Drug Claim Name | Drug Name | PMIDs |
| 1965 | EIF2S1 | NA | STAUROSPORINE | STAUROSPORINE | 10400313 |
| Page: 1 |

Copyright 2023-Present -The University of Texas Health Science Center at Houston |