Schematic overview of the cellular and molecular mechanisms involved in the cancer progression, including the proposed cellular and molecular mechanisms in cancer cells trajectory. AT1: alveolar type 1 cells; AT2: alveolar type 2 cells; AAH: atypical adenomatous hyperplasia; AIS: adenocarcinoma in situ; MIA: minimally invasive adenocarcinoma; IA: invasive adenocarcinoma; EMT: epithelial-mesenchymal transition

Home

Download

Statistics

Help

Contact

Center for Computational Systems Medicine
leaf

Gene summary

leaf

Malignant transformation analysis

leaf

Malignant transformation related pathway analysis

leaf

Cell-cell communication analysis

leaf

Single-cell gene regulatory network inference analysis

leaf

Somatic mutation of malignant transformation related genes

leaf

Related drugs of malignant transformation related genes

Gene: EIF2B5

Gene summary for EIF2B5

check button Gene summary.

Gene informationSpeciesHuman
Gene symbol

EIF2B5

Gene ID

8893

Gene nameeukaryotic translation initiation factor 2B subunit epsilon
Gene AliasCACH
Cytomap3q27.1
Gene Typeprotein-coding
GO ID

GO:0000003

UniProtAcc

Q13144


Top

Malignant transformation analysis

check button Identification of the aberrant gene expression in precancerous and cancerous lesions by comparing the gene expression of stem-like cells in diseased tissues with normal stem cells
check button Malignant transformation involving gene list.
Entrez IDSymbolReplicatesSpeciesOrganTissueAdj P-valueLog2FCMalignancy
8893EIF2B5LZE4THumanEsophagusESCC1.11e-072.83e-010.0811
8893EIF2B5LZE5THumanEsophagusESCC3.74e-054.70e-010.0514
8893EIF2B5LZE7THumanEsophagusESCC1.80e-103.76e-010.0667
8893EIF2B5LZE8THumanEsophagusESCC2.03e-031.71e-010.067
8893EIF2B5LZE20THumanEsophagusESCC1.74e-102.46e-010.0662
8893EIF2B5LZE22THumanEsophagusESCC1.19e-074.93e-010.068
8893EIF2B5LZE24THumanEsophagusESCC1.14e-205.39e-010.0596
8893EIF2B5LZE21THumanEsophagusESCC1.92e-076.60e-010.0655
8893EIF2B5P1T-EHumanEsophagusESCC3.36e-187.71e-010.0875
8893EIF2B5P2T-EHumanEsophagusESCC2.33e-521.04e+000.1177
8893EIF2B5P4T-EHumanEsophagusESCC4.39e-561.43e+000.1323
8893EIF2B5P5T-EHumanEsophagusESCC8.94e-164.54e-010.1327
8893EIF2B5P8T-EHumanEsophagusESCC3.21e-327.03e-010.0889
8893EIF2B5P9T-EHumanEsophagusESCC4.78e-306.19e-010.1131
8893EIF2B5P10T-EHumanEsophagusESCC1.65e-407.17e-010.116
8893EIF2B5P11T-EHumanEsophagusESCC6.20e-189.60e-010.1426
8893EIF2B5P12T-EHumanEsophagusESCC7.52e-256.27e-010.1122
8893EIF2B5P15T-EHumanEsophagusESCC9.74e-478.39e-010.1149
8893EIF2B5P16T-EHumanEsophagusESCC3.32e-397.18e-010.1153
8893EIF2B5P17T-EHumanEsophagusESCC1.83e-082.29e-010.1278
Page: 1 2 3 4 5 6 

check button Transcriptomic changes along malignancy continuum.
TissueExpression DynamicsAbbreviation
EsophagusThe image shows the transcriptomic changes along malignancy continuum.log2FC in expression of this searched gene in stem-like cells from each diseased tissue sample relative to stem-like cells in normal samples in each tissue plotted against the malignancy continuum. Samples are colored based on if they are from different disease stage.
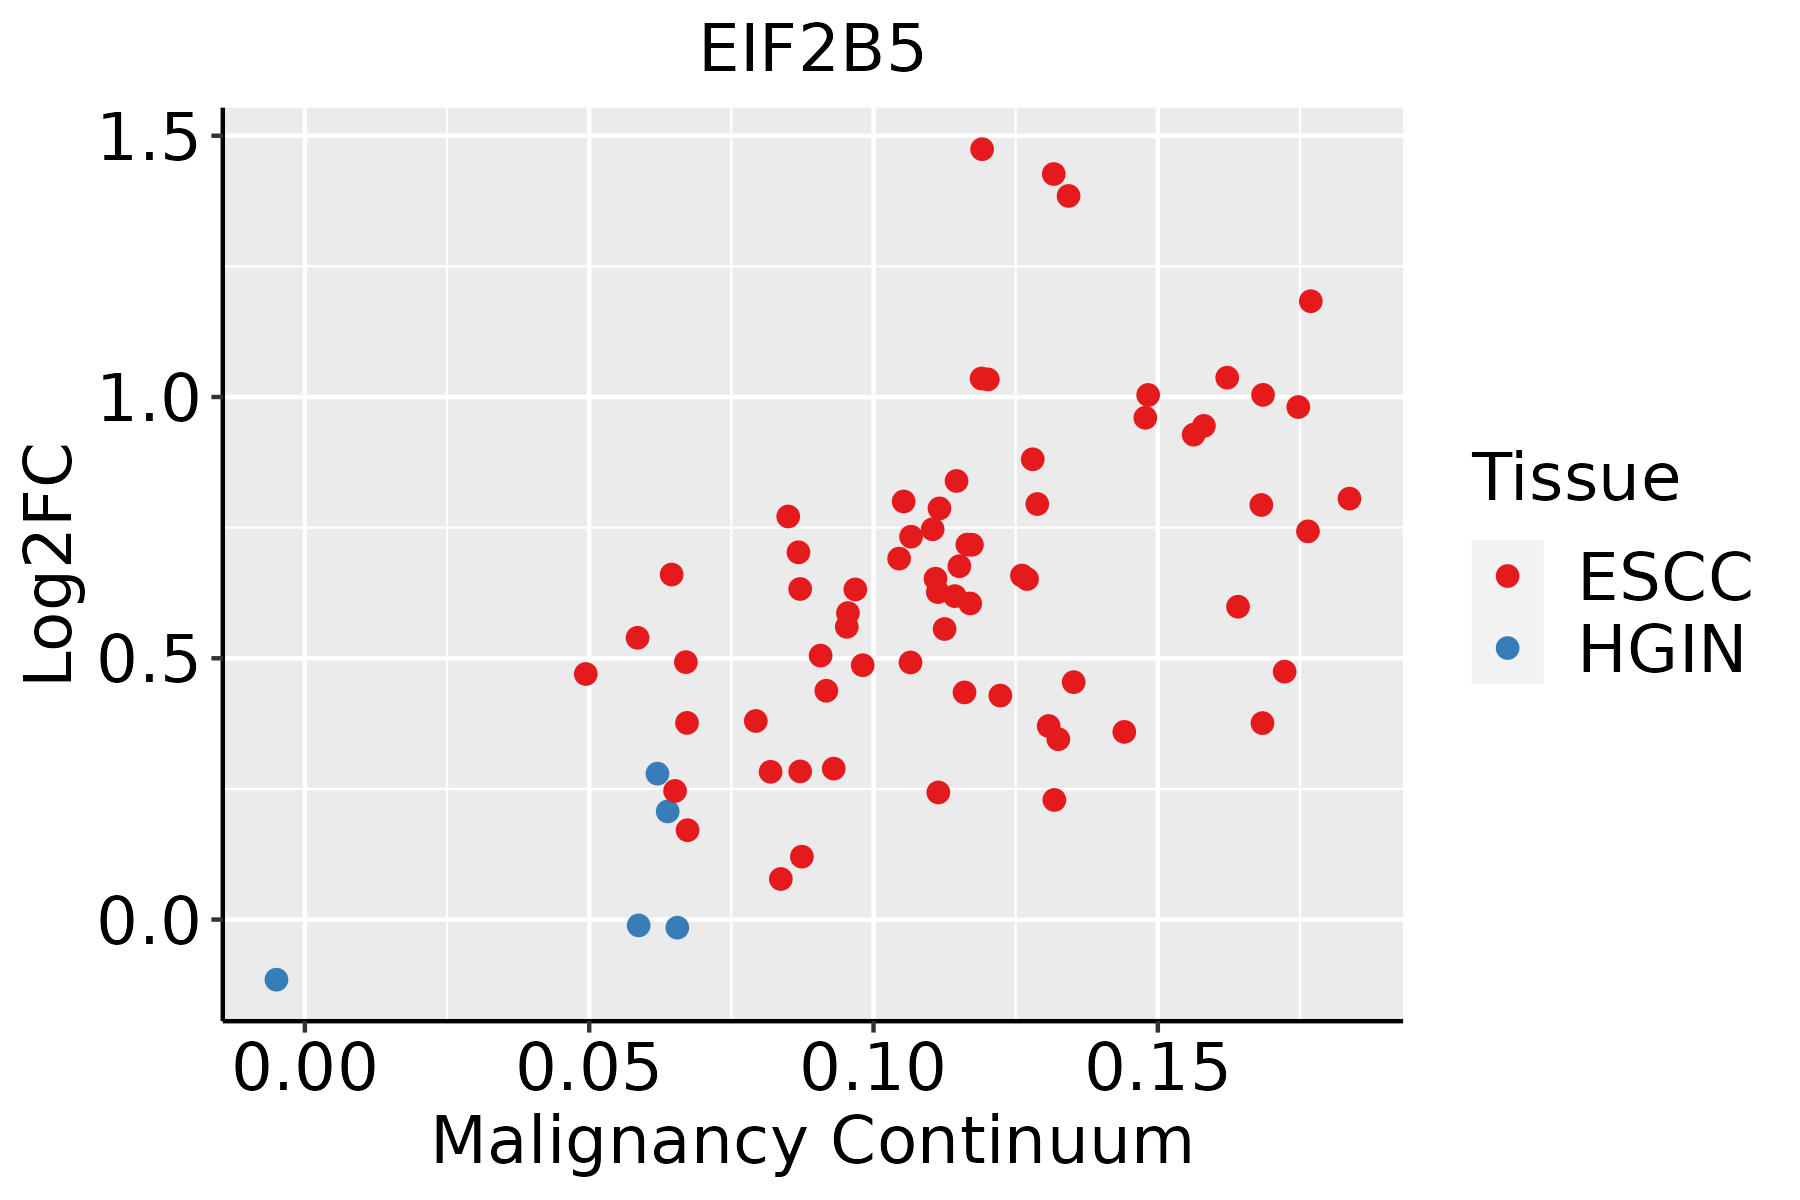
ESCC: Esophageal squamous cell carcinoma
HGIN: High-grade intraepithelial neoplasias
LGIN: Low-grade intraepithelial neoplasias
LiverThe image shows the transcriptomic changes along malignancy continuum.log2FC in expression of this searched gene in stem-like cells from each diseased tissue sample relative to stem-like cells in normal samples in each tissue plotted against the malignancy continuum. Samples are colored based on if they are from different disease stage.
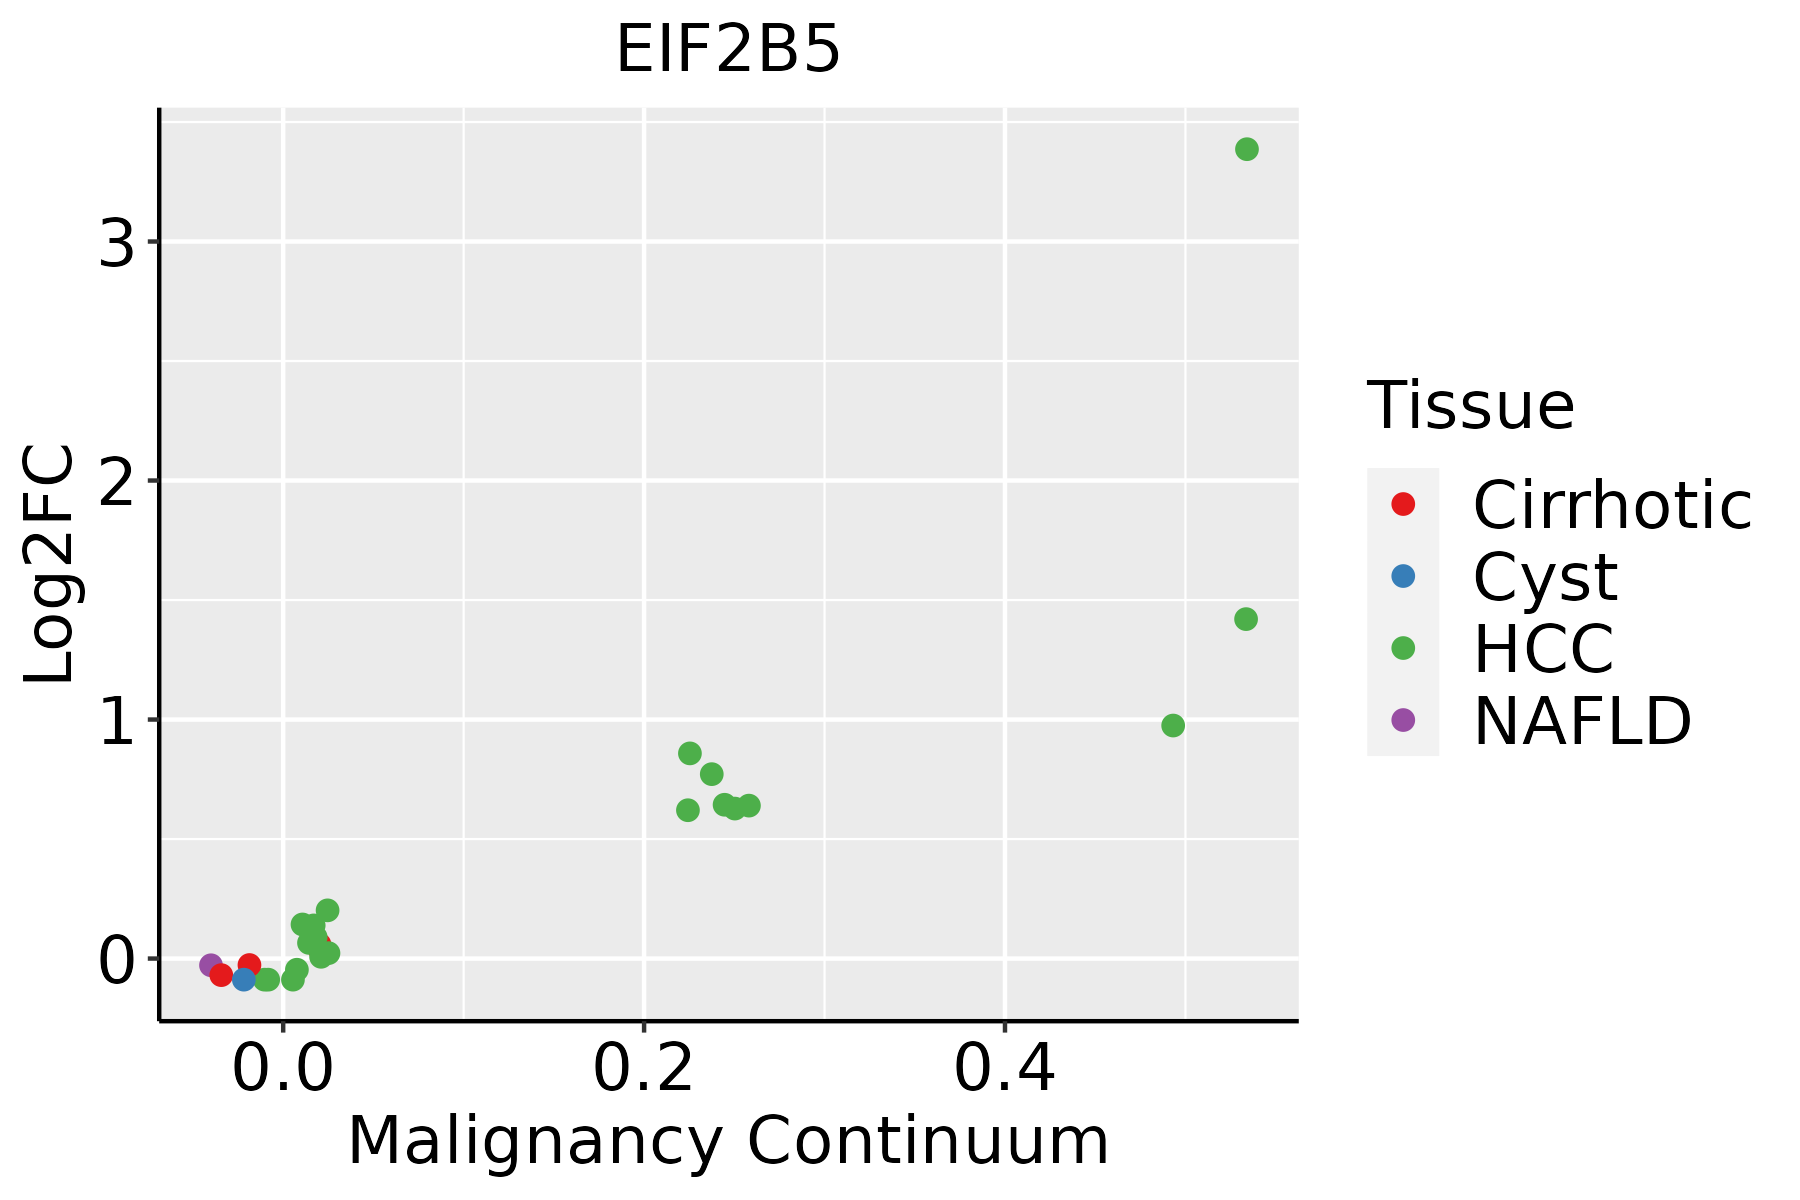
HCC: Hepatocellular carcinoma
NAFLD: Non-alcoholic fatty liver disease
Oral CavityThe image shows the transcriptomic changes along malignancy continuum.log2FC in expression of this searched gene in stem-like cells from each diseased tissue sample relative to stem-like cells in normal samples in each tissue plotted against the malignancy continuum. Samples are colored based on if they are from different disease stage.EOLP: Erosive Oral lichen planus
LP: leukoplakia
NEOLP: Non-erosive oral lichen planus
OSCC: Oral squamous cell carcinoma
SkinThe image shows the transcriptomic changes along malignancy continuum.log2FC in expression of this searched gene in stem-like cells from each diseased tissue sample relative to stem-like cells in normal samples in each tissue plotted against the malignancy continuum. Samples are colored based on if they are from different disease stage.
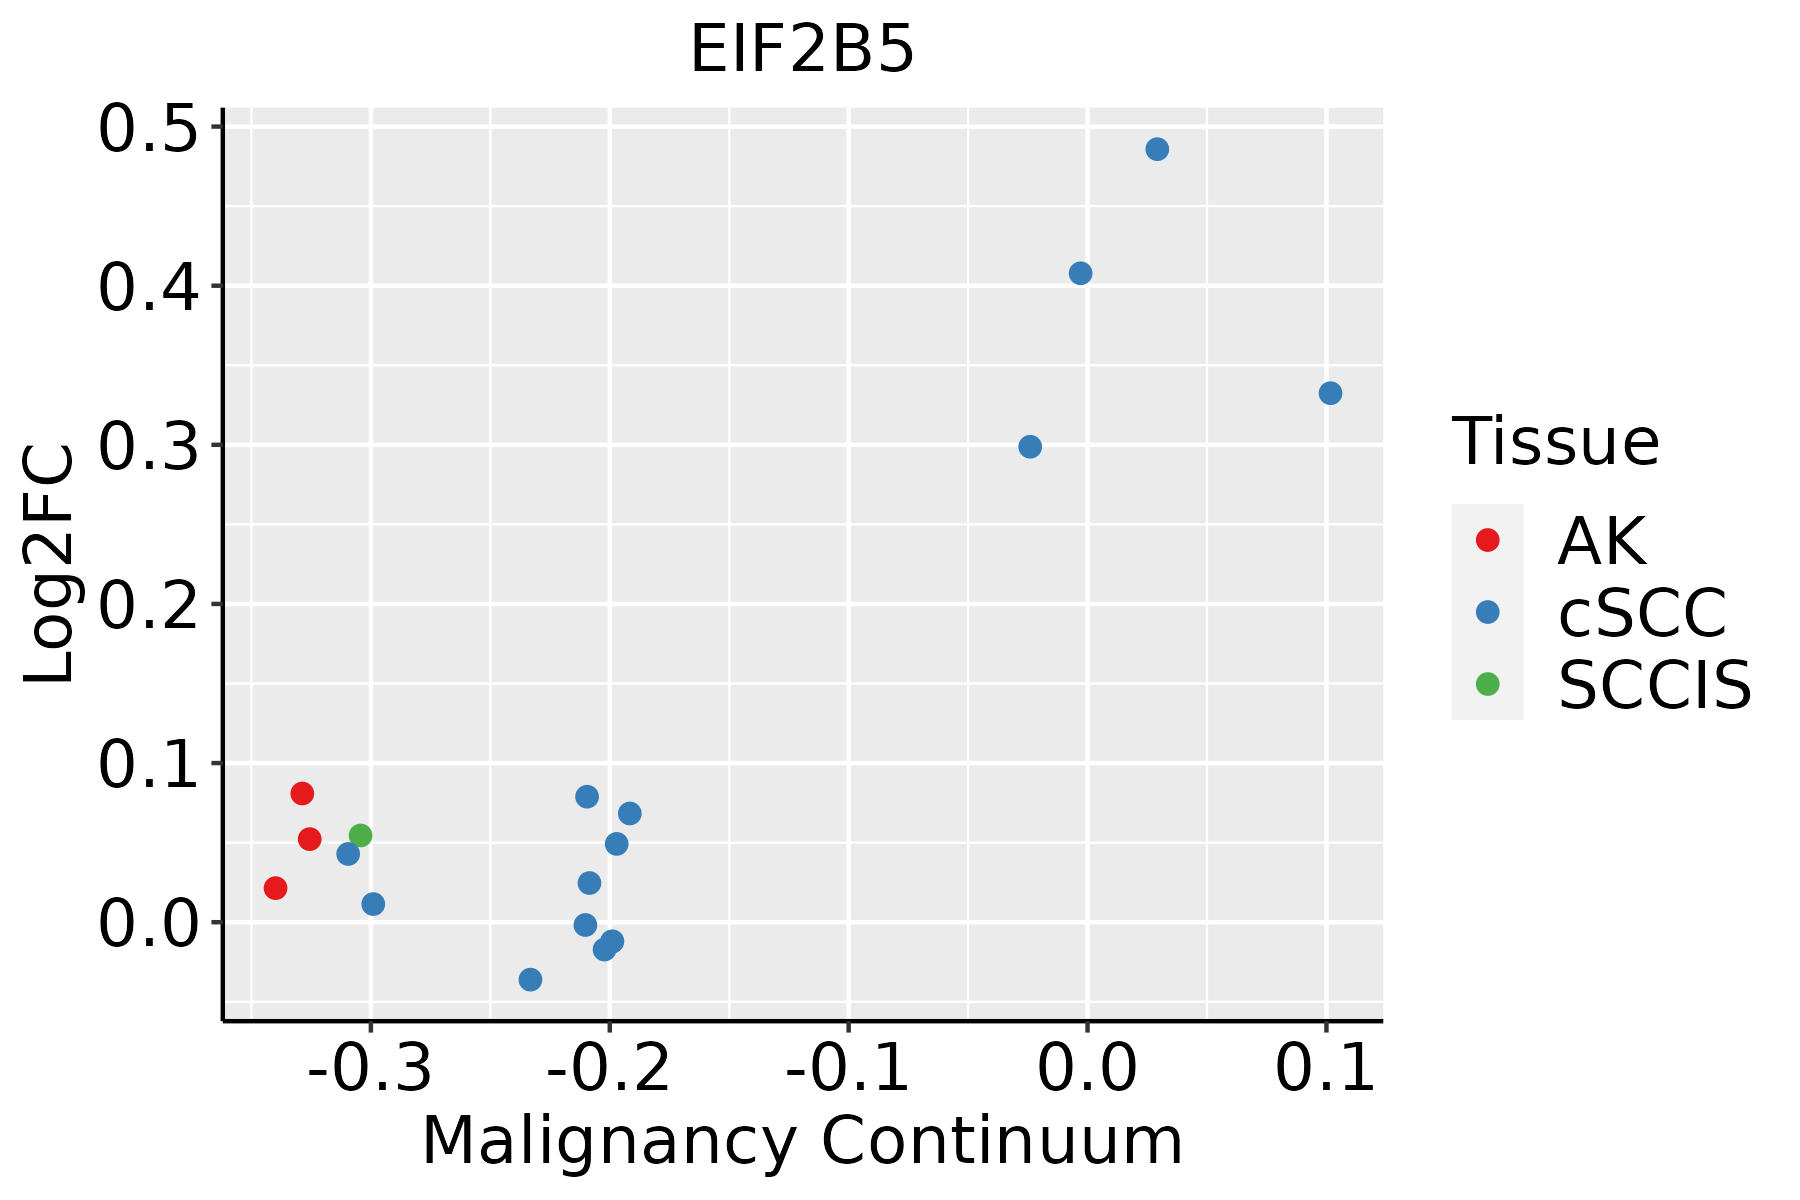
AK: Actinic keratosis
cSCC: Cutaneous squamous cell carcinoma
SCCIS:squamous cell carcinoma in situ
∗log2FC in expression of this searched gene in stem-like cells from each diseased tissue sample relative to stem-like cells in normal samples in each tissue plotted against the malignancy continuum. Samples are colored based on if they are from different disease stage.

Top

Malignant transformation related pathway analysis

check buttonFind out the enriched GO biological processes and KEGG pathways involved in transition from healthy to precancer to cancer
check button Figure of enriched GO biological processes.
TissueDisease StageEnriched GO biological Processes
ColorectumADGO analysis - Figure of enriched GO biological processes: Top 15 enriched GO BP terms are showed in the bar plot of each disease state in each tissue. Each row represents a significant GO biological process which is colored according to the -log10(p.adjust).
ColorectumSERGO analysis - Figure of enriched GO biological processes: Top 15 enriched GO BP terms are showed in the bar plot of each disease state in each tissue. Each row represents a significant GO biological process which is colored according to the -log10(p.adjust).
ColorectumMSSGO analysis - Figure of enriched GO biological processes: Top 15 enriched GO BP terms are showed in the bar plot of each disease state in each tissue. Each row represents a significant GO biological process which is colored according to the -log10(p.adjust).
ColorectumMSI-HGO analysis - Figure of enriched GO biological processes: Top 15 enriched GO BP terms are showed in the bar plot of each disease state in each tissue. Each row represents a significant GO biological process which is colored according to the -log10(p.adjust).
ColorectumFAPGO analysis - Figure of enriched GO biological processes: Top 15 enriched GO BP terms are showed in the bar plot of each disease state in each tissue. Each row represents a significant GO biological process which is colored according to the -log10(p.adjust).
∗Top 15 enriched GO BP terms are showed in the bar plot of each disease state in each tissue. Each row represents a significant GO biological process which is colored according to the -log10(p.adjust).
Page: 1 2 3 4 5 6 7 8 9 

check button Enriched GO biological processes.
GO IDTissueDisease StageDescriptionGene RatioBg Ratiopvaluep.adjustCount
GO:0034976111EsophagusESCCresponse to endoplasmic reticulum stress192/8552256/187237.15e-221.30e-19192
GO:0006413110EsophagusESCCtranslational initiation100/8552118/187231.16e-181.25e-16100
GO:0006417111EsophagusESCCregulation of translation304/8552468/187231.53e-171.33e-15304
GO:0045727111EsophagusESCCpositive regulation of translation107/8552136/187232.79e-151.68e-13107
GO:0034250111EsophagusESCCpositive regulation of cellular amide metabolic process123/8552162/187233.32e-151.93e-13123
GO:000644617EsophagusESCCregulation of translational initiation65/855279/187232.04e-117.07e-1065
GO:0009408110EsophagusESCCresponse to heat77/8552110/187232.01e-073.11e-0677
GO:0061458110EsophagusESCCreproductive system development247/8552427/187232.24e-073.42e-06247
GO:000756820EsophagusESCCaging201/8552339/187232.64e-073.94e-06201
GO:004860818EsophagusESCCreproductive structure development245/8552424/187232.82e-074.14e-06245
GO:0043434111EsophagusESCCresponse to peptide hormone234/8552414/187234.93e-065.21e-05234
GO:00425524EsophagusESCCmyelination85/8552134/187232.51e-052.13e-0485
GO:00072724EsophagusESCCensheathment of neurons86/8552136/187232.68e-052.24e-0486
GO:00083664EsophagusESCCaxon ensheathment86/8552136/187232.68e-052.24e-0486
GO:00420636EsophagusESCCgliogenesis172/8552301/187233.75e-053.04e-04172
GO:001003827EsophagusESCCresponse to metal ion208/8552373/187235.02e-053.90e-04208
GO:000926619EsophagusESCCresponse to temperature stimulus106/8552178/187231.30e-048.84e-04106
GO:00100016EsophagusESCCglial cell differentiation129/8552225/187232.73e-041.65e-03129
GO:00459483EsophagusESCCpositive regulation of translational initiation23/855230/187235.47e-043.00e-0323
GO:00508528EsophagusESCCT cell receptor signaling pathway73/8552123/187231.54e-037.24e-0373
Page: 1 2 3 4 5 6 

check button Enriched KEGG pathways.
Pathway IDTissueDisease StageDescriptionGene RatioBg Ratiopvaluep.adjustqvalueCount
Page: 1 

Top

Cell-cell communication analysis

check buttonIdentification of potential cell-cell interactions between two cell types and their ligand-receptor pairs for different disease states
LigandReceptorLRpairPathwayTissueDisease Stage
Page: 1 

Top

Single-cell gene regulatory network inference analysis

check buttonFind out the significant the regulons (TFs) and the target genes of each regulon across cell types for different disease states
TFCell TypeTissueDisease StageTarget GeneRSSRegulon Activity
∗The dot plots of a searched regulon are shown for all cell subpopulations in each disease state of each tissue based on the regulon specific score inferred using pySCENIC and by calculating the average expression.
Page: 1 

Top

Somatic mutation of malignant transformation related genes

check buttonAnnotation of somatic variants for genes involved in malignant transformation
Hugo SymbolVariant ClassVariant ClassificationdbSNP RSHGVScHGVSpHGVSp ShortSWISSPROTBIOTYPESIFTPolyPhenTumor Sample BarcodeTissueHistologySexAgeStageTherapy TypesDrugsOutcome
EIF2B5SNVMissense_Mutationc.512N>Ap.Arg171Lysp.R171KQ13144protein_codingtolerated(0.08)probably_damaging(0.991)TCGA-A8-A0A7-01Breastbreast invasive carcinomaFemale<65I/IIUnknownUnknownSD
EIF2B5SNVMissense_Mutationnovelc.2155G>Ap.Glu719Lysp.E719KQ13144protein_codingtolerated_low_confidence(0.12)benign(0.371)TCGA-AC-A2QI-01Breastbreast invasive carcinomaFemale>=65III/IVChemotherapycytoxanCR
EIF2B5SNVMissense_Mutationrs755584111c.1031G>Ap.Arg344Glnp.R344QQ13144protein_codingtolerated(0.11)possibly_damaging(0.511)TCGA-AN-A03Y-01Breastbreast invasive carcinomaFemale>=65I/IIUnknownUnknownSD
EIF2B5SNVMissense_Mutationc.706G>Ap.Asp236Asnp.D236NQ13144protein_codingtolerated(0.16)benign(0.003)TCGA-E2-A14P-01Breastbreast invasive carcinomaFemale>=65III/IVTargeted Molecular therapytrastuzumabSD
EIF2B5insertionNonsense_Mutationnovelc.748_749insTATAGTTCATAATACTCTTTGAAGTTGAAGACGCTGp.Ser250delinsIleTerPheIleIleLeuPheGluValGluAspAlaGlyp.S250delinsI*FIILFEVEDAGQ13144protein_codingTCGA-A8-A07R-01Breastbreast invasive carcinomaFemale>=65III/IVAncillaryzoledronicSD
EIF2B5insertionIn_Frame_Insnovelc.1029_1030insTCCTGGTCTp.Tyr343_Arg344insSerTrpSerp.Y343_R344insSWSQ13144protein_codingTCGA-AN-A03Y-01Breastbreast invasive carcinomaFemale>=65I/IIUnknownUnknownSD
EIF2B5insertionIn_Frame_Insnovelc.1810_1811insGAAAGGCCAGTGAAGGCCCTGGTGTCACCCCAGTCTp.Pro604delinsArgLysAlaSerGluGlyProGlyValThrProValSerp.P604delinsRKASEGPGVTPVSQ13144protein_codingTCGA-BH-A0HF-01Breastbreast invasive carcinomaFemale>=65I/IIHormone TherapyarimidexSD
EIF2B5deletionFrame_Shift_Delnovelc.1179delNp.Thr394ProfsTer30p.T394Pfs*30Q13144protein_codingTCGA-D8-A27V-01Breastbreast invasive carcinomaFemale<65I/IIHormone TherapytamoxiphenSD
EIF2B5deletionFrame_Shift_Delnovelc.1706delNp.Ser570LeufsTer18p.S570Lfs*18Q13144protein_codingTCGA-D8-A27V-01Breastbreast invasive carcinomaFemale<65I/IIHormone TherapytamoxiphenSD
EIF2B5SNVMissense_Mutationnovelc.403C>Ap.Leu135Ilep.L135IQ13144protein_codingtolerated(0.06)probably_damaging(0.991)TCGA-2W-A8YY-01Cervixcervical & endocervical cancerFemale<65I/IIChemotherapycisplatinCR
Page: 1 2 3 4 5 6 7 

Top

Related drugs of malignant transformation related genes

check buttonIdentification of chemicals and drugs interact with genes involved in malignant transfromation
(DGIdb 4.0)
Entrez IDSymbolCategoryInteraction TypesDrug Claim NameDrug NamePMIDs
Page: 1