
|
|||||
|
 | |
| |
| |
| |
| |
| |
|
Gene: EIF2B3 |
Gene summary for EIF2B3 |
| Gene information | Species | Human | Gene symbol | EIF2B3 | Gene ID | 8891 |
| Gene name | eukaryotic translation initiation factor 2B subunit gamma | |
| Gene Alias | EIF-2B | |
| Cytomap | 1p34.1 | |
| Gene Type | protein-coding | GO ID | GO:0002181 | UniProtAcc | Q9NR50 |
Top |
Malignant transformation analysis |
| Identification of the aberrant gene expression in precancerous and cancerous lesions by comparing the gene expression of stem-like cells in diseased tissues with normal stem cells |
| Entrez ID | Symbol | Replicates | Species | Organ | Tissue | Adj P-value | Log2FC | Malignancy |
| 8891 | EIF2B3 | LZE4T | Human | Esophagus | ESCC | 9.37e-04 | 2.09e-01 | 0.0811 |
| 8891 | EIF2B3 | LZE7T | Human | Esophagus | ESCC | 7.67e-07 | 2.91e-01 | 0.0667 |
| 8891 | EIF2B3 | LZE8T | Human | Esophagus | ESCC | 7.64e-04 | 1.13e-01 | 0.067 |
| 8891 | EIF2B3 | LZE24T | Human | Esophagus | ESCC | 9.52e-04 | 1.49e-01 | 0.0596 |
| 8891 | EIF2B3 | P1T-E | Human | Esophagus | ESCC | 1.55e-04 | 2.52e-01 | 0.0875 |
| 8891 | EIF2B3 | P2T-E | Human | Esophagus | ESCC | 5.20e-27 | 4.98e-01 | 0.1177 |
| 8891 | EIF2B3 | P4T-E | Human | Esophagus | ESCC | 3.60e-10 | 2.91e-01 | 0.1323 |
| 8891 | EIF2B3 | P5T-E | Human | Esophagus | ESCC | 3.69e-18 | 3.39e-01 | 0.1327 |
| 8891 | EIF2B3 | P8T-E | Human | Esophagus | ESCC | 5.25e-09 | 1.43e-01 | 0.0889 |
| 8891 | EIF2B3 | P9T-E | Human | Esophagus | ESCC | 1.89e-08 | 1.72e-01 | 0.1131 |
| 8891 | EIF2B3 | P10T-E | Human | Esophagus | ESCC | 4.58e-20 | 3.16e-01 | 0.116 |
| 8891 | EIF2B3 | P11T-E | Human | Esophagus | ESCC | 1.82e-08 | 4.47e-01 | 0.1426 |
| 8891 | EIF2B3 | P12T-E | Human | Esophagus | ESCC | 1.59e-11 | 2.10e-01 | 0.1122 |
| 8891 | EIF2B3 | P15T-E | Human | Esophagus | ESCC | 1.43e-09 | 2.62e-01 | 0.1149 |
| 8891 | EIF2B3 | P16T-E | Human | Esophagus | ESCC | 8.99e-12 | 2.25e-01 | 0.1153 |
| 8891 | EIF2B3 | P17T-E | Human | Esophagus | ESCC | 5.02e-06 | 4.26e-01 | 0.1278 |
| 8891 | EIF2B3 | P19T-E | Human | Esophagus | ESCC | 5.15e-03 | 5.29e-01 | 0.1662 |
| 8891 | EIF2B3 | P20T-E | Human | Esophagus | ESCC | 2.42e-09 | 2.76e-01 | 0.1124 |
| 8891 | EIF2B3 | P21T-E | Human | Esophagus | ESCC | 3.56e-30 | 5.54e-01 | 0.1617 |
| 8891 | EIF2B3 | P22T-E | Human | Esophagus | ESCC | 3.77e-14 | 2.85e-01 | 0.1236 |
| Page: 1 2 3 4 5 |
| Tissue | Expression Dynamics | Abbreviation |
| Esophagus |  | ESCC: Esophageal squamous cell carcinoma |
| HGIN: High-grade intraepithelial neoplasias | ||
| LGIN: Low-grade intraepithelial neoplasias | ||
| Liver | 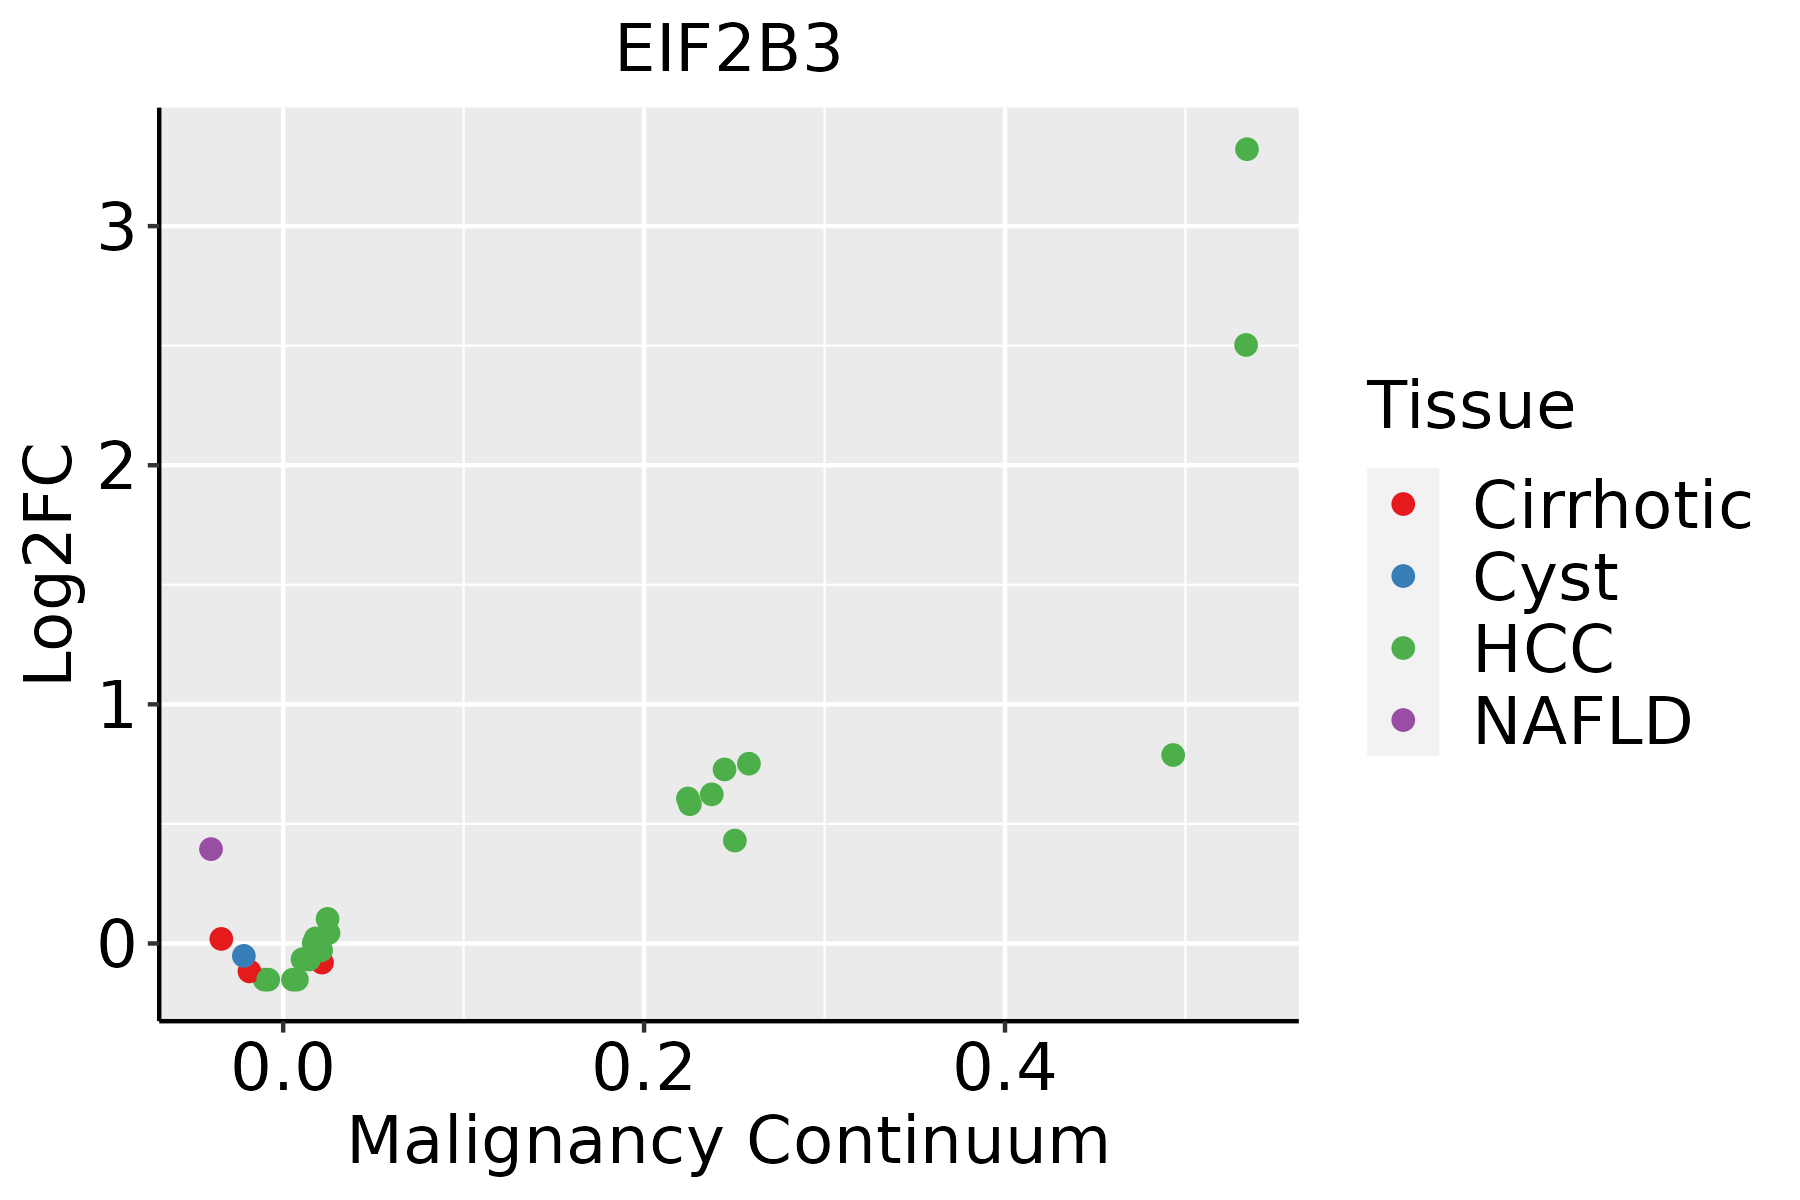 | HCC: Hepatocellular carcinoma |
| NAFLD: Non-alcoholic fatty liver disease | ||
| Oral Cavity | 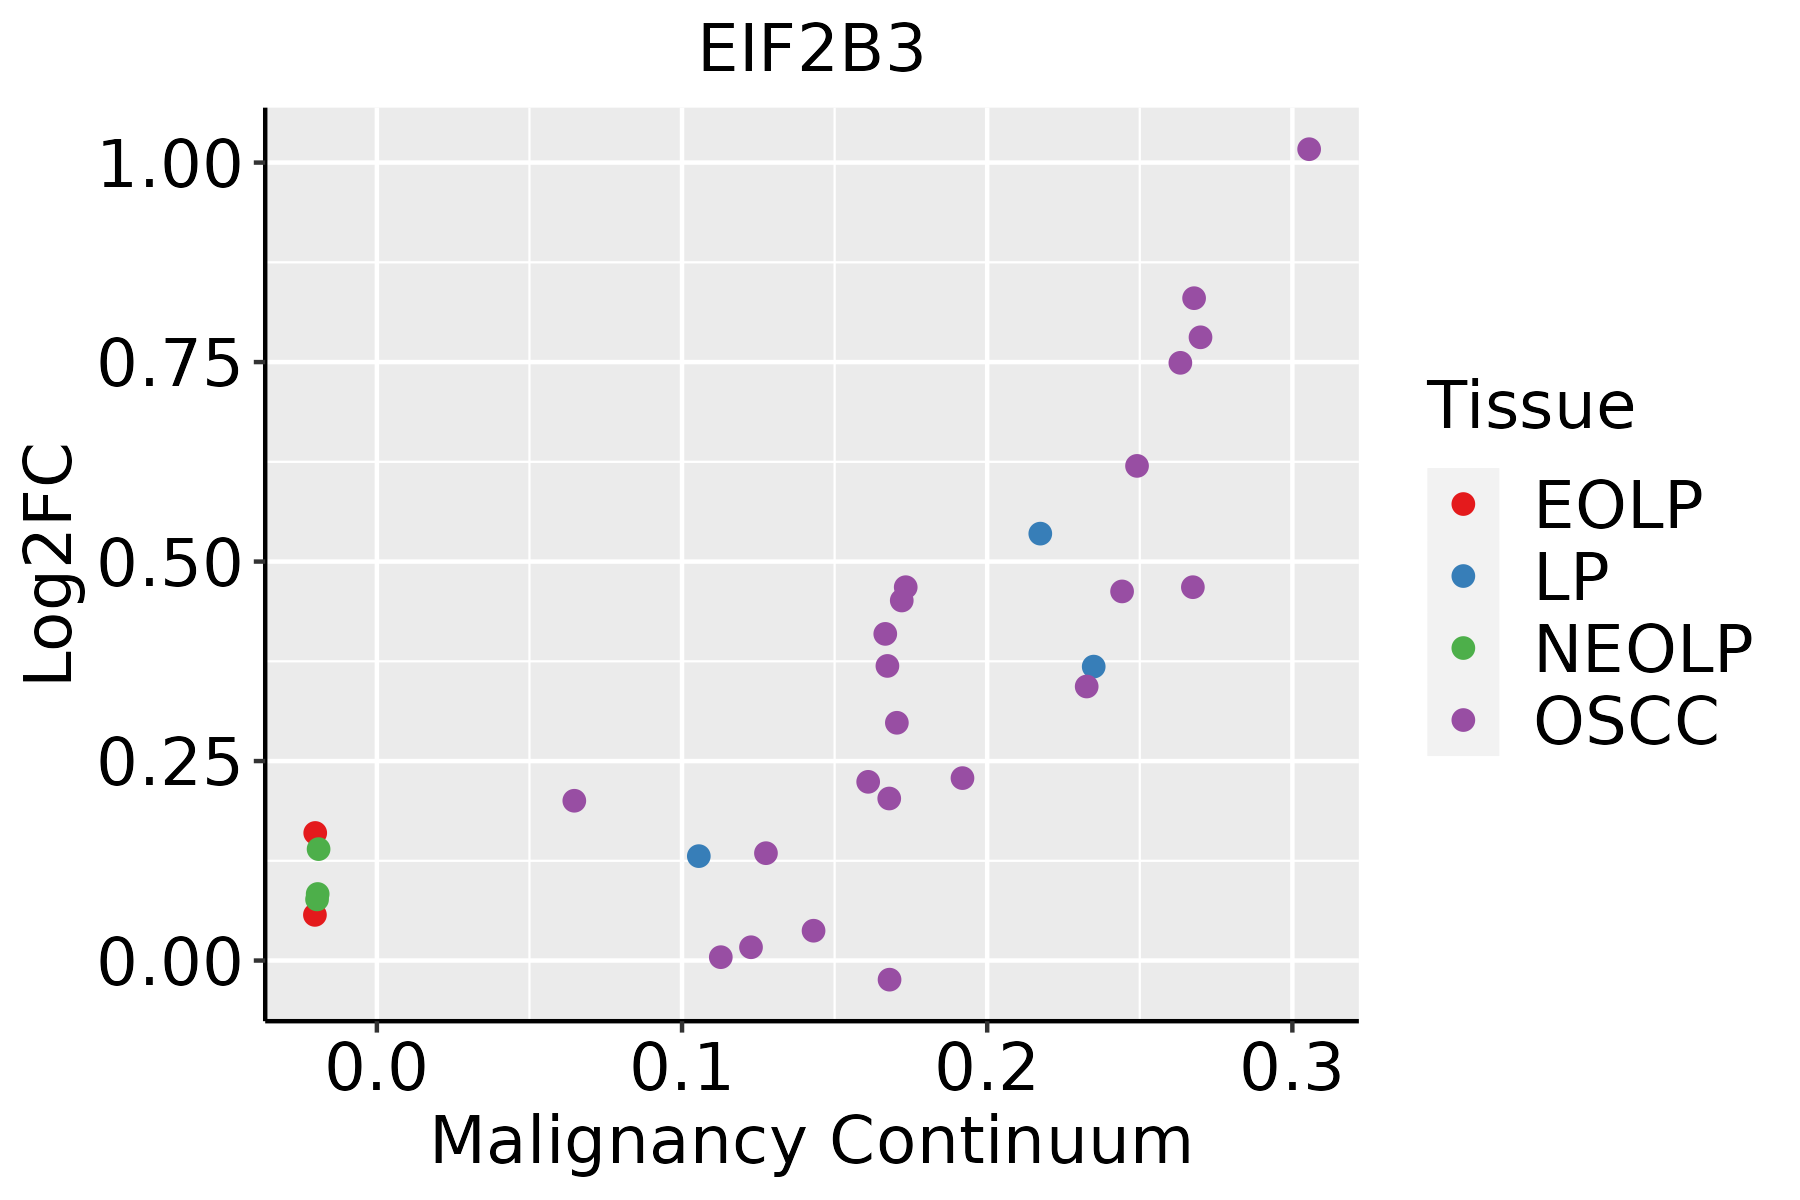 | EOLP: Erosive Oral lichen planus |
| LP: leukoplakia | ||
| NEOLP: Non-erosive oral lichen planus | ||
| OSCC: Oral squamous cell carcinoma | ||
| Skin | 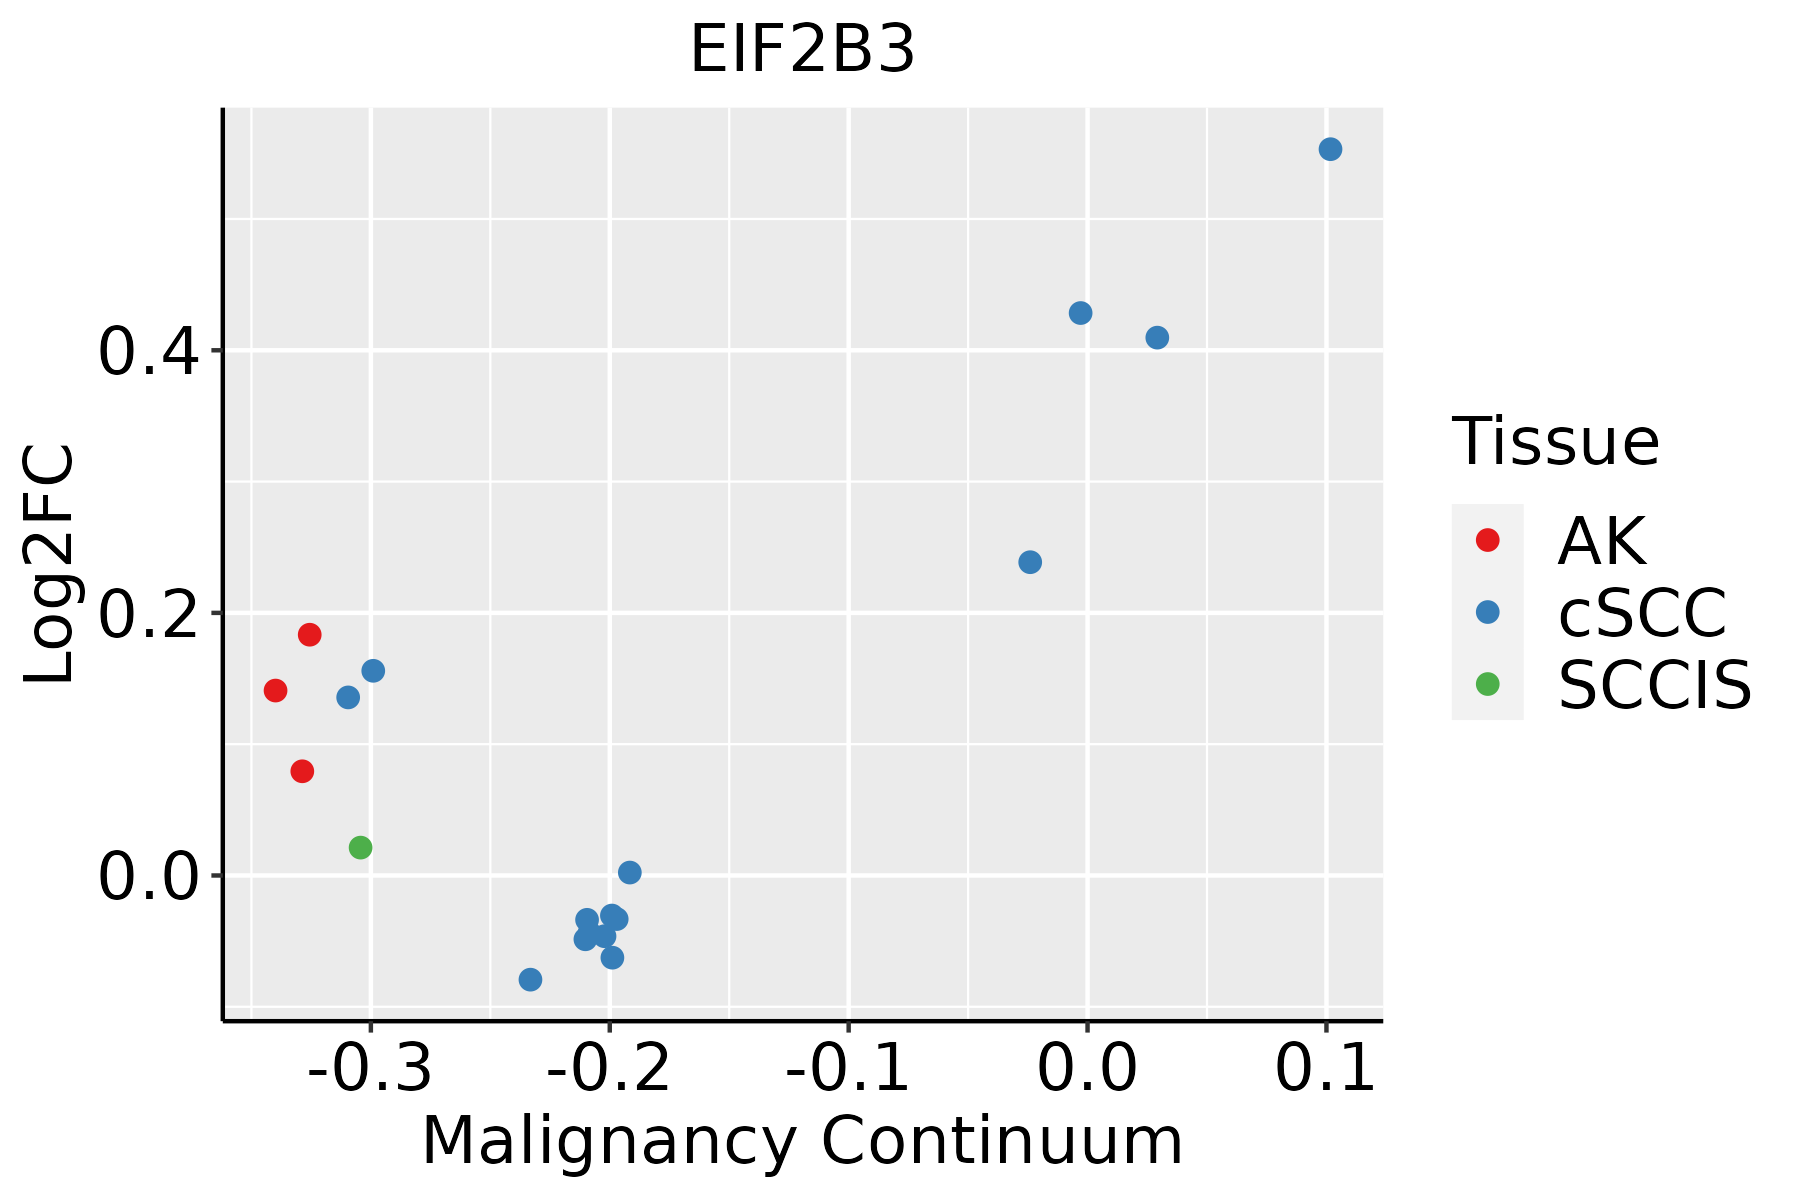 | AK: Actinic keratosis |
| cSCC: Cutaneous squamous cell carcinoma | ||
| SCCIS:squamous cell carcinoma in situ | ||
| Thyroid |  | ATC: Anaplastic thyroid cancer |
| HT: Hashimoto's thyroiditis | ||
| PTC: Papillary thyroid cancer |
| ∗log2FC in expression of this searched gene in stem-like cells from each diseased tissue sample relative to stem-like cells in normal samples in each tissue plotted against the malignancy continuum. Samples are colored based on if they are from different disease stage. |
Top |
Malignant transformation related pathway analysis |
| Find out the enriched GO biological processes and KEGG pathways involved in transition from healthy to precancer to cancer |
| Tissue | Disease Stage | Enriched GO biological Processes |
| Colorectum | AD |  |
| Colorectum | SER |  |
| Colorectum | MSS |  |
| Colorectum | MSI-H |  |
| Colorectum | FAP |  |
| ∗Top 15 enriched GO BP terms are showed in the bar plot of each disease state in each tissue. Each row represents a significant GO biological process which is colored according to the -log10(p.adjust). |
| Page: 1 2 3 4 5 6 7 8 9 |
| GO ID | Tissue | Disease Stage | Description | Gene Ratio | Bg Ratio | pvalue | p.adjust | Count |
| GO:0002181111 | Esophagus | ESCC | cytoplasmic translation | 135/8552 | 148/18723 | 4.17e-32 | 2.65e-29 | 135 |
| GO:0006413110 | Esophagus | ESCC | translational initiation | 100/8552 | 118/18723 | 1.16e-18 | 1.25e-16 | 100 |
| GO:0002183110 | Esophagus | ESCC | cytoplasmic translational initiation | 32/8552 | 34/18723 | 2.18e-09 | 4.94e-08 | 32 |
| GO:0009408110 | Esophagus | ESCC | response to heat | 77/8552 | 110/18723 | 2.01e-07 | 3.11e-06 | 77 |
| GO:0043434111 | Esophagus | ESCC | response to peptide hormone | 234/8552 | 414/18723 | 4.93e-06 | 5.21e-05 | 234 |
| GO:00420636 | Esophagus | ESCC | gliogenesis | 172/8552 | 301/18723 | 3.75e-05 | 3.04e-04 | 172 |
| GO:000926619 | Esophagus | ESCC | response to temperature stimulus | 106/8552 | 178/18723 | 1.30e-04 | 8.84e-04 | 106 |
| GO:00100016 | Esophagus | ESCC | glial cell differentiation | 129/8552 | 225/18723 | 2.73e-04 | 1.65e-03 | 129 |
| GO:00508528 | Esophagus | ESCC | T cell receptor signaling pathway | 73/8552 | 123/18723 | 1.54e-03 | 7.24e-03 | 73 |
| GO:00215436 | Esophagus | ESCC | pallium development | 94/8552 | 169/18723 | 5.79e-03 | 2.14e-02 | 94 |
| GO:0009743111 | Esophagus | ESCC | response to carbohydrate | 135/8552 | 253/18723 | 8.16e-03 | 2.89e-02 | 135 |
| GO:00487092 | Esophagus | ESCC | oligodendrocyte differentiation | 55/8552 | 95/18723 | 1.10e-02 | 3.72e-02 | 55 |
| GO:000218122 | Liver | HCC | cytoplasmic translation | 132/7958 | 148/18723 | 9.09e-33 | 5.76e-30 | 132 |
| GO:000641322 | Liver | HCC | translational initiation | 94/7958 | 118/18723 | 1.39e-16 | 1.24e-14 | 94 |
| GO:004343422 | Liver | HCC | response to peptide hormone | 247/7958 | 414/18723 | 9.55e-13 | 4.77e-11 | 247 |
| GO:000940811 | Liver | HCC | response to heat | 76/7958 | 110/18723 | 1.48e-08 | 3.58e-07 | 76 |
| GO:000974322 | Liver | HCC | response to carbohydrate | 149/7958 | 253/18723 | 9.55e-08 | 1.89e-06 | 149 |
| GO:000218322 | Liver | HCC | cytoplasmic translational initiation | 29/7958 | 34/18723 | 3.26e-07 | 5.62e-06 | 29 |
| GO:003428422 | Liver | HCC | response to monosaccharide | 131/7958 | 225/18723 | 1.32e-06 | 1.91e-05 | 131 |
| GO:000974622 | Liver | HCC | response to hexose | 126/7958 | 219/18723 | 4.81e-06 | 6.06e-05 | 126 |
| Page: 1 2 3 4 5 6 |
| Pathway ID | Tissue | Disease Stage | Description | Gene Ratio | Bg Ratio | pvalue | p.adjust | qvalue | Count |
| Page: 1 |
Top |
Cell-cell communication analysis |
| Identification of potential cell-cell interactions between two cell types and their ligand-receptor pairs for different disease states |
| Ligand | Receptor | LRpair | Pathway | Tissue | Disease Stage |
| Page: 1 |
Top |
Single-cell gene regulatory network inference analysis |
| Find out the significant the regulons (TFs) and the target genes of each regulon across cell types for different disease states |
| TF | Cell Type | Tissue | Disease Stage | Target Gene | RSS | Regulon Activity |
| ∗The dot plots of a searched regulon are shown for all cell subpopulations in each disease state of each tissue based on the regulon specific score inferred using pySCENIC and by calculating the average expression. |
| Page: 1 |
Top |
Somatic mutation of malignant transformation related genes |
| Annotation of somatic variants for genes involved in malignant transformation |
| Hugo Symbol | Variant Class | Variant Classification | dbSNP RS | HGVSc | HGVSp | HGVSp Short | SWISSPROT | BIOTYPE | SIFT | PolyPhen | Tumor Sample Barcode | Tissue | Histology | Sex | Age | Stage | Therapy Types | Drugs | Outcome |
| EIF2B3 | SNV | Missense_Mutation | rs749213552 | c.590C>T | p.Thr197Met | p.T197M | Q9NR50 | protein_coding | tolerated(0.06) | benign(0.379) | TCGA-A2-A0EU-01 | Breast | breast invasive carcinoma | Female | >=65 | I/II | Unknown | Unknown | SD |
| EIF2B3 | SNV | Missense_Mutation | novel | c.120G>T | p.Leu40Phe | p.L40F | Q9NR50 | protein_coding | deleterious(0) | probably_damaging(0.936) | TCGA-AN-A046-01 | Breast | breast invasive carcinoma | Female | >=65 | I/II | Unknown | Unknown | SD |
| EIF2B3 | SNV | Missense_Mutation | rs199638815 | c.1025C>T | p.Ser342Leu | p.S342L | Q9NR50 | protein_coding | tolerated(0.31) | benign(0.011) | TCGA-2W-A8YY-01 | Cervix | cervical & endocervical cancer | Female | <65 | I/II | Chemotherapy | cisplatin | CR |
| EIF2B3 | SNV | Missense_Mutation | novel | c.204N>C | p.Lys68Asn | p.K68N | Q9NR50 | protein_coding | tolerated(0.89) | benign(0.149) | TCGA-HM-A4S6-01 | Cervix | cervical & endocervical cancer | Female | <65 | III/IV | Chemotherapy | cisplatin | CR |
| EIF2B3 | SNV | Missense_Mutation | c.1344N>T | p.Gln448His | p.Q448H | Q9NR50 | protein_coding | deleterious(0.03) | benign(0.005) | TCGA-AA-3848-01 | Colorectum | colon adenocarcinoma | Female | >=65 | III/IV | Unknown | Unknown | PD | |
| EIF2B3 | SNV | Missense_Mutation | novel | c.437A>C | p.Lys146Thr | p.K146T | Q9NR50 | protein_coding | deleterious(0) | possibly_damaging(0.459) | TCGA-AZ-4315-01 | Colorectum | colon adenocarcinoma | Male | <65 | I/II | Unknown | Unknown | SD |
| EIF2B3 | SNV | Missense_Mutation | novel | c.494N>G | p.Lys165Arg | p.K165R | Q9NR50 | protein_coding | tolerated(0.16) | benign(0.003) | TCGA-CM-4744-01 | Colorectum | colon adenocarcinoma | Male | >=65 | I/II | Unknown | Unknown | SD |
| EIF2B3 | SNV | Missense_Mutation | c.31N>T | p.Gly11Cys | p.G11C | Q9NR50 | protein_coding | deleterious(0) | probably_damaging(1) | TCGA-QG-A5Z2-01 | Colorectum | colon adenocarcinoma | Male | <65 | I/II | Unknown | Unknown | SD | |
| EIF2B3 | SNV | Missense_Mutation | novel | c.1238N>A | p.Ala413Asp | p.A413D | Q9NR50 | protein_coding | deleterious(0) | possibly_damaging(0.841) | TCGA-A5-A0G2-01 | Endometrium | uterine corpus endometrioid carcinoma | Female | <65 | III/IV | Unknown | Unknown | SD |
| EIF2B3 | SNV | Missense_Mutation | novel | c.1075N>A | p.Gly359Arg | p.G359R | Q9NR50 | protein_coding | deleterious(0) | probably_damaging(0.931) | TCGA-AJ-A2QO-01 | Endometrium | uterine corpus endometrioid carcinoma | Female | >=65 | I/II | Unknown | Unknown | SD |
| Page: 1 2 3 4 5 |
Top |
Related drugs of malignant transformation related genes |
| Identification of chemicals and drugs interact with genes involved in malignant transfromation |
| (DGIdb 4.0) |
| Entrez ID | Symbol | Category | Interaction Types | Drug Claim Name | Drug Name | PMIDs |
| Page: 1 |

Copyright 2023-Present -The University of Texas Health Science Center at Houston |