
|
|||||
|
 | |
| |
| |
| |
| |
| |
|
Gene: EIF2B2 |
Gene summary for EIF2B2 |
| Gene information | Species | Human | Gene symbol | EIF2B2 | Gene ID | 8892 |
| Gene name | eukaryotic translation initiation factor 2B subunit beta | |
| Gene Alias | EIF-2Bbeta | |
| Cytomap | 14q24.3 | |
| Gene Type | protein-coding | GO ID | GO:0000003 | UniProtAcc | P49770 |
Top |
Malignant transformation analysis |
| Identification of the aberrant gene expression in precancerous and cancerous lesions by comparing the gene expression of stem-like cells in diseased tissues with normal stem cells |
| Entrez ID | Symbol | Replicates | Species | Organ | Tissue | Adj P-value | Log2FC | Malignancy |
| 8892 | EIF2B2 | LZE4T | Human | Esophagus | ESCC | 1.17e-09 | 3.77e-01 | 0.0811 |
| 8892 | EIF2B2 | LZE5T | Human | Esophagus | ESCC | 2.77e-03 | 2.84e-01 | 0.0514 |
| 8892 | EIF2B2 | LZE8T | Human | Esophagus | ESCC | 7.53e-04 | 6.22e-02 | 0.067 |
| 8892 | EIF2B2 | LZE20T | Human | Esophagus | ESCC | 4.11e-05 | 2.17e-01 | 0.0662 |
| 8892 | EIF2B2 | LZE21D1 | Human | Esophagus | HGIN | 3.64e-02 | 1.92e-01 | 0.0632 |
| 8892 | EIF2B2 | LZE22D1 | Human | Esophagus | HGIN | 4.94e-02 | 5.78e-02 | 0.0595 |
| 8892 | EIF2B2 | LZE22T | Human | Esophagus | ESCC | 1.23e-06 | 3.61e-01 | 0.068 |
| 8892 | EIF2B2 | LZE24T | Human | Esophagus | ESCC | 4.08e-12 | 4.13e-01 | 0.0596 |
| 8892 | EIF2B2 | LZE6T | Human | Esophagus | ESCC | 3.41e-05 | 1.91e-01 | 0.0845 |
| 8892 | EIF2B2 | P1T-E | Human | Esophagus | ESCC | 2.43e-07 | 3.74e-01 | 0.0875 |
| 8892 | EIF2B2 | P2T-E | Human | Esophagus | ESCC | 9.27e-20 | 3.94e-01 | 0.1177 |
| 8892 | EIF2B2 | P4T-E | Human | Esophagus | ESCC | 2.54e-26 | 5.58e-01 | 0.1323 |
| 8892 | EIF2B2 | P5T-E | Human | Esophagus | ESCC | 1.82e-16 | 4.52e-01 | 0.1327 |
| 8892 | EIF2B2 | P8T-E | Human | Esophagus | ESCC | 4.33e-21 | 4.40e-01 | 0.0889 |
| 8892 | EIF2B2 | P9T-E | Human | Esophagus | ESCC | 2.31e-09 | 1.85e-01 | 0.1131 |
| 8892 | EIF2B2 | P10T-E | Human | Esophagus | ESCC | 4.14e-27 | 5.51e-01 | 0.116 |
| 8892 | EIF2B2 | P11T-E | Human | Esophagus | ESCC | 6.35e-16 | 6.42e-01 | 0.1426 |
| 8892 | EIF2B2 | P12T-E | Human | Esophagus | ESCC | 7.00e-20 | 4.49e-01 | 0.1122 |
| 8892 | EIF2B2 | P15T-E | Human | Esophagus | ESCC | 2.69e-35 | 8.09e-01 | 0.1149 |
| 8892 | EIF2B2 | P16T-E | Human | Esophagus | ESCC | 1.73e-22 | 5.41e-01 | 0.1153 |
| Page: 1 2 3 4 5 6 |
| Tissue | Expression Dynamics | Abbreviation |
| Esophagus | 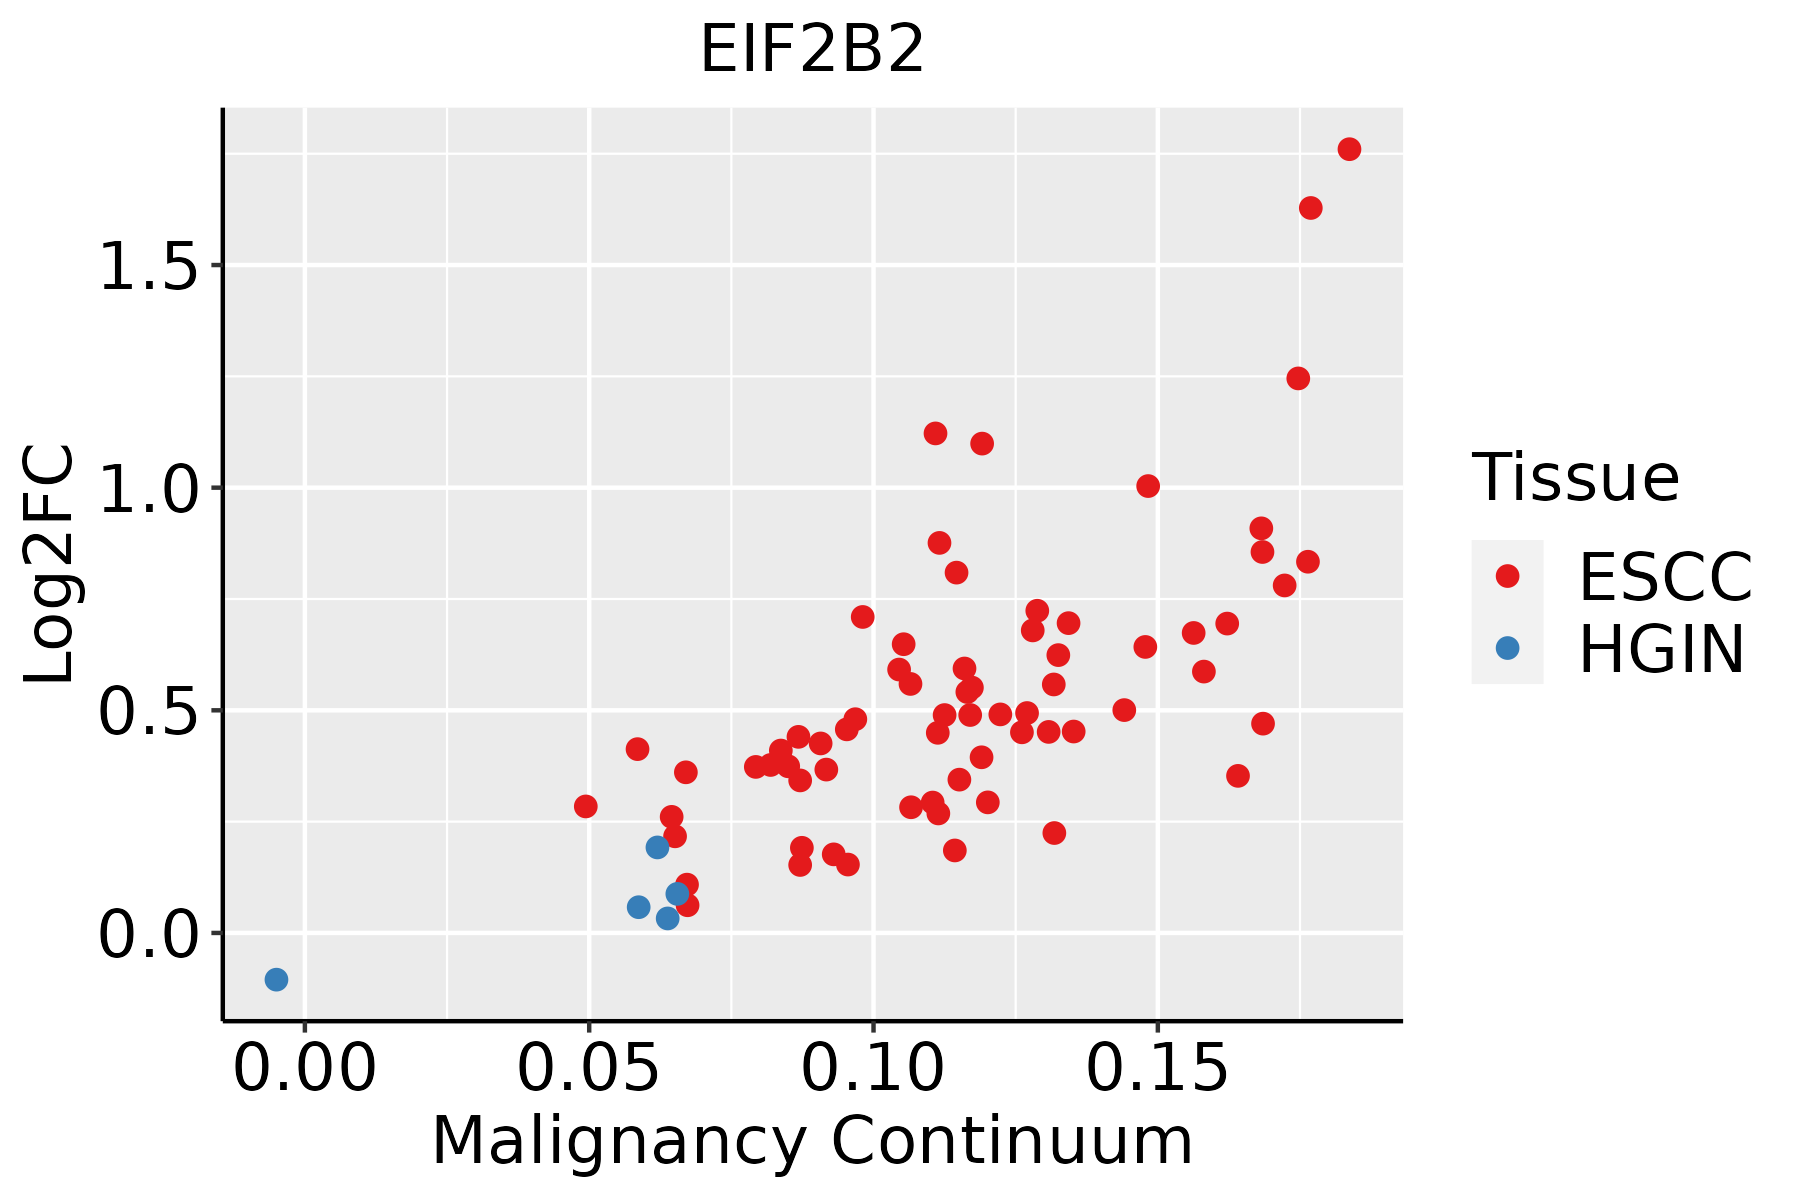 | ESCC: Esophageal squamous cell carcinoma |
| HGIN: High-grade intraepithelial neoplasias | ||
| LGIN: Low-grade intraepithelial neoplasias | ||
| Liver | 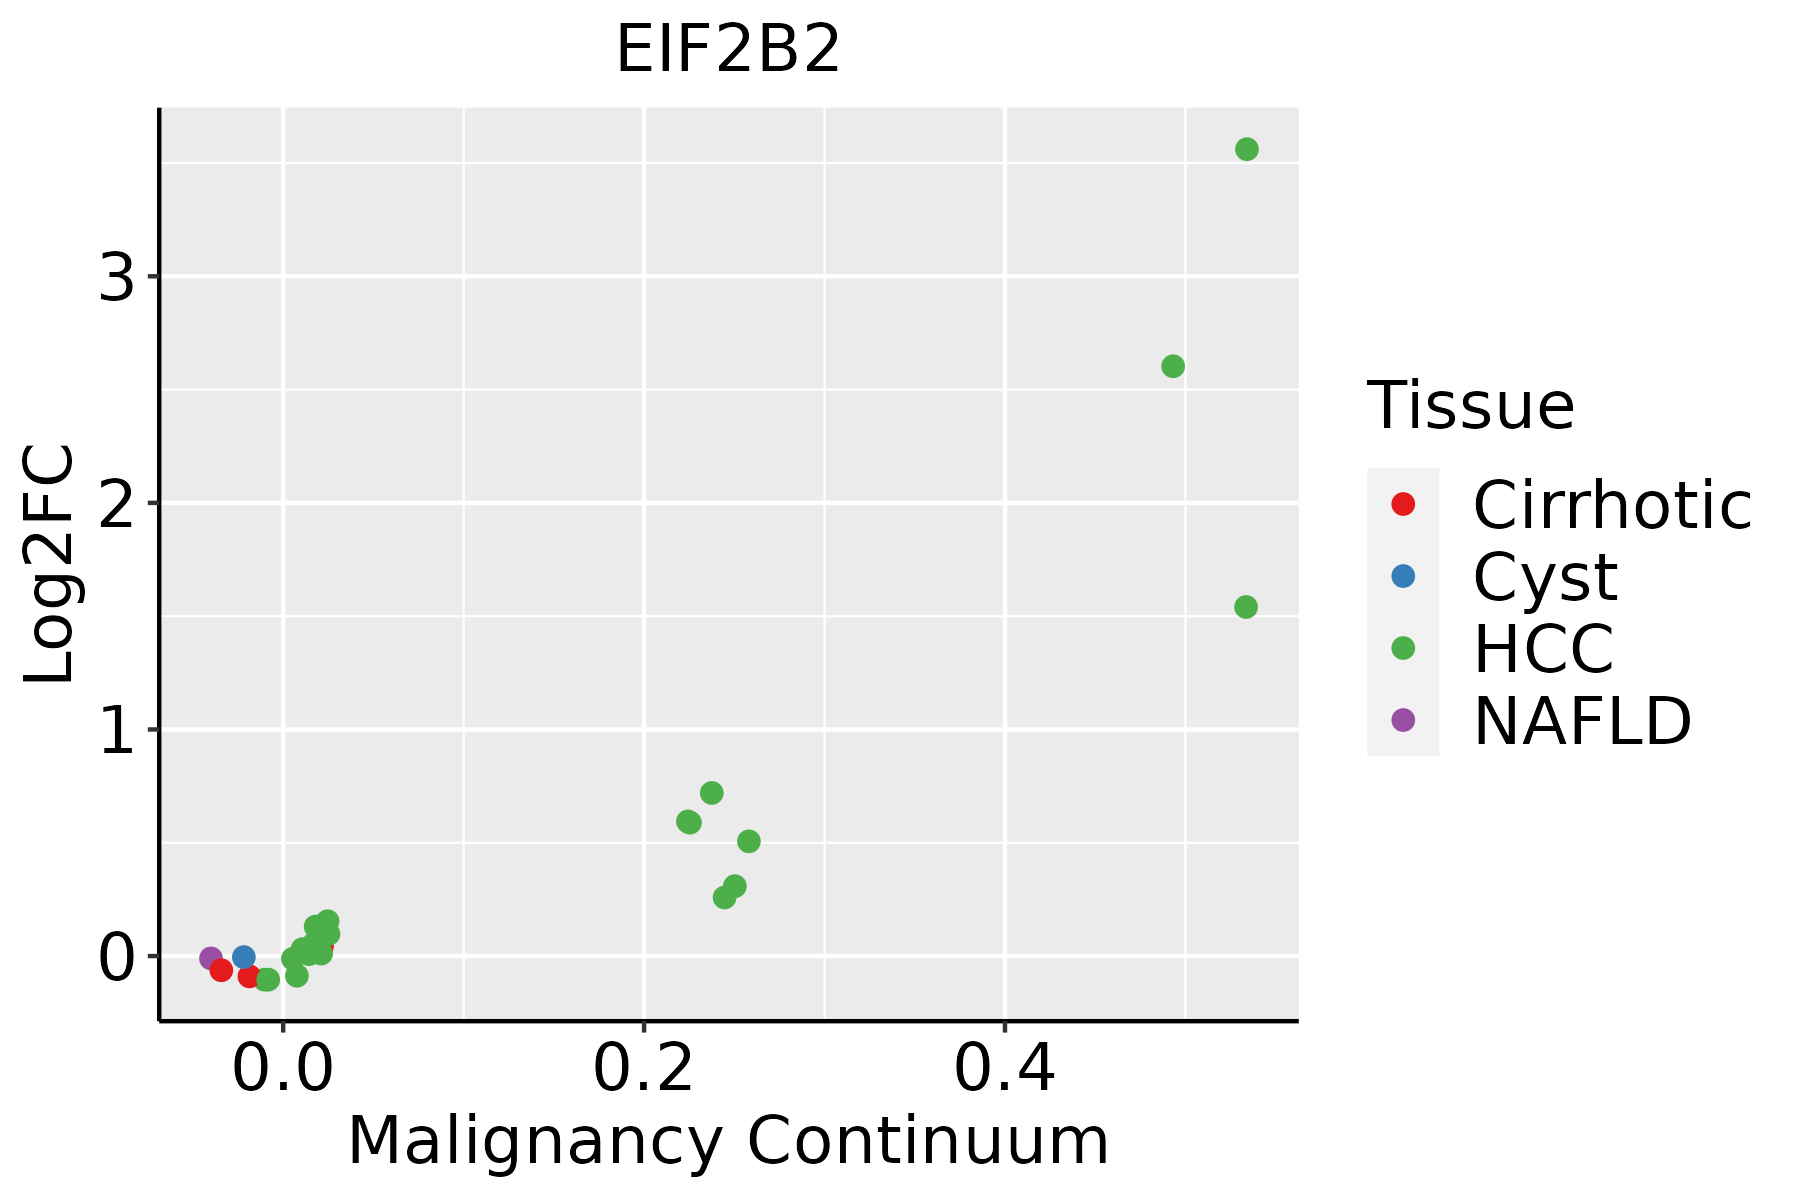 | HCC: Hepatocellular carcinoma |
| NAFLD: Non-alcoholic fatty liver disease | ||
| Oral Cavity |  | EOLP: Erosive Oral lichen planus |
| LP: leukoplakia | ||
| NEOLP: Non-erosive oral lichen planus | ||
| OSCC: Oral squamous cell carcinoma | ||
| Skin | 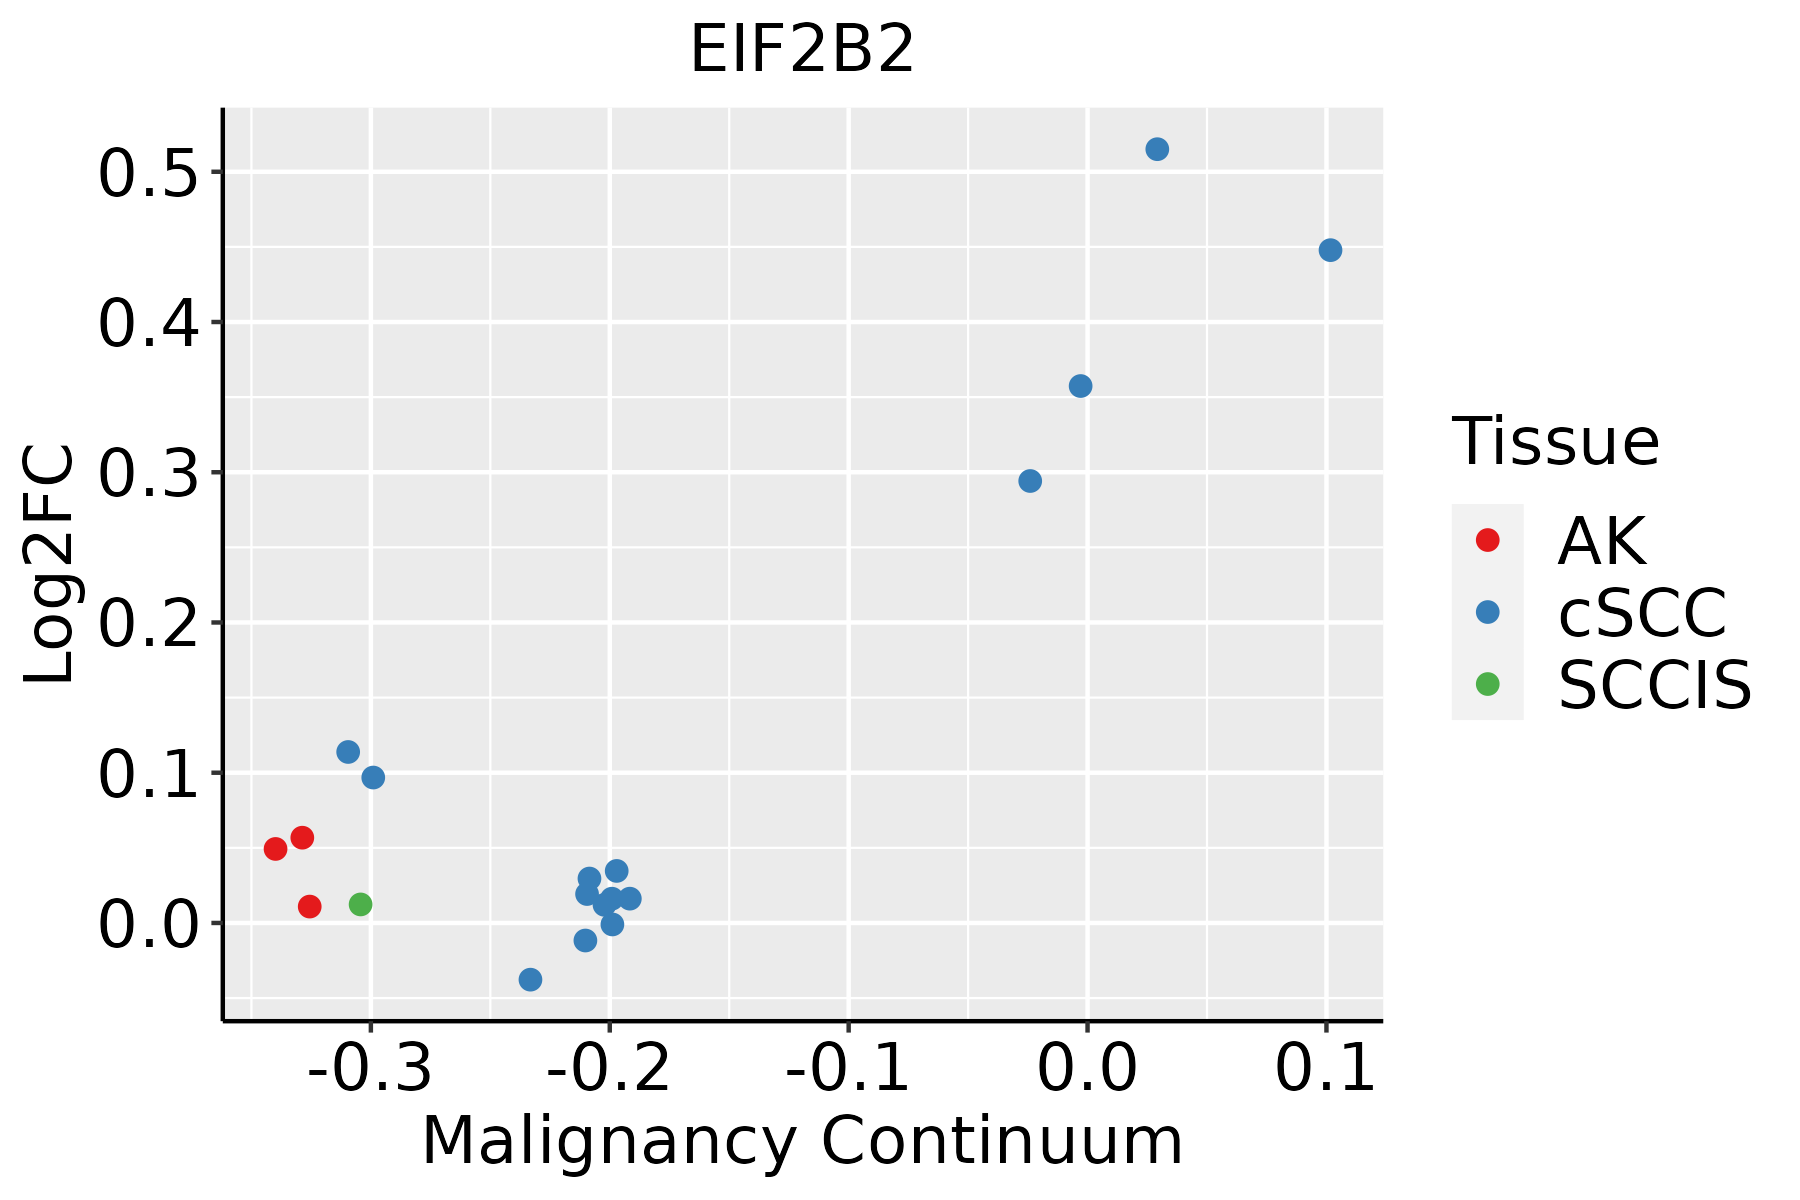 | AK: Actinic keratosis |
| cSCC: Cutaneous squamous cell carcinoma | ||
| SCCIS:squamous cell carcinoma in situ | ||
| Thyroid |  | ATC: Anaplastic thyroid cancer |
| HT: Hashimoto's thyroiditis | ||
| PTC: Papillary thyroid cancer |
| ∗log2FC in expression of this searched gene in stem-like cells from each diseased tissue sample relative to stem-like cells in normal samples in each tissue plotted against the malignancy continuum. Samples are colored based on if they are from different disease stage. |
Top |
Malignant transformation related pathway analysis |
| Find out the enriched GO biological processes and KEGG pathways involved in transition from healthy to precancer to cancer |
| Tissue | Disease Stage | Enriched GO biological Processes |
| Colorectum | AD |  |
| Colorectum | SER |  |
| Colorectum | MSS |  |
| Colorectum | MSI-H |  |
| Colorectum | FAP |  |
| ∗Top 15 enriched GO BP terms are showed in the bar plot of each disease state in each tissue. Each row represents a significant GO biological process which is colored according to the -log10(p.adjust). |
| Page: 1 2 3 4 5 6 7 8 9 |
| GO ID | Tissue | Disease Stage | Description | Gene Ratio | Bg Ratio | pvalue | p.adjust | Count |
| GO:000641727 | Esophagus | HGIN | regulation of translation | 139/2587 | 468/18723 | 1.46e-19 | 7.98e-17 | 139 |
| GO:000641320 | Esophagus | HGIN | translational initiation | 55/2587 | 118/18723 | 7.33e-18 | 2.31e-15 | 55 |
| GO:000644610 | Esophagus | HGIN | regulation of translational initiation | 34/2587 | 79/18723 | 2.09e-10 | 1.97e-08 | 34 |
| GO:000940819 | Esophagus | HGIN | response to heat | 34/2587 | 110/18723 | 2.94e-06 | 1.01e-04 | 34 |
| GO:000926618 | Esophagus | HGIN | response to temperature stimulus | 42/2587 | 178/18723 | 2.91e-04 | 4.98e-03 | 42 |
| GO:004343420 | Esophagus | HGIN | response to peptide hormone | 79/2587 | 414/18723 | 1.60e-03 | 1.79e-02 | 79 |
| GO:000974326 | Esophagus | HGIN | response to carbohydrate | 50/2587 | 253/18723 | 5.27e-03 | 4.35e-02 | 50 |
| GO:006145819 | Esophagus | HGIN | reproductive system development | 78/2587 | 427/18723 | 5.53e-03 | 4.52e-02 | 78 |
| GO:0006413110 | Esophagus | ESCC | translational initiation | 100/8552 | 118/18723 | 1.16e-18 | 1.25e-16 | 100 |
| GO:0006417111 | Esophagus | ESCC | regulation of translation | 304/8552 | 468/18723 | 1.53e-17 | 1.33e-15 | 304 |
| GO:000644617 | Esophagus | ESCC | regulation of translational initiation | 65/8552 | 79/18723 | 2.04e-11 | 7.07e-10 | 65 |
| GO:0009408110 | Esophagus | ESCC | response to heat | 77/8552 | 110/18723 | 2.01e-07 | 3.11e-06 | 77 |
| GO:0061458110 | Esophagus | ESCC | reproductive system development | 247/8552 | 427/18723 | 2.24e-07 | 3.42e-06 | 247 |
| GO:004860818 | Esophagus | ESCC | reproductive structure development | 245/8552 | 424/18723 | 2.82e-07 | 4.14e-06 | 245 |
| GO:0043434111 | Esophagus | ESCC | response to peptide hormone | 234/8552 | 414/18723 | 4.93e-06 | 5.21e-05 | 234 |
| GO:00425524 | Esophagus | ESCC | myelination | 85/8552 | 134/18723 | 2.51e-05 | 2.13e-04 | 85 |
| GO:00072724 | Esophagus | ESCC | ensheathment of neurons | 86/8552 | 136/18723 | 2.68e-05 | 2.24e-04 | 86 |
| GO:00083664 | Esophagus | ESCC | axon ensheathment | 86/8552 | 136/18723 | 2.68e-05 | 2.24e-04 | 86 |
| GO:00420636 | Esophagus | ESCC | gliogenesis | 172/8552 | 301/18723 | 3.75e-05 | 3.04e-04 | 172 |
| GO:000926619 | Esophagus | ESCC | response to temperature stimulus | 106/8552 | 178/18723 | 1.30e-04 | 8.84e-04 | 106 |
| Page: 1 2 3 4 5 6 7 |
| Pathway ID | Tissue | Disease Stage | Description | Gene Ratio | Bg Ratio | pvalue | p.adjust | qvalue | Count |
| Page: 1 |
Top |
Cell-cell communication analysis |
| Identification of potential cell-cell interactions between two cell types and their ligand-receptor pairs for different disease states |
| Ligand | Receptor | LRpair | Pathway | Tissue | Disease Stage |
| Page: 1 |
Top |
Single-cell gene regulatory network inference analysis |
| Find out the significant the regulons (TFs) and the target genes of each regulon across cell types for different disease states |
| TF | Cell Type | Tissue | Disease Stage | Target Gene | RSS | Regulon Activity |
| ∗The dot plots of a searched regulon are shown for all cell subpopulations in each disease state of each tissue based on the regulon specific score inferred using pySCENIC and by calculating the average expression. |
| Page: 1 |
Top |
Somatic mutation of malignant transformation related genes |
| Annotation of somatic variants for genes involved in malignant transformation |
| Hugo Symbol | Variant Class | Variant Classification | dbSNP RS | HGVSc | HGVSp | HGVSp Short | SWISSPROT | BIOTYPE | SIFT | PolyPhen | Tumor Sample Barcode | Tissue | Histology | Sex | Age | Stage | Therapy Types | Drugs | Outcome |
| EIF2B2 | SNV | Missense_Mutation | c.301N>A | p.Asp101Asn | p.D101N | P49770 | protein_coding | tolerated(0.11) | possibly_damaging(0.595) | TCGA-A8-A09G-01 | Breast | breast invasive carcinoma | Female | >=65 | III/IV | Unknown | Unknown | SD | |
| EIF2B2 | SNV | Missense_Mutation | rs779106104 | c.132N>C | p.Gln44His | p.Q44H | P49770 | protein_coding | tolerated(0.26) | benign(0.001) | TCGA-C5-A1BQ-01 | Cervix | cervical & endocervical cancer | Female | >=65 | III/IV | Chemotherapy | cisplatin | CR |
| EIF2B2 | SNV | Missense_Mutation | rs779106104 | c.132N>C | p.Gln44His | p.Q44H | P49770 | protein_coding | tolerated(0.26) | benign(0.001) | TCGA-C5-A3HL-01 | Cervix | cervical & endocervical cancer | Female | >=65 | I/II | Unknown | Unknown | SD |
| EIF2B2 | SNV | Missense_Mutation | c.466N>G | p.Leu156Val | p.L156V | P49770 | protein_coding | tolerated(0.27) | benign(0.213) | TCGA-EK-A2R8-01 | Cervix | cervical & endocervical cancer | Female | <65 | I/II | Unknown | Unknown | SD | |
| EIF2B2 | SNV | Missense_Mutation | c.769N>A | p.Ala257Thr | p.A257T | P49770 | protein_coding | deleterious(0) | probably_damaging(0.973) | TCGA-AD-A5EJ-01 | Colorectum | colon adenocarcinoma | Female | >=65 | I/II | Unknown | Unknown | SD | |
| EIF2B2 | SNV | Missense_Mutation | c.196N>T | p.Arg66Trp | p.R66W | P49770 | protein_coding | deleterious(0.01) | probably_damaging(0.928) | TCGA-AG-A036-01 | Colorectum | rectum adenocarcinoma | Male | >=65 | III/IV | Chemotherapy | 5-fluorouracil | CR | |
| EIF2B2 | SNV | Missense_Mutation | c.51N>A | p.Ser17Arg | p.S17R | P49770 | protein_coding | tolerated(0.23) | benign(0.019) | TCGA-AP-A059-01 | Endometrium | uterine corpus endometrioid carcinoma | Female | >=65 | I/II | Unknown | Unknown | SD | |
| EIF2B2 | SNV | Missense_Mutation | c.462N>T | p.Gln154His | p.Q154H | P49770 | protein_coding | deleterious(0) | probably_damaging(0.919) | TCGA-AP-A0LM-01 | Endometrium | uterine corpus endometrioid carcinoma | Female | <65 | III/IV | Chemotherapy | cisplatin | SD | |
| EIF2B2 | SNV | Missense_Mutation | novel | c.439N>G | p.Thr147Ala | p.T147A | P49770 | protein_coding | tolerated(0.26) | benign(0.065) | TCGA-AP-A1DV-01 | Endometrium | uterine corpus endometrioid carcinoma | Female | <65 | I/II | Unknown | Unknown | SD |
| EIF2B2 | SNV | Missense_Mutation | novel | c.1013N>A | p.Arg338His | p.R338H | P49770 | protein_coding | deleterious(0) | probably_damaging(0.993) | TCGA-AP-A1DV-01 | Endometrium | uterine corpus endometrioid carcinoma | Female | <65 | I/II | Unknown | Unknown | SD |
| Page: 1 2 3 |
Top |
Related drugs of malignant transformation related genes |
| Identification of chemicals and drugs interact with genes involved in malignant transfromation |
| (DGIdb 4.0) |
| Entrez ID | Symbol | Category | Interaction Types | Drug Claim Name | Drug Name | PMIDs |
| Page: 1 |

Copyright 2023-Present -The University of Texas Health Science Center at Houston |