
|
|||||
|
 | |
| |
| |
| |
| |
| |
|
Gene: EIF2B1 |
Gene summary for EIF2B1 |
| Gene information | Species | Human | Gene symbol | EIF2B1 | Gene ID | 1967 |
| Gene name | eukaryotic translation initiation factor 2B subunit alpha | |
| Gene Alias | EIF2B | |
| Cytomap | 12q24.31 | |
| Gene Type | protein-coding | GO ID | GO:0002253 | UniProtAcc | Q14232 |
Top |
Malignant transformation analysis |
| Identification of the aberrant gene expression in precancerous and cancerous lesions by comparing the gene expression of stem-like cells in diseased tissues with normal stem cells |
| Entrez ID | Symbol | Replicates | Species | Organ | Tissue | Adj P-value | Log2FC | Malignancy |
| 1967 | EIF2B1 | LZE4T | Human | Esophagus | ESCC | 5.47e-11 | 1.95e-01 | 0.0811 |
| 1967 | EIF2B1 | LZE7T | Human | Esophagus | ESCC | 5.11e-07 | 4.97e-01 | 0.0667 |
| 1967 | EIF2B1 | LZE8T | Human | Esophagus | ESCC | 2.95e-02 | 6.09e-02 | 0.067 |
| 1967 | EIF2B1 | LZE20T | Human | Esophagus | ESCC | 1.20e-03 | 1.35e-01 | 0.0662 |
| 1967 | EIF2B1 | LZE22T | Human | Esophagus | ESCC | 2.21e-02 | 3.46e-01 | 0.068 |
| 1967 | EIF2B1 | LZE24T | Human | Esophagus | ESCC | 6.65e-23 | 6.28e-01 | 0.0596 |
| 1967 | EIF2B1 | LZE21T | Human | Esophagus | ESCC | 1.17e-04 | 2.49e-01 | 0.0655 |
| 1967 | EIF2B1 | LZE6T | Human | Esophagus | ESCC | 7.04e-05 | 2.16e-01 | 0.0845 |
| 1967 | EIF2B1 | P1T-E | Human | Esophagus | ESCC | 2.27e-11 | 4.46e-01 | 0.0875 |
| 1967 | EIF2B1 | P2T-E | Human | Esophagus | ESCC | 4.93e-58 | 1.08e+00 | 0.1177 |
| 1967 | EIF2B1 | P4T-E | Human | Esophagus | ESCC | 2.31e-25 | 6.56e-01 | 0.1323 |
| 1967 | EIF2B1 | P5T-E | Human | Esophagus | ESCC | 8.63e-19 | 3.17e-01 | 0.1327 |
| 1967 | EIF2B1 | P8T-E | Human | Esophagus | ESCC | 1.71e-35 | 5.72e-01 | 0.0889 |
| 1967 | EIF2B1 | P9T-E | Human | Esophagus | ESCC | 1.61e-13 | 2.26e-01 | 0.1131 |
| 1967 | EIF2B1 | P10T-E | Human | Esophagus | ESCC | 2.86e-31 | 4.99e-01 | 0.116 |
| 1967 | EIF2B1 | P11T-E | Human | Esophagus | ESCC | 1.08e-20 | 7.51e-01 | 0.1426 |
| 1967 | EIF2B1 | P12T-E | Human | Esophagus | ESCC | 1.47e-23 | 3.98e-01 | 0.1122 |
| 1967 | EIF2B1 | P15T-E | Human | Esophagus | ESCC | 1.09e-22 | 4.36e-01 | 0.1149 |
| 1967 | EIF2B1 | P16T-E | Human | Esophagus | ESCC | 2.05e-30 | 5.64e-01 | 0.1153 |
| 1967 | EIF2B1 | P17T-E | Human | Esophagus | ESCC | 1.35e-08 | 4.01e-01 | 0.1278 |
| Page: 1 2 3 4 5 6 |
| Tissue | Expression Dynamics | Abbreviation |
| Esophagus | 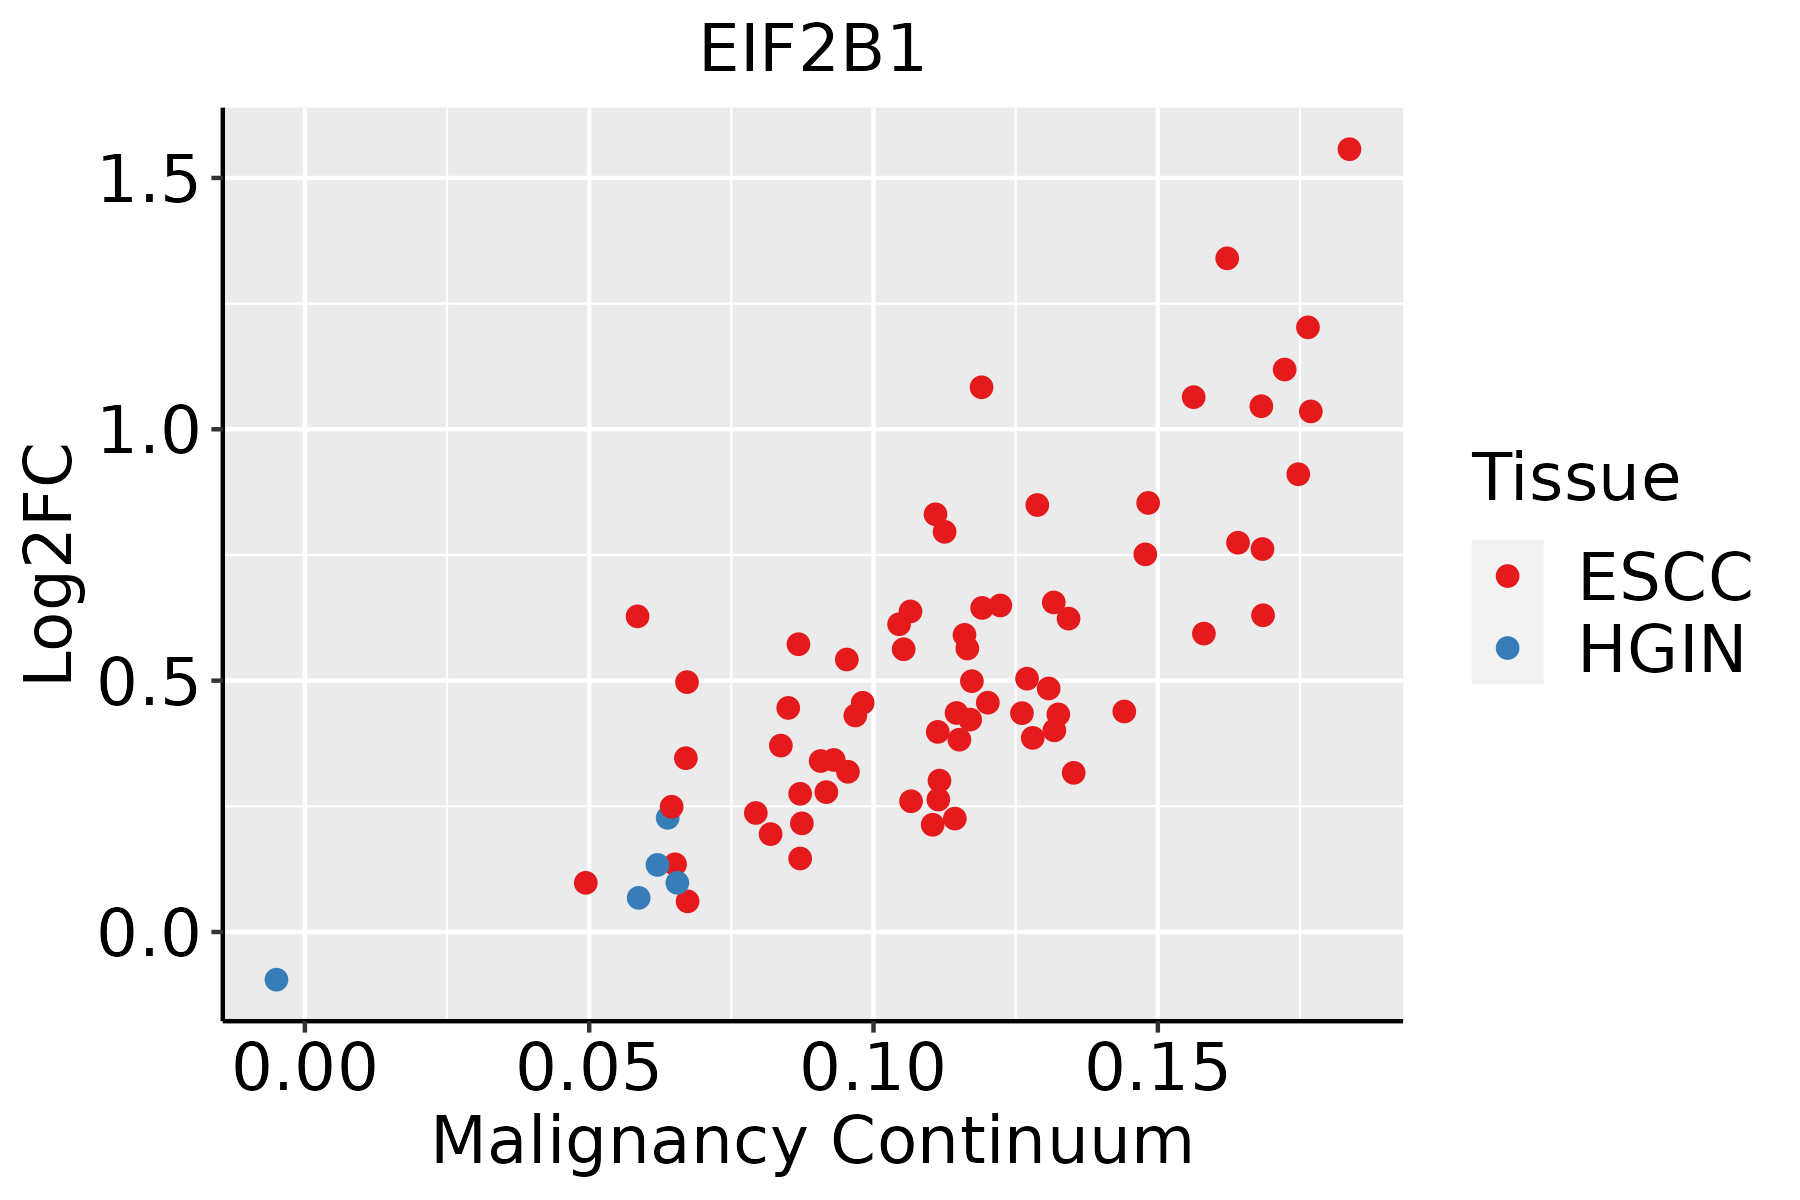 | ESCC: Esophageal squamous cell carcinoma |
| HGIN: High-grade intraepithelial neoplasias | ||
| LGIN: Low-grade intraepithelial neoplasias | ||
| Liver | 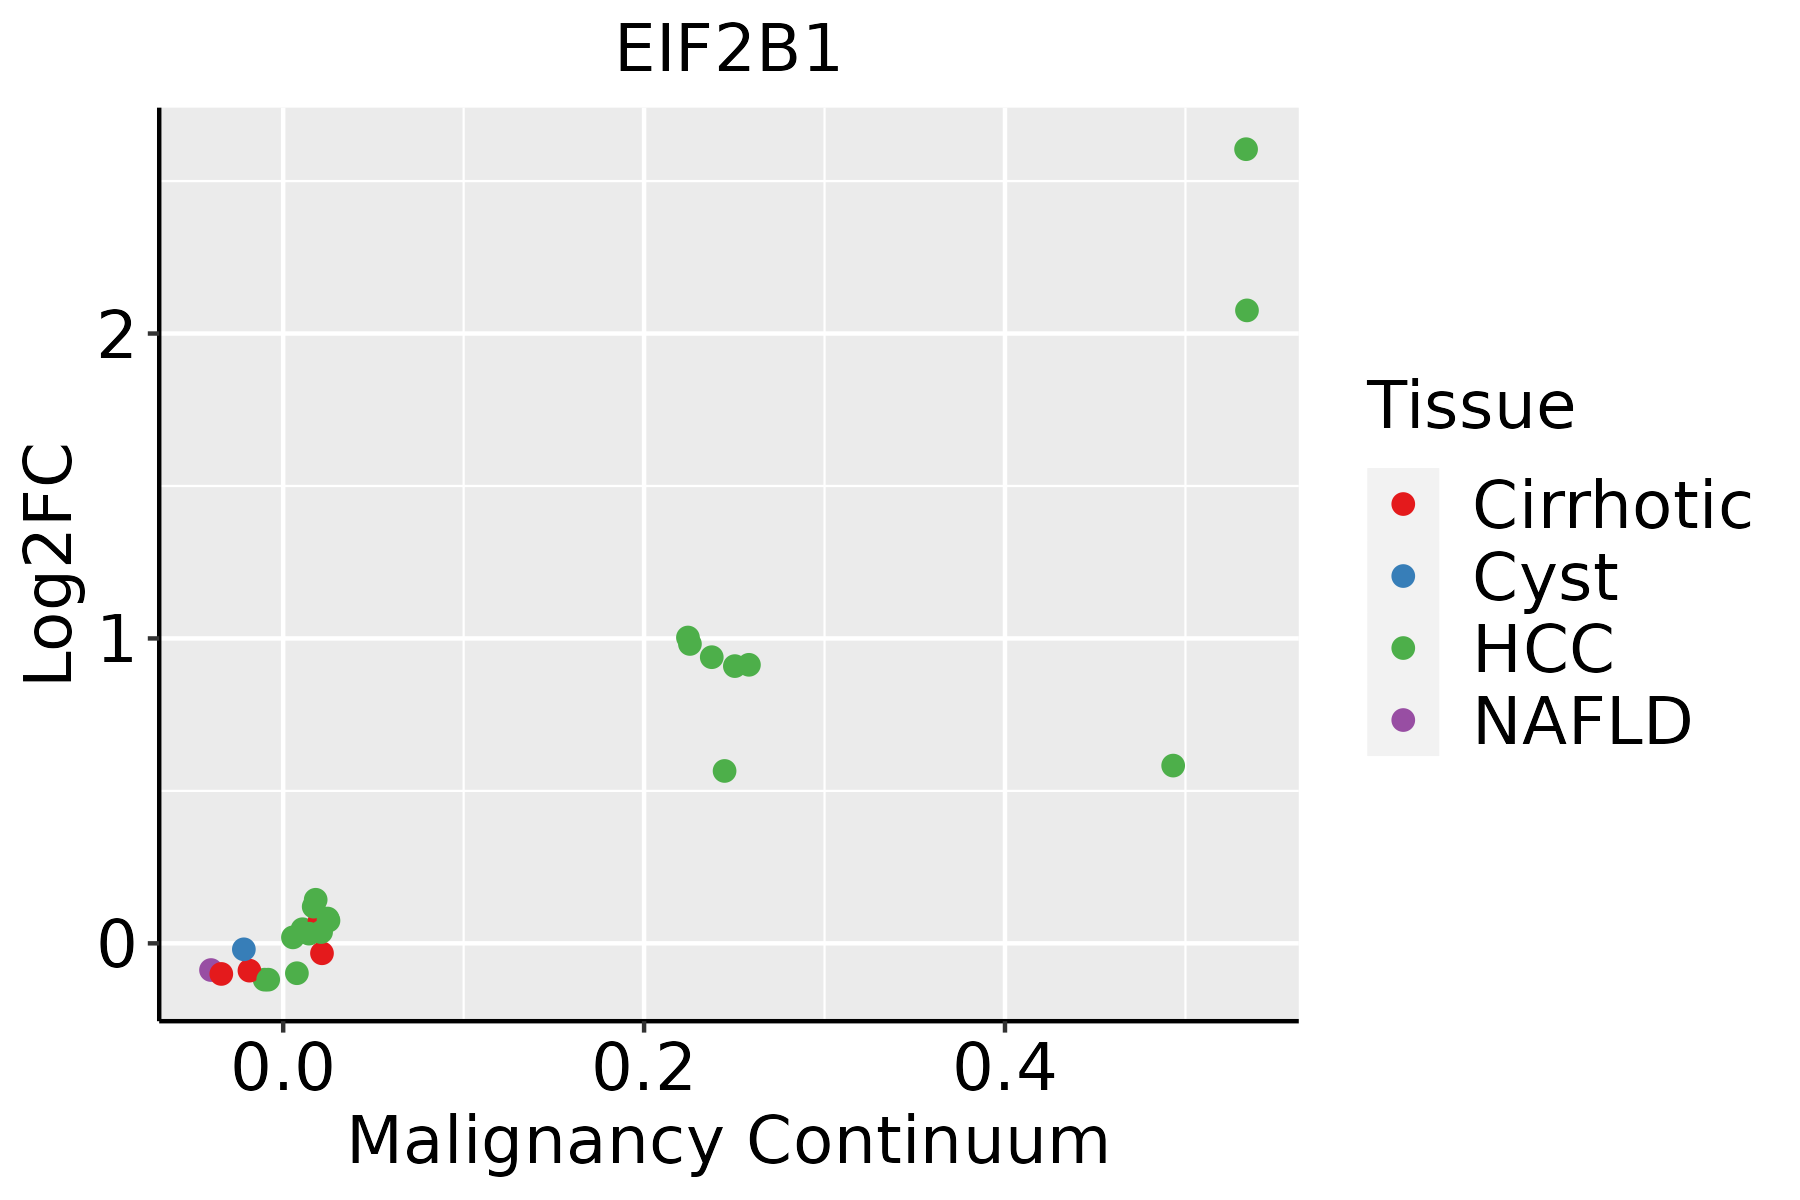 | HCC: Hepatocellular carcinoma |
| NAFLD: Non-alcoholic fatty liver disease | ||
| Oral Cavity | 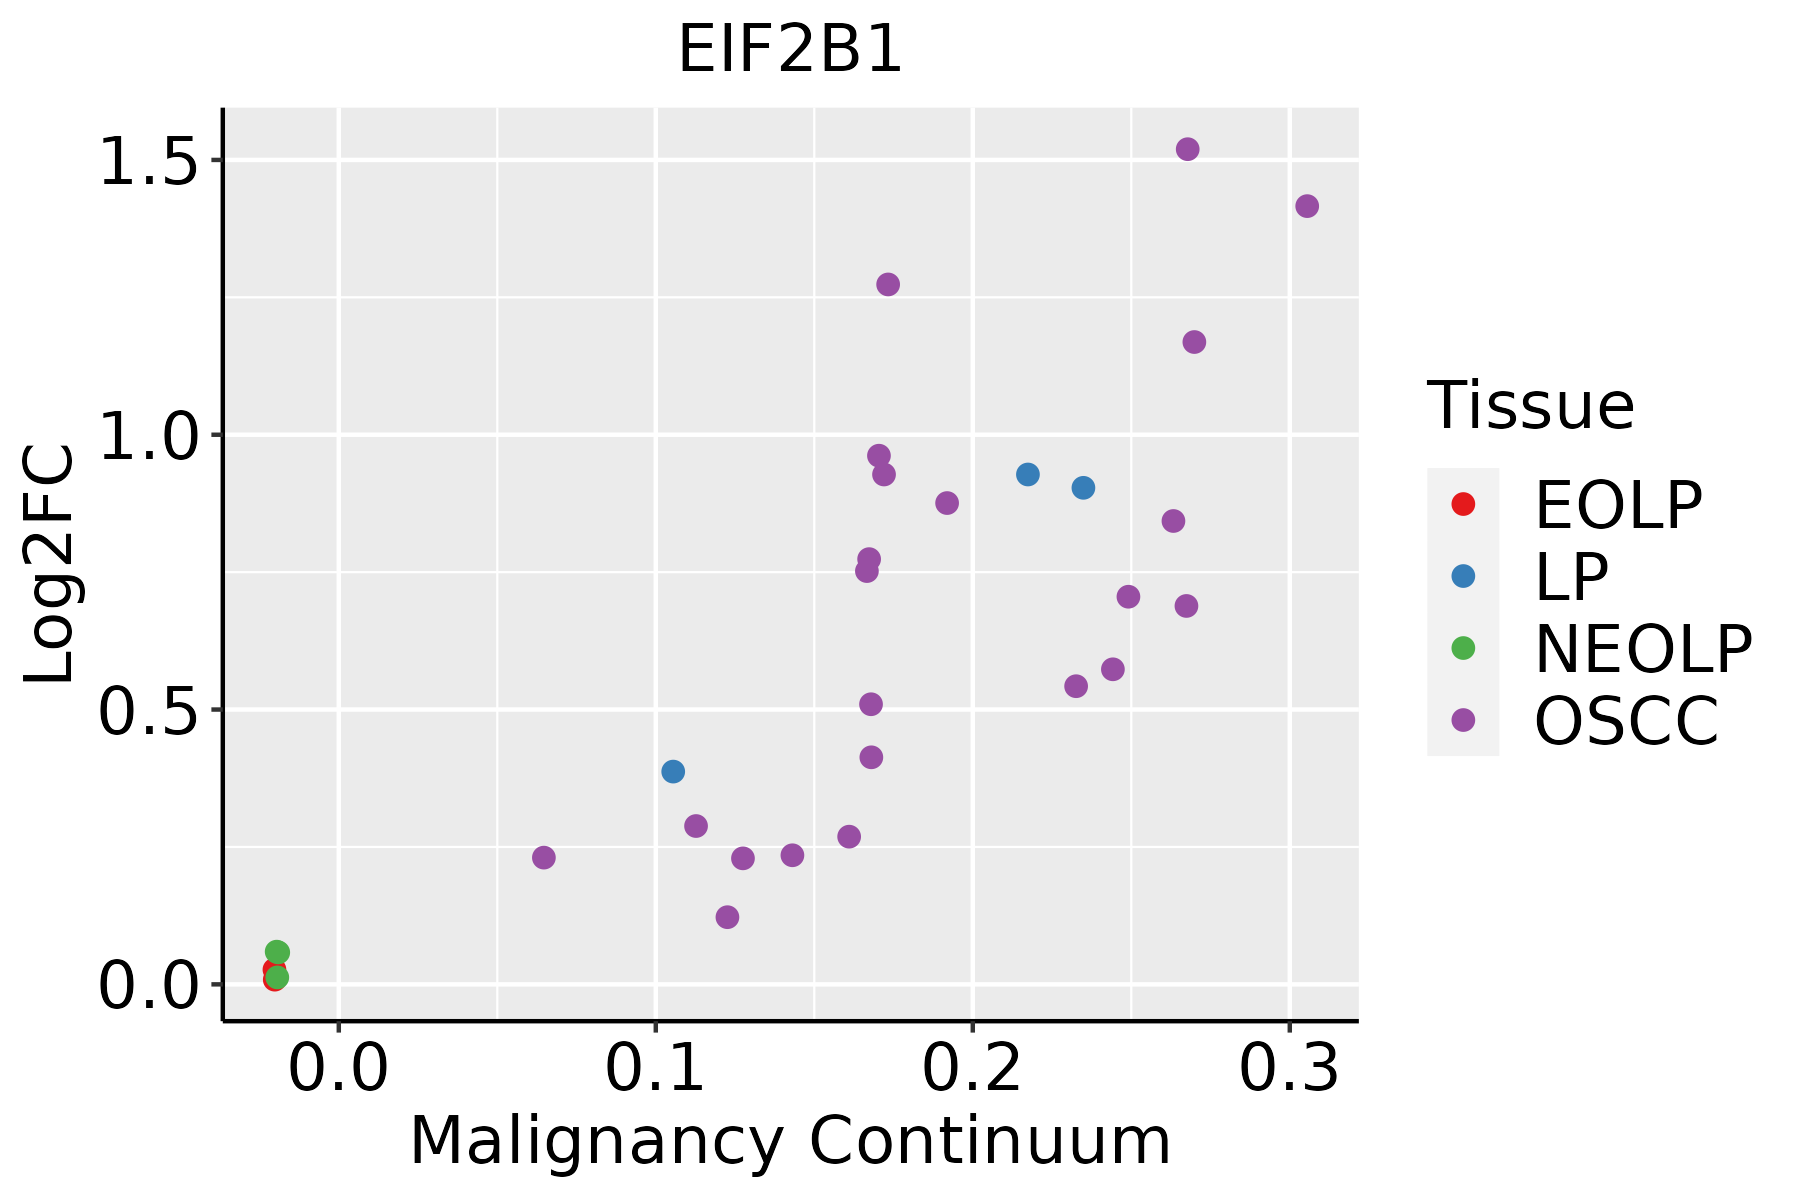 | EOLP: Erosive Oral lichen planus |
| LP: leukoplakia | ||
| NEOLP: Non-erosive oral lichen planus | ||
| OSCC: Oral squamous cell carcinoma | ||
| Skin | 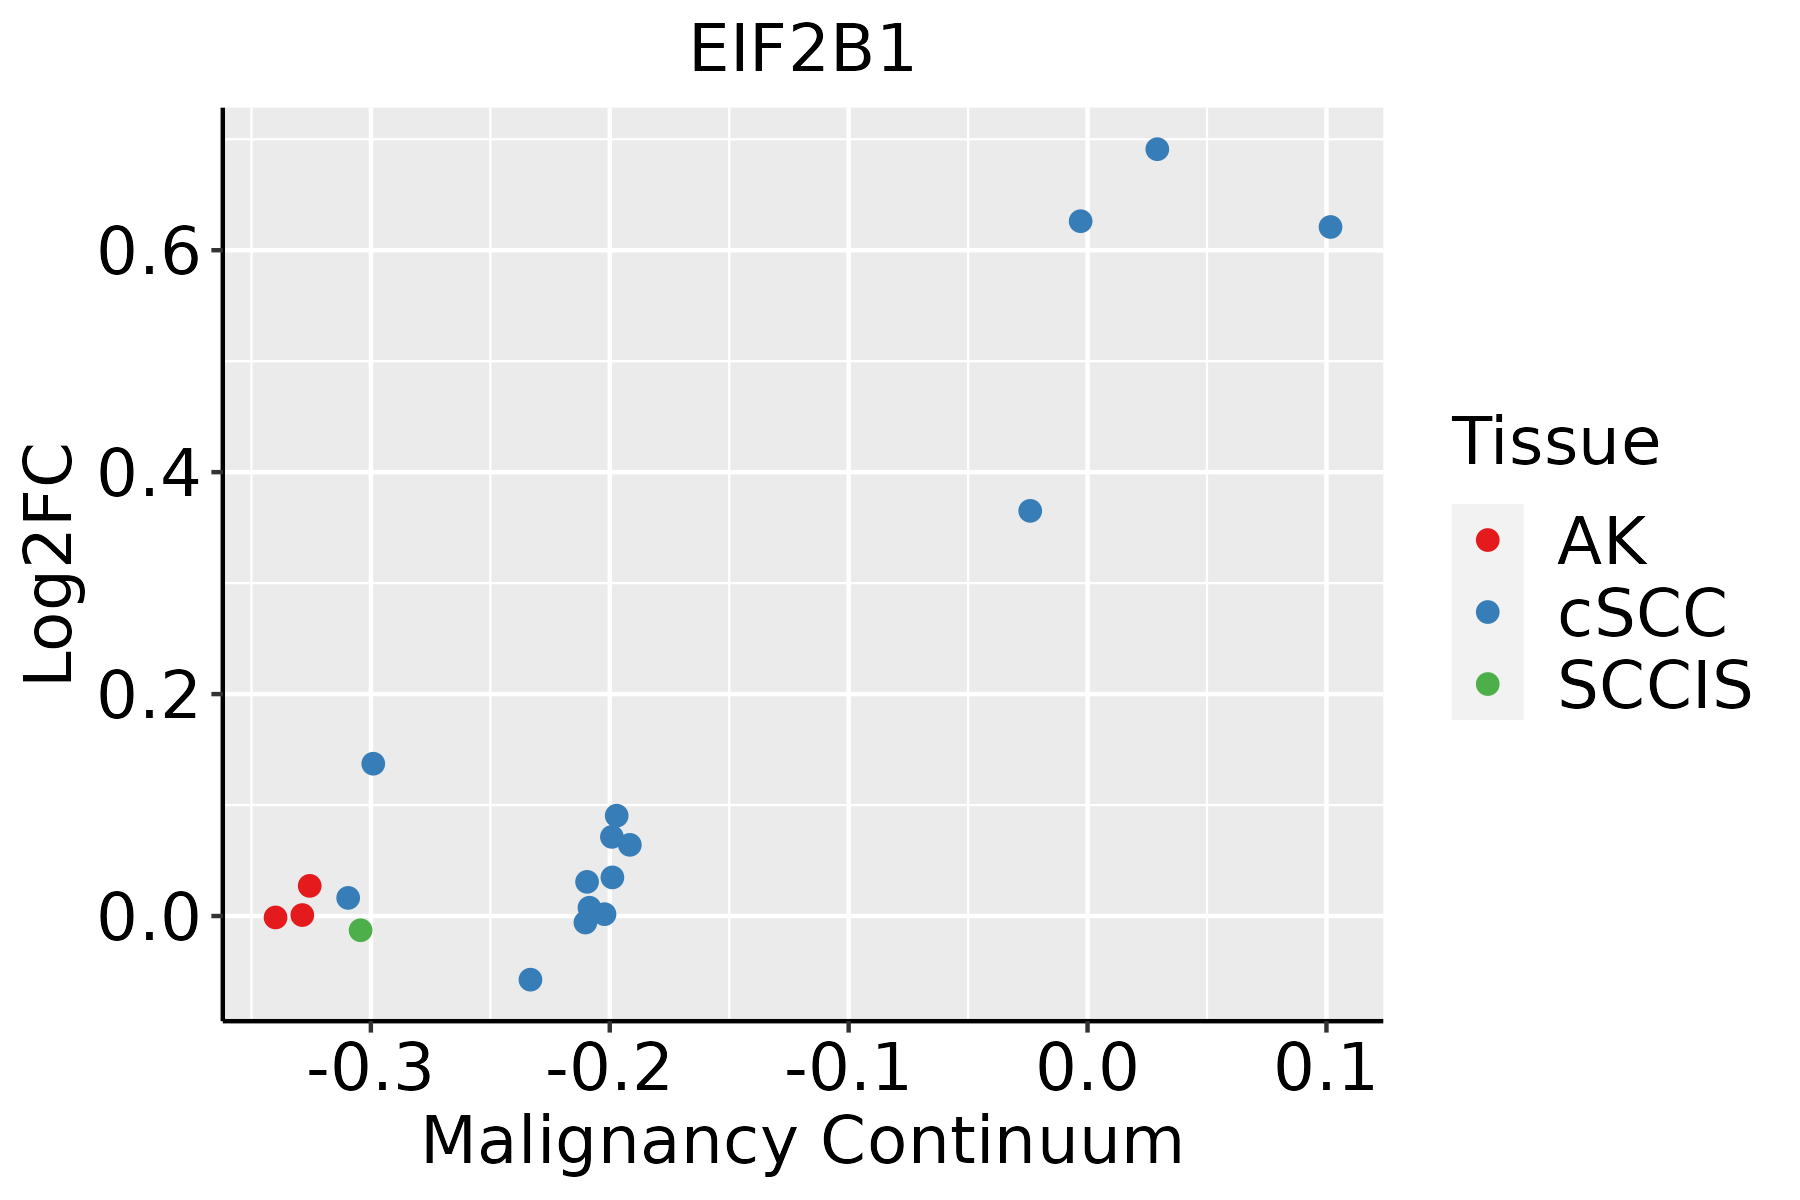 | AK: Actinic keratosis |
| cSCC: Cutaneous squamous cell carcinoma | ||
| SCCIS:squamous cell carcinoma in situ |
| ∗log2FC in expression of this searched gene in stem-like cells from each diseased tissue sample relative to stem-like cells in normal samples in each tissue plotted against the malignancy continuum. Samples are colored based on if they are from different disease stage. |
Top |
Malignant transformation related pathway analysis |
| Find out the enriched GO biological processes and KEGG pathways involved in transition from healthy to precancer to cancer |
| Tissue | Disease Stage | Enriched GO biological Processes |
| Colorectum | AD |  |
| Colorectum | SER |  |
| Colorectum | MSS |  |
| Colorectum | MSI-H |  |
| Colorectum | FAP |  |
| ∗Top 15 enriched GO BP terms are showed in the bar plot of each disease state in each tissue. Each row represents a significant GO biological process which is colored according to the -log10(p.adjust). |
| Page: 1 2 3 4 5 6 7 8 9 |
| GO ID | Tissue | Disease Stage | Description | Gene Ratio | Bg Ratio | pvalue | p.adjust | Count |
| GO:0006413110 | Esophagus | ESCC | translational initiation | 100/8552 | 118/18723 | 1.16e-18 | 1.25e-16 | 100 |
| GO:0009408110 | Esophagus | ESCC | response to heat | 77/8552 | 110/18723 | 2.01e-07 | 3.11e-06 | 77 |
| GO:0043434111 | Esophagus | ESCC | response to peptide hormone | 234/8552 | 414/18723 | 4.93e-06 | 5.21e-05 | 234 |
| GO:00420636 | Esophagus | ESCC | gliogenesis | 172/8552 | 301/18723 | 3.75e-05 | 3.04e-04 | 172 |
| GO:000926619 | Esophagus | ESCC | response to temperature stimulus | 106/8552 | 178/18723 | 1.30e-04 | 8.84e-04 | 106 |
| GO:00100016 | Esophagus | ESCC | glial cell differentiation | 129/8552 | 225/18723 | 2.73e-04 | 1.65e-03 | 129 |
| GO:00508528 | Esophagus | ESCC | T cell receptor signaling pathway | 73/8552 | 123/18723 | 1.54e-03 | 7.24e-03 | 73 |
| GO:0009743111 | Esophagus | ESCC | response to carbohydrate | 135/8552 | 253/18723 | 8.16e-03 | 2.89e-02 | 135 |
| GO:00487092 | Esophagus | ESCC | oligodendrocyte differentiation | 55/8552 | 95/18723 | 1.10e-02 | 3.72e-02 | 55 |
| GO:000641312 | Liver | Cirrhotic | translational initiation | 76/4634 | 118/18723 | 8.36e-20 | 2.18e-17 | 76 |
| GO:000974312 | Liver | Cirrhotic | response to carbohydrate | 101/4634 | 253/18723 | 6.24e-08 | 1.92e-06 | 101 |
| GO:004343412 | Liver | Cirrhotic | response to peptide hormone | 149/4634 | 414/18723 | 1.70e-07 | 4.49e-06 | 149 |
| GO:003428412 | Liver | Cirrhotic | response to monosaccharide | 90/4634 | 225/18723 | 2.87e-07 | 7.01e-06 | 90 |
| GO:000974612 | Liver | Cirrhotic | response to hexose | 86/4634 | 219/18723 | 1.30e-06 | 2.59e-05 | 86 |
| GO:00094087 | Liver | Cirrhotic | response to heat | 49/4634 | 110/18723 | 4.47e-06 | 7.42e-05 | 49 |
| GO:00097497 | Liver | Cirrhotic | response to glucose | 82/4634 | 212/18723 | 4.54e-06 | 7.51e-05 | 82 |
| GO:00092666 | Liver | Cirrhotic | response to temperature stimulus | 63/4634 | 178/18723 | 9.38e-04 | 6.66e-03 | 63 |
| GO:0042063 | Liver | Cirrhotic | gliogenesis | 98/4634 | 301/18723 | 1.28e-03 | 8.60e-03 | 98 |
| GO:0010001 | Liver | Cirrhotic | glial cell differentiation | 75/4634 | 225/18723 | 2.24e-03 | 1.36e-02 | 75 |
| GO:0048709 | Liver | Cirrhotic | oligodendrocyte differentiation | 34/4634 | 95/18723 | 1.06e-02 | 4.66e-02 | 34 |
| Page: 1 2 3 |
| Pathway ID | Tissue | Disease Stage | Description | Gene Ratio | Bg Ratio | pvalue | p.adjust | qvalue | Count |
| Page: 1 |
Top |
Cell-cell communication analysis |
| Identification of potential cell-cell interactions between two cell types and their ligand-receptor pairs for different disease states |
| Ligand | Receptor | LRpair | Pathway | Tissue | Disease Stage |
| Page: 1 |
Top |
Single-cell gene regulatory network inference analysis |
| Find out the significant the regulons (TFs) and the target genes of each regulon across cell types for different disease states |
| TF | Cell Type | Tissue | Disease Stage | Target Gene | RSS | Regulon Activity |
| ∗The dot plots of a searched regulon are shown for all cell subpopulations in each disease state of each tissue based on the regulon specific score inferred using pySCENIC and by calculating the average expression. |
| Page: 1 |
Top |
Somatic mutation of malignant transformation related genes |
| Annotation of somatic variants for genes involved in malignant transformation |
| Hugo Symbol | Variant Class | Variant Classification | dbSNP RS | HGVSc | HGVSp | HGVSp Short | SWISSPROT | BIOTYPE | SIFT | PolyPhen | Tumor Sample Barcode | Tissue | Histology | Sex | Age | Stage | Therapy Types | Drugs | Outcome |
| EIF2B1 | SNV | Missense_Mutation | c.307N>G | p.Arg103Gly | p.R103G | Q14232 | protein_coding | deleterious(0) | benign(0.294) | TCGA-A1-A0SO-01 | Breast | breast invasive carcinoma | Female | >=65 | I/II | Chemotherapy | SD | ||
| EIF2B1 | SNV | Missense_Mutation | novel | c.431C>G | p.Ala144Gly | p.A144G | Q14232 | protein_coding | tolerated(0.35) | benign(0.027) | TCGA-C8-A3M8-01 | Breast | breast invasive carcinoma | Female | >=65 | I/II | Hormone Therapy | tamoxiphen | CR |
| EIF2B1 | SNV | Missense_Mutation | rs767097089 | c.532N>C | p.Val178Leu | p.V178L | Q14232 | protein_coding | deleterious(0.03) | benign(0.017) | TCGA-E2-A1IU-01 | Breast | breast invasive carcinoma | Female | <65 | I/II | Hormone Therapy | arimidex | SD |
| EIF2B1 | insertion | Nonsense_Mutation | novel | c.247_248insTAACTTCATTTTAGATGCTATTACAGAGATGTAAAGC | p.Tyr83LeufsTer5 | p.Y83Lfs*5 | Q14232 | protein_coding | TCGA-A8-A08H-01 | Breast | breast invasive carcinoma | Female | >=65 | I/II | Unknown | Unknown | SD | ||
| EIF2B1 | SNV | Missense_Mutation | novel | c.685G>A | p.Val229Ile | p.V229I | Q14232 | protein_coding | tolerated(0.13) | benign(0.03) | TCGA-DG-A2KJ-01 | Cervix | cervical & endocervical cancer | Female | <65 | III/IV | Chemotherapy | cisplatin | SD |
| EIF2B1 | SNV | Missense_Mutation | novel | c.102N>C | p.Leu34Phe | p.L34F | Q14232 | protein_coding | deleterious(0.01) | benign(0.347) | TCGA-ZJ-AAXU-01 | Cervix | cervical & endocervical cancer | Female | <65 | I/II | Unknown | Unknown | SD |
| EIF2B1 | SNV | Missense_Mutation | c.251N>T | p.Ser84Phe | p.S84F | Q14232 | protein_coding | deleterious(0.05) | possibly_damaging(0.81) | TCGA-AA-A01I-01 | Colorectum | colon adenocarcinoma | Male | >=65 | I/II | Unknown | Unknown | SD | |
| EIF2B1 | SNV | Missense_Mutation | c.832N>G | p.Pro278Ala | p.P278A | Q14232 | protein_coding | deleterious(0.03) | possibly_damaging(0.658) | TCGA-AG-3901-01 | Colorectum | rectum adenocarcinoma | Female | >=65 | III/IV | Unknown | Unknown | SD | |
| EIF2B1 | SNV | Missense_Mutation | novel | c.647N>A | p.Ala216Asp | p.A216D | Q14232 | protein_coding | deleterious(0) | probably_damaging(0.995) | TCGA-EI-6507-01 | Colorectum | rectum adenocarcinoma | Male | <65 | I/II | Unknown | Unknown | SD |
| EIF2B1 | SNV | Missense_Mutation | rs553936477 | c.713T>C | p.Leu238Pro | p.L238P | Q14232 | protein_coding | deleterious(0.03) | probably_damaging(0.984) | TCGA-EI-6917-01 | Colorectum | rectum adenocarcinoma | Male | <65 | III/IV | Chemotherapy | 5fluorouracil+oxaciplatina+l-folinian | SD |
| Page: 1 2 3 4 |
Top |
Related drugs of malignant transformation related genes |
| Identification of chemicals and drugs interact with genes involved in malignant transfromation |
| (DGIdb 4.0) |
| Entrez ID | Symbol | Category | Interaction Types | Drug Claim Name | Drug Name | PMIDs |
| 1967 | EIF2B1 | NA | WORTMANNIN | WORTMANNIN | 10764740 | |
| 1967 | EIF2B1 | NA | HORMONES | 7893823 |
| Page: 1 |

Copyright 2023-Present -The University of Texas Health Science Center at Houston |