
|
|||||
|
 | |
| |
| |
| |
| |
| |
|
Gene: EIF2AK2 |
Gene summary for EIF2AK2 |
| Gene information | Species | Human | Gene symbol | EIF2AK2 | Gene ID | 5610 |
| Gene name | eukaryotic translation initiation factor 2 alpha kinase 2 | |
| Gene Alias | EIF2AK1 | |
| Cytomap | 2p22.2 | |
| Gene Type | protein-coding | GO ID | GO:0000165 | UniProtAcc | P19525 |
Top |
Malignant transformation analysis |
| Identification of the aberrant gene expression in precancerous and cancerous lesions by comparing the gene expression of stem-like cells in diseased tissues with normal stem cells |
| Entrez ID | Symbol | Replicates | Species | Organ | Tissue | Adj P-value | Log2FC | Malignancy |
| 5610 | EIF2AK2 | LZE4T | Human | Esophagus | ESCC | 1.41e-23 | 7.22e-01 | 0.0811 |
| 5610 | EIF2AK2 | LZE5T | Human | Esophagus | ESCC | 3.58e-03 | 5.63e-01 | 0.0514 |
| 5610 | EIF2AK2 | LZE7T | Human | Esophagus | ESCC | 9.80e-12 | 7.57e-01 | 0.0667 |
| 5610 | EIF2AK2 | LZE8T | Human | Esophagus | ESCC | 3.74e-07 | 2.48e-01 | 0.067 |
| 5610 | EIF2AK2 | LZE20T | Human | Esophagus | ESCC | 2.61e-07 | 3.20e-01 | 0.0662 |
| 5610 | EIF2AK2 | LZE22T | Human | Esophagus | ESCC | 1.05e-06 | 7.09e-01 | 0.068 |
| 5610 | EIF2AK2 | LZE24T | Human | Esophagus | ESCC | 2.43e-39 | 1.23e+00 | 0.0596 |
| 5610 | EIF2AK2 | LZE21T | Human | Esophagus | ESCC | 2.00e-04 | 5.15e-01 | 0.0655 |
| 5610 | EIF2AK2 | LZE6T | Human | Esophagus | ESCC | 8.11e-10 | 5.14e-01 | 0.0845 |
| 5610 | EIF2AK2 | P1T-E | Human | Esophagus | ESCC | 1.60e-16 | 1.05e+00 | 0.0875 |
| 5610 | EIF2AK2 | P2T-E | Human | Esophagus | ESCC | 3.81e-119 | 2.44e+00 | 0.1177 |
| 5610 | EIF2AK2 | P4T-E | Human | Esophagus | ESCC | 7.48e-32 | 9.30e-01 | 0.1323 |
| 5610 | EIF2AK2 | P5T-E | Human | Esophagus | ESCC | 1.77e-54 | 1.00e+00 | 0.1327 |
| 5610 | EIF2AK2 | P8T-E | Human | Esophagus | ESCC | 1.38e-37 | 7.66e-01 | 0.0889 |
| 5610 | EIF2AK2 | P9T-E | Human | Esophagus | ESCC | 2.60e-39 | 1.01e+00 | 0.1131 |
| 5610 | EIF2AK2 | P10T-E | Human | Esophagus | ESCC | 2.40e-35 | 6.48e-01 | 0.116 |
| 5610 | EIF2AK2 | P11T-E | Human | Esophagus | ESCC | 5.36e-46 | 1.62e+00 | 0.1426 |
| 5610 | EIF2AK2 | P12T-E | Human | Esophagus | ESCC | 5.03e-35 | 8.01e-01 | 0.1122 |
| 5610 | EIF2AK2 | P15T-E | Human | Esophagus | ESCC | 1.20e-47 | 1.08e+00 | 0.1149 |
| 5610 | EIF2AK2 | P16T-E | Human | Esophagus | ESCC | 1.17e-46 | 8.68e-01 | 0.1153 |
| Page: 1 2 3 4 5 6 |
| Tissue | Expression Dynamics | Abbreviation |
| Esophagus | 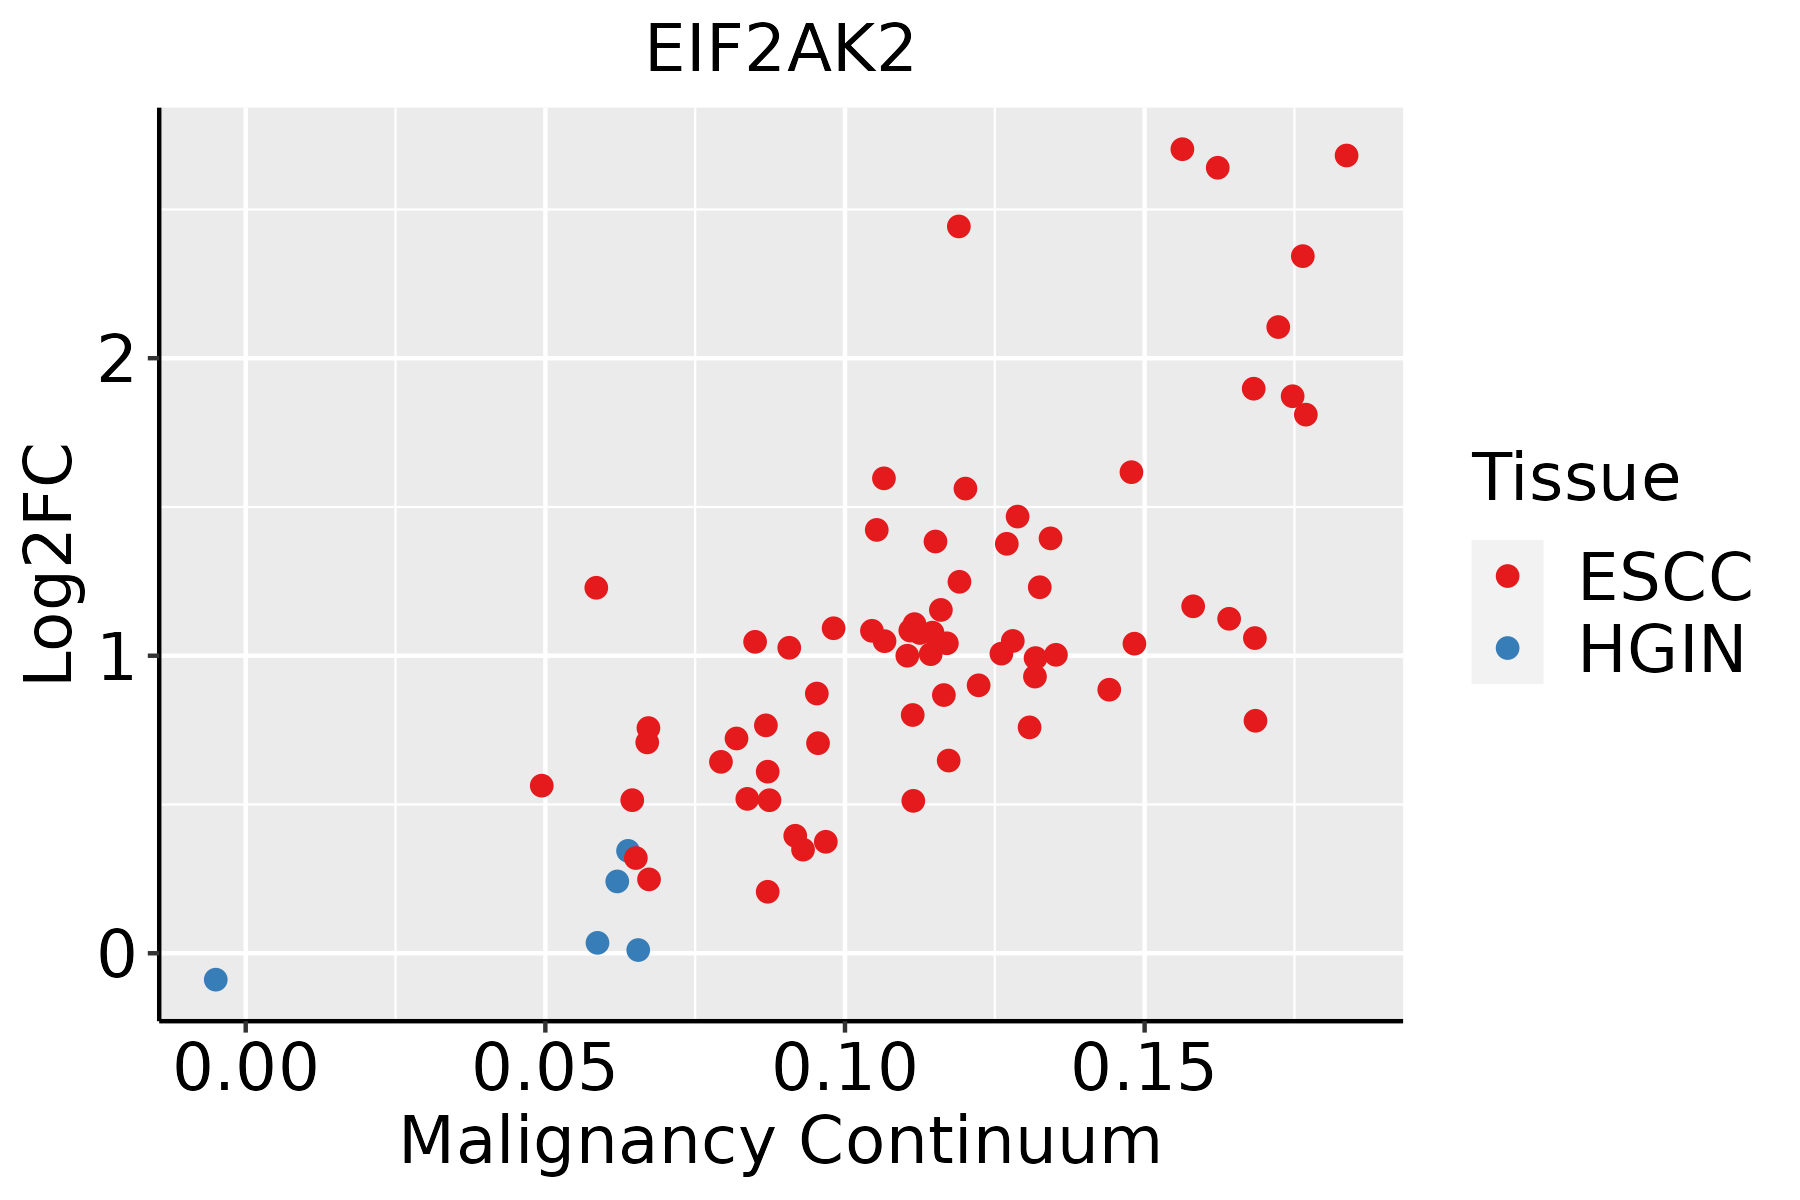 | ESCC: Esophageal squamous cell carcinoma |
| HGIN: High-grade intraepithelial neoplasias | ||
| LGIN: Low-grade intraepithelial neoplasias | ||
| Liver | 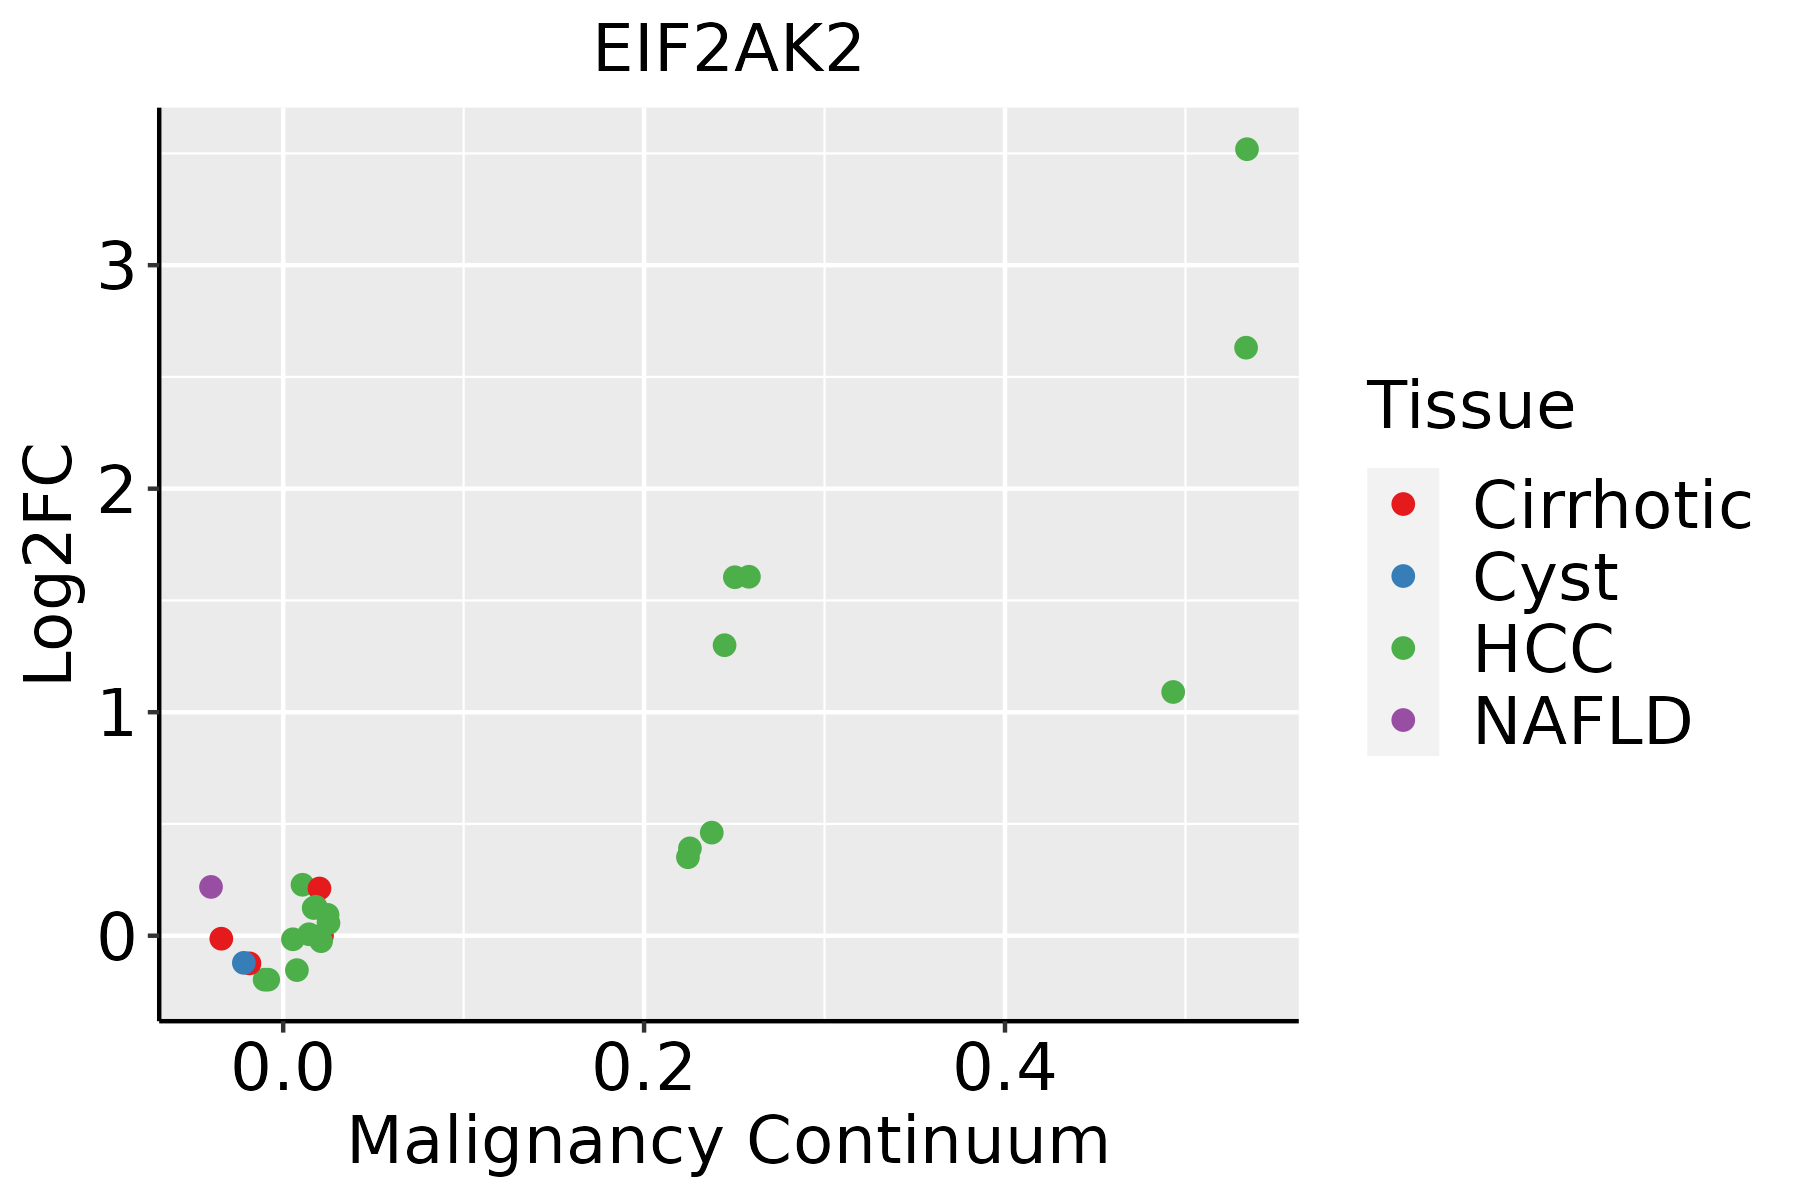 | HCC: Hepatocellular carcinoma |
| NAFLD: Non-alcoholic fatty liver disease | ||
| Oral Cavity | 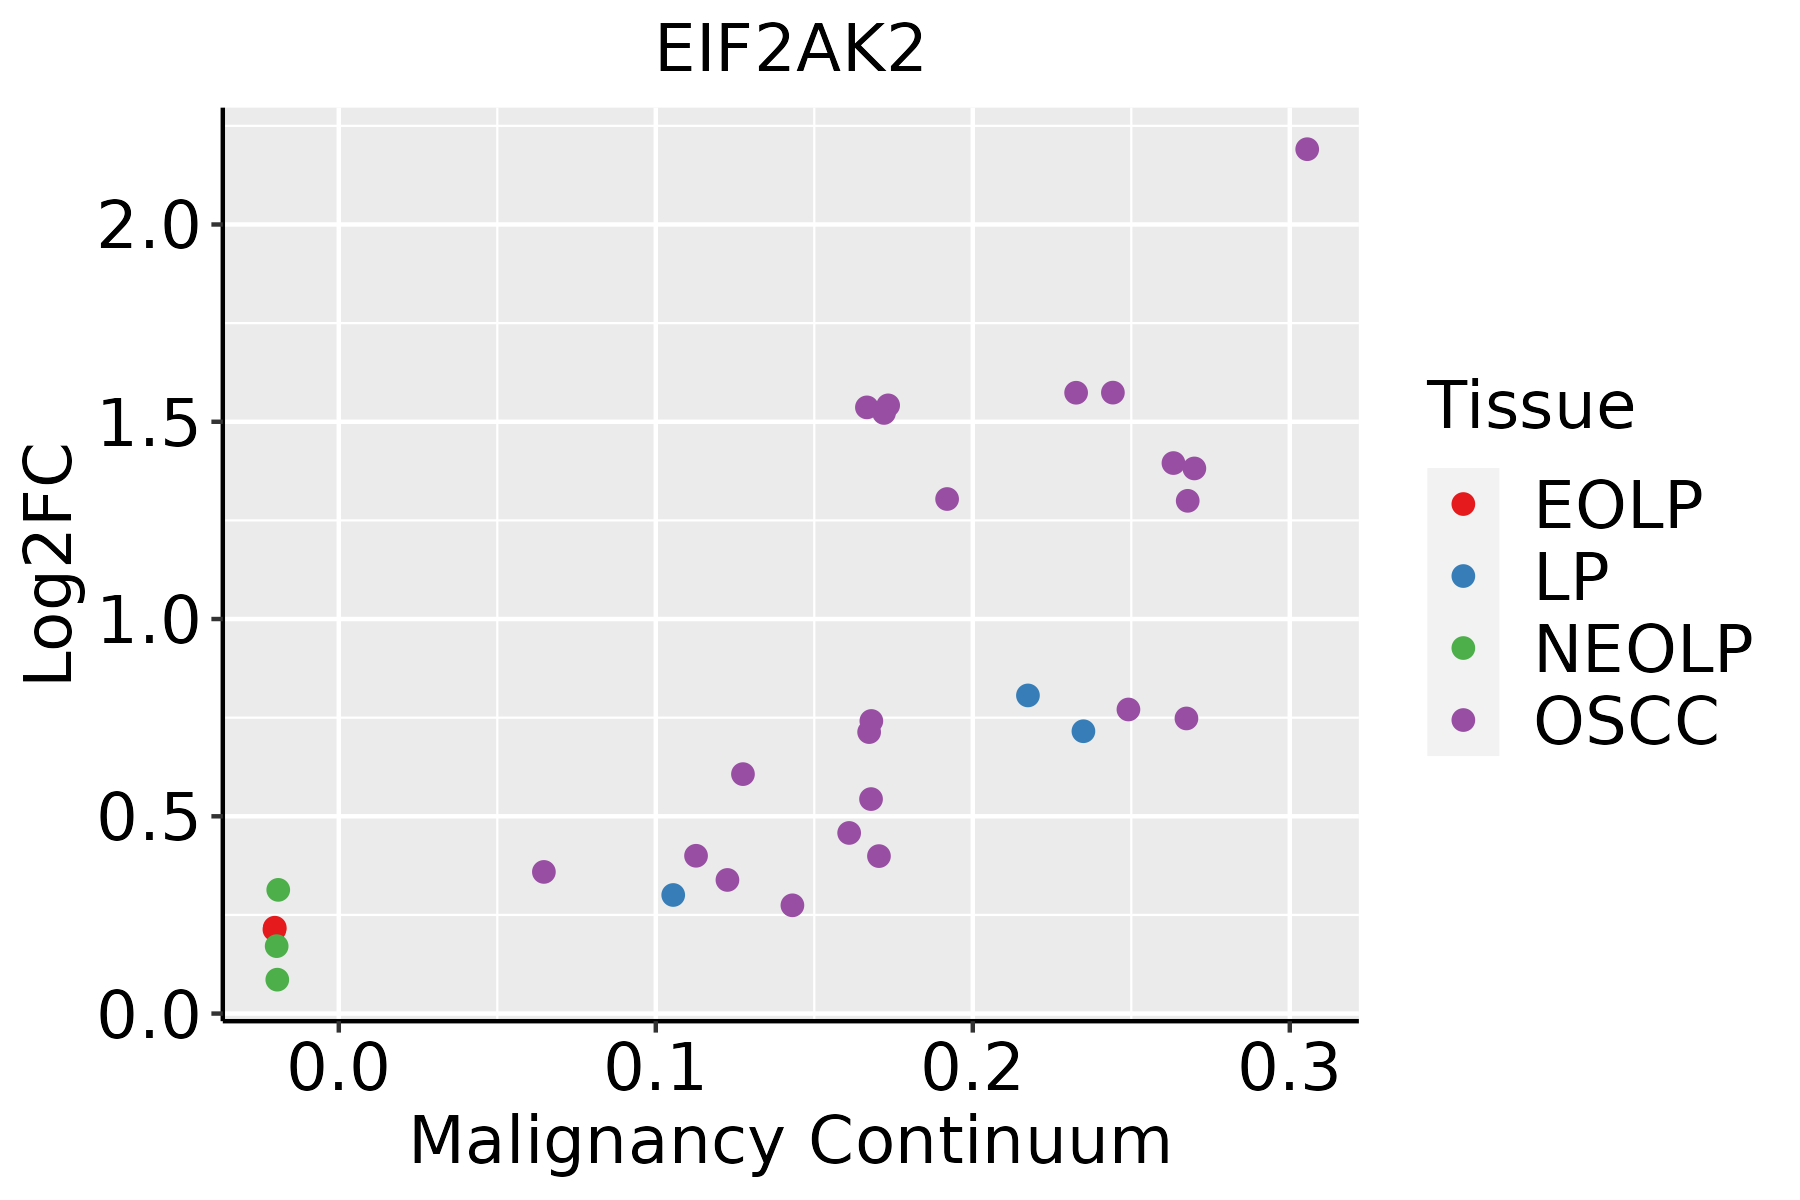 | EOLP: Erosive Oral lichen planus |
| LP: leukoplakia | ||
| NEOLP: Non-erosive oral lichen planus | ||
| OSCC: Oral squamous cell carcinoma | ||
| Prostate | 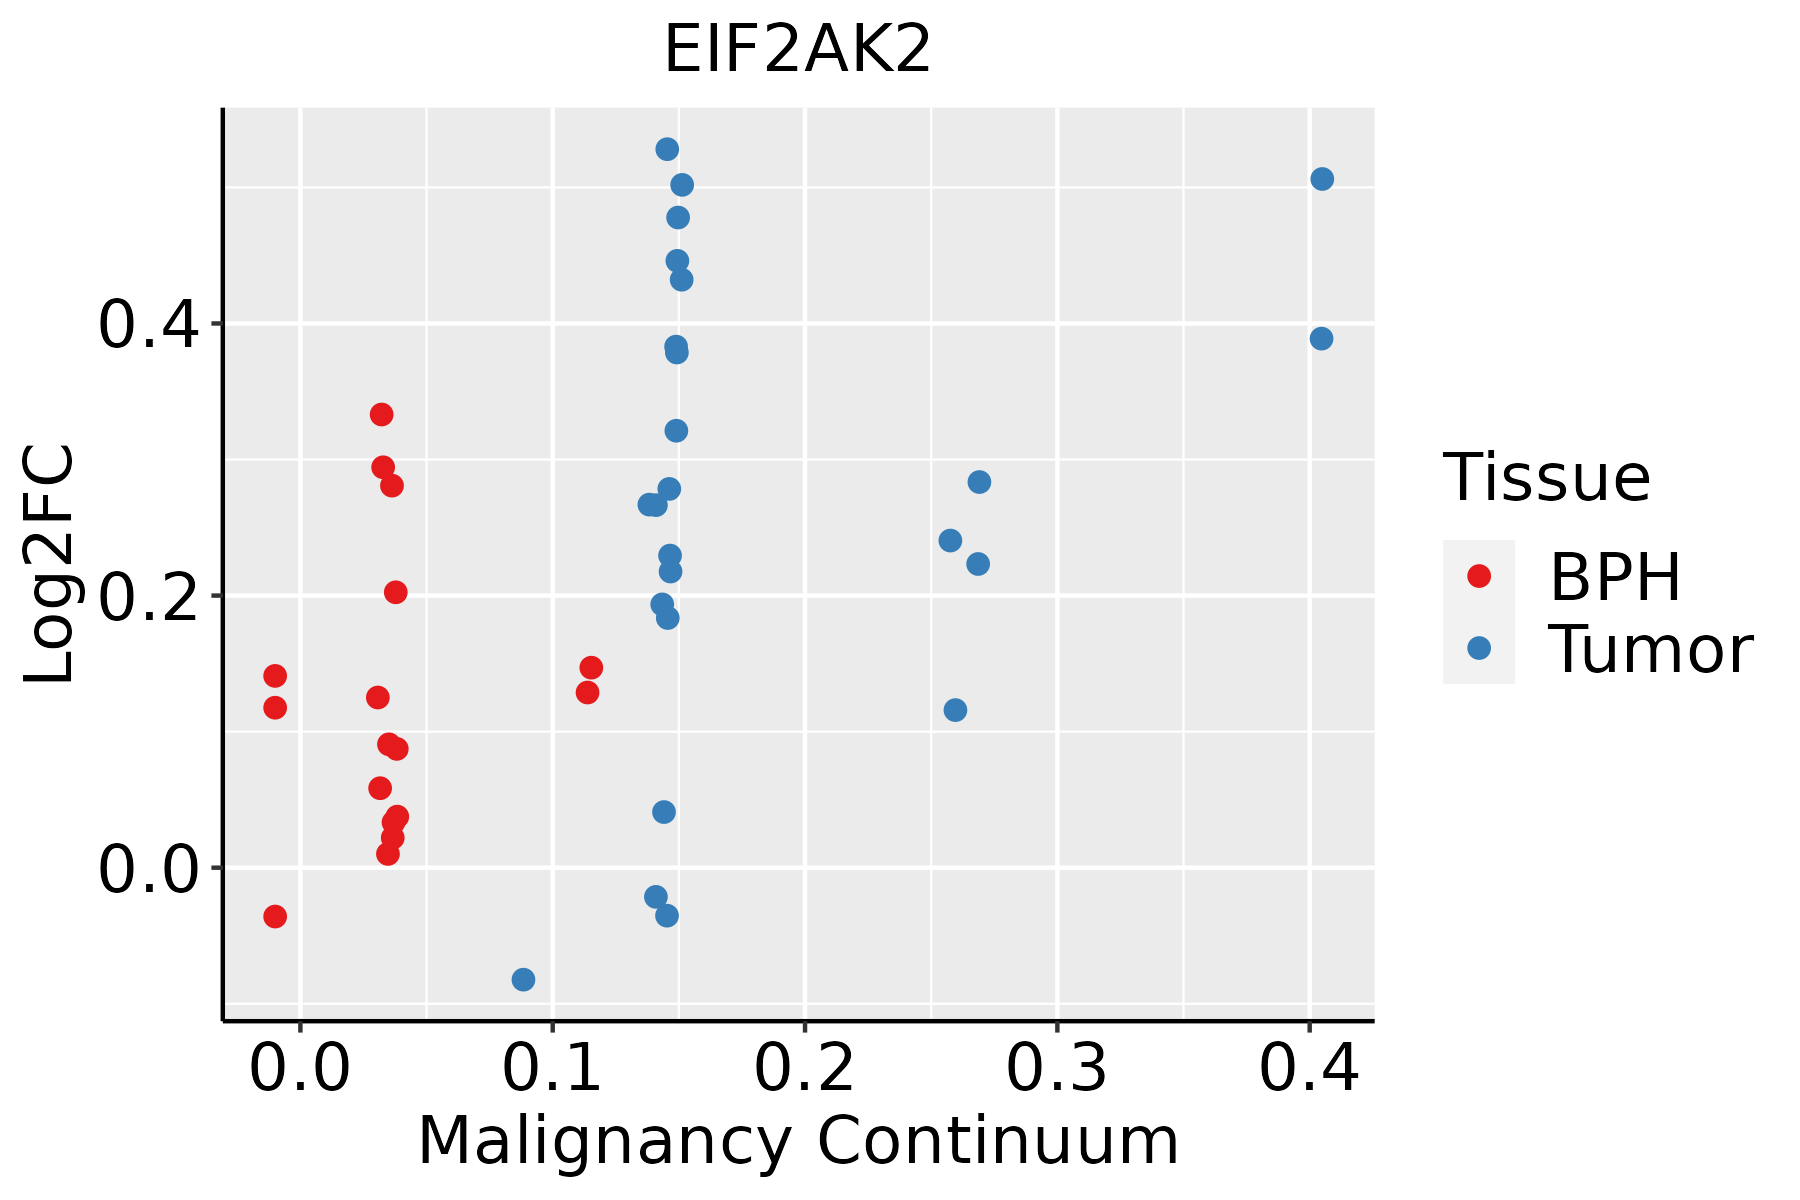 | BPH: Benign Prostatic Hyperplasia |
| Skin | 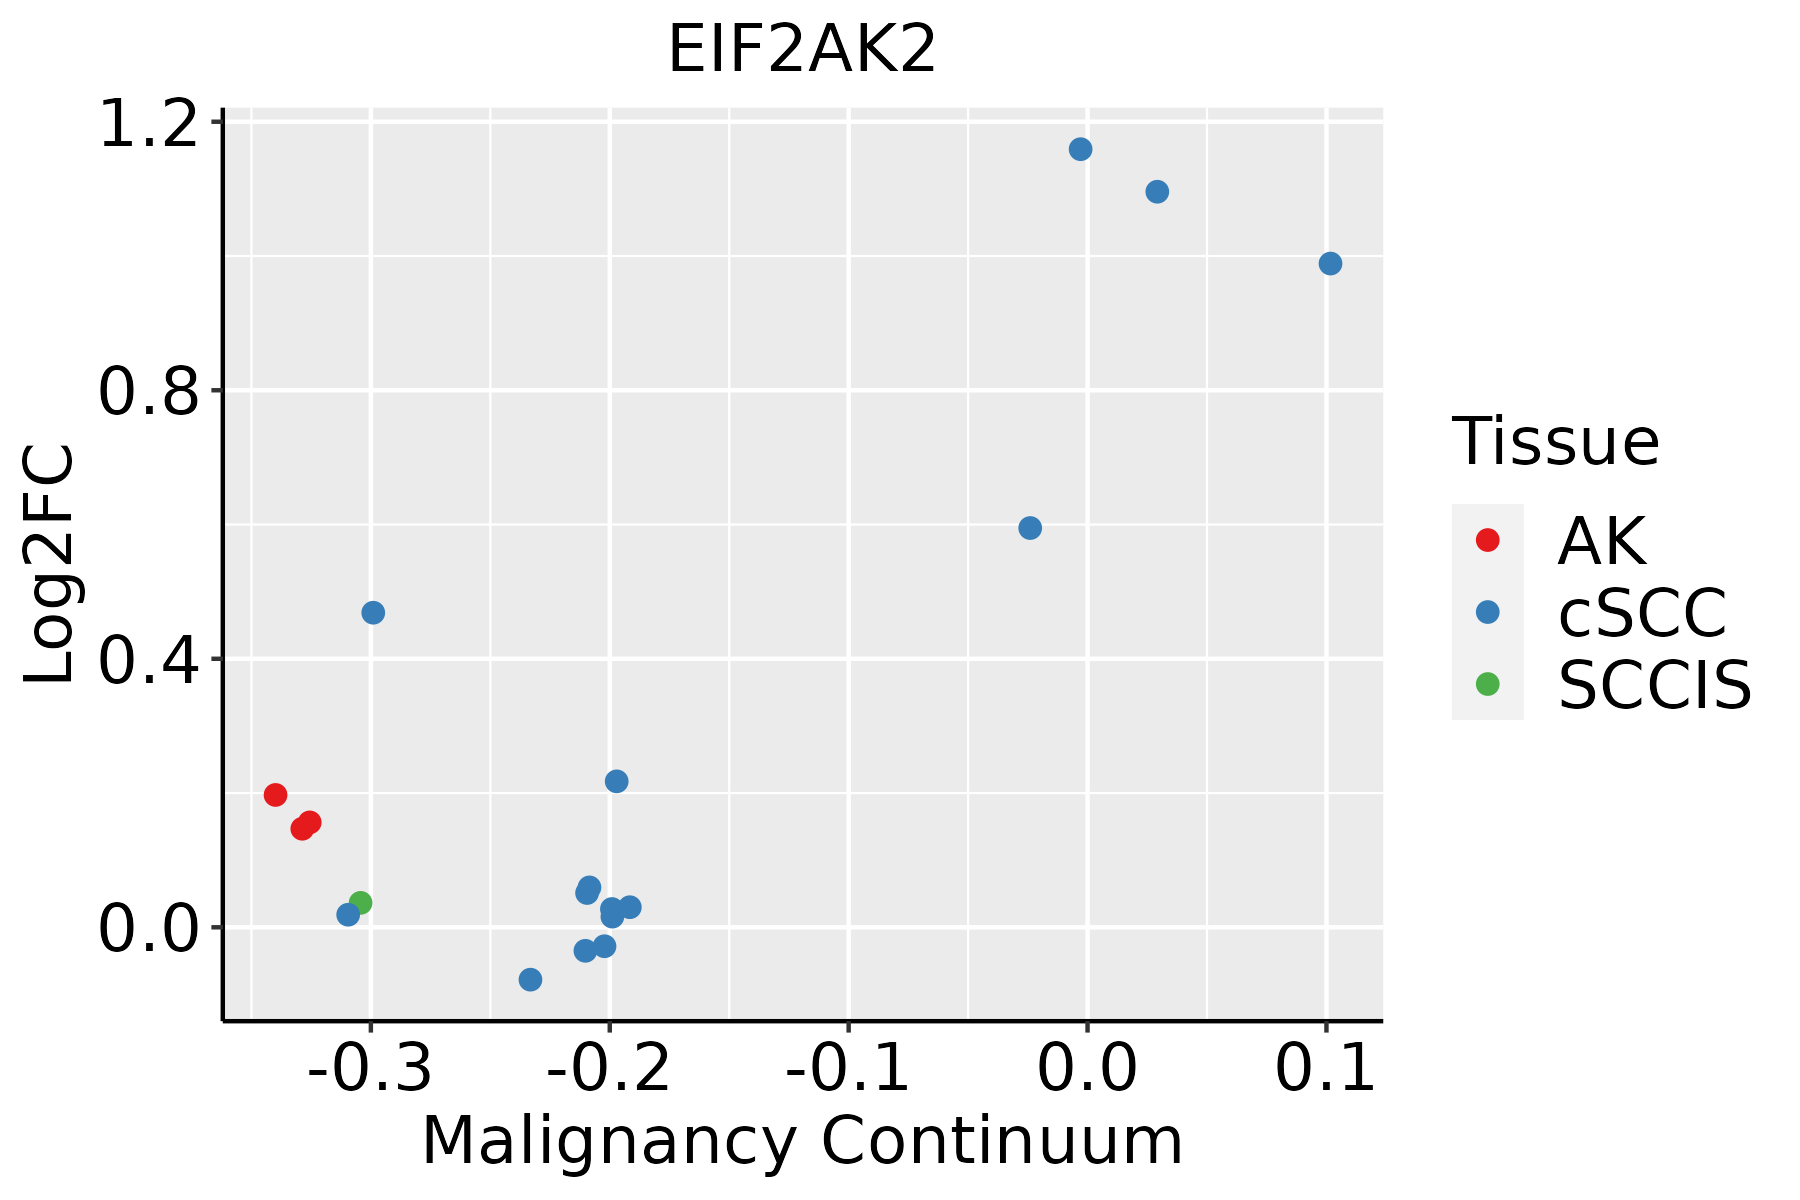 | AK: Actinic keratosis |
| cSCC: Cutaneous squamous cell carcinoma | ||
| SCCIS:squamous cell carcinoma in situ | ||
| Thyroid | 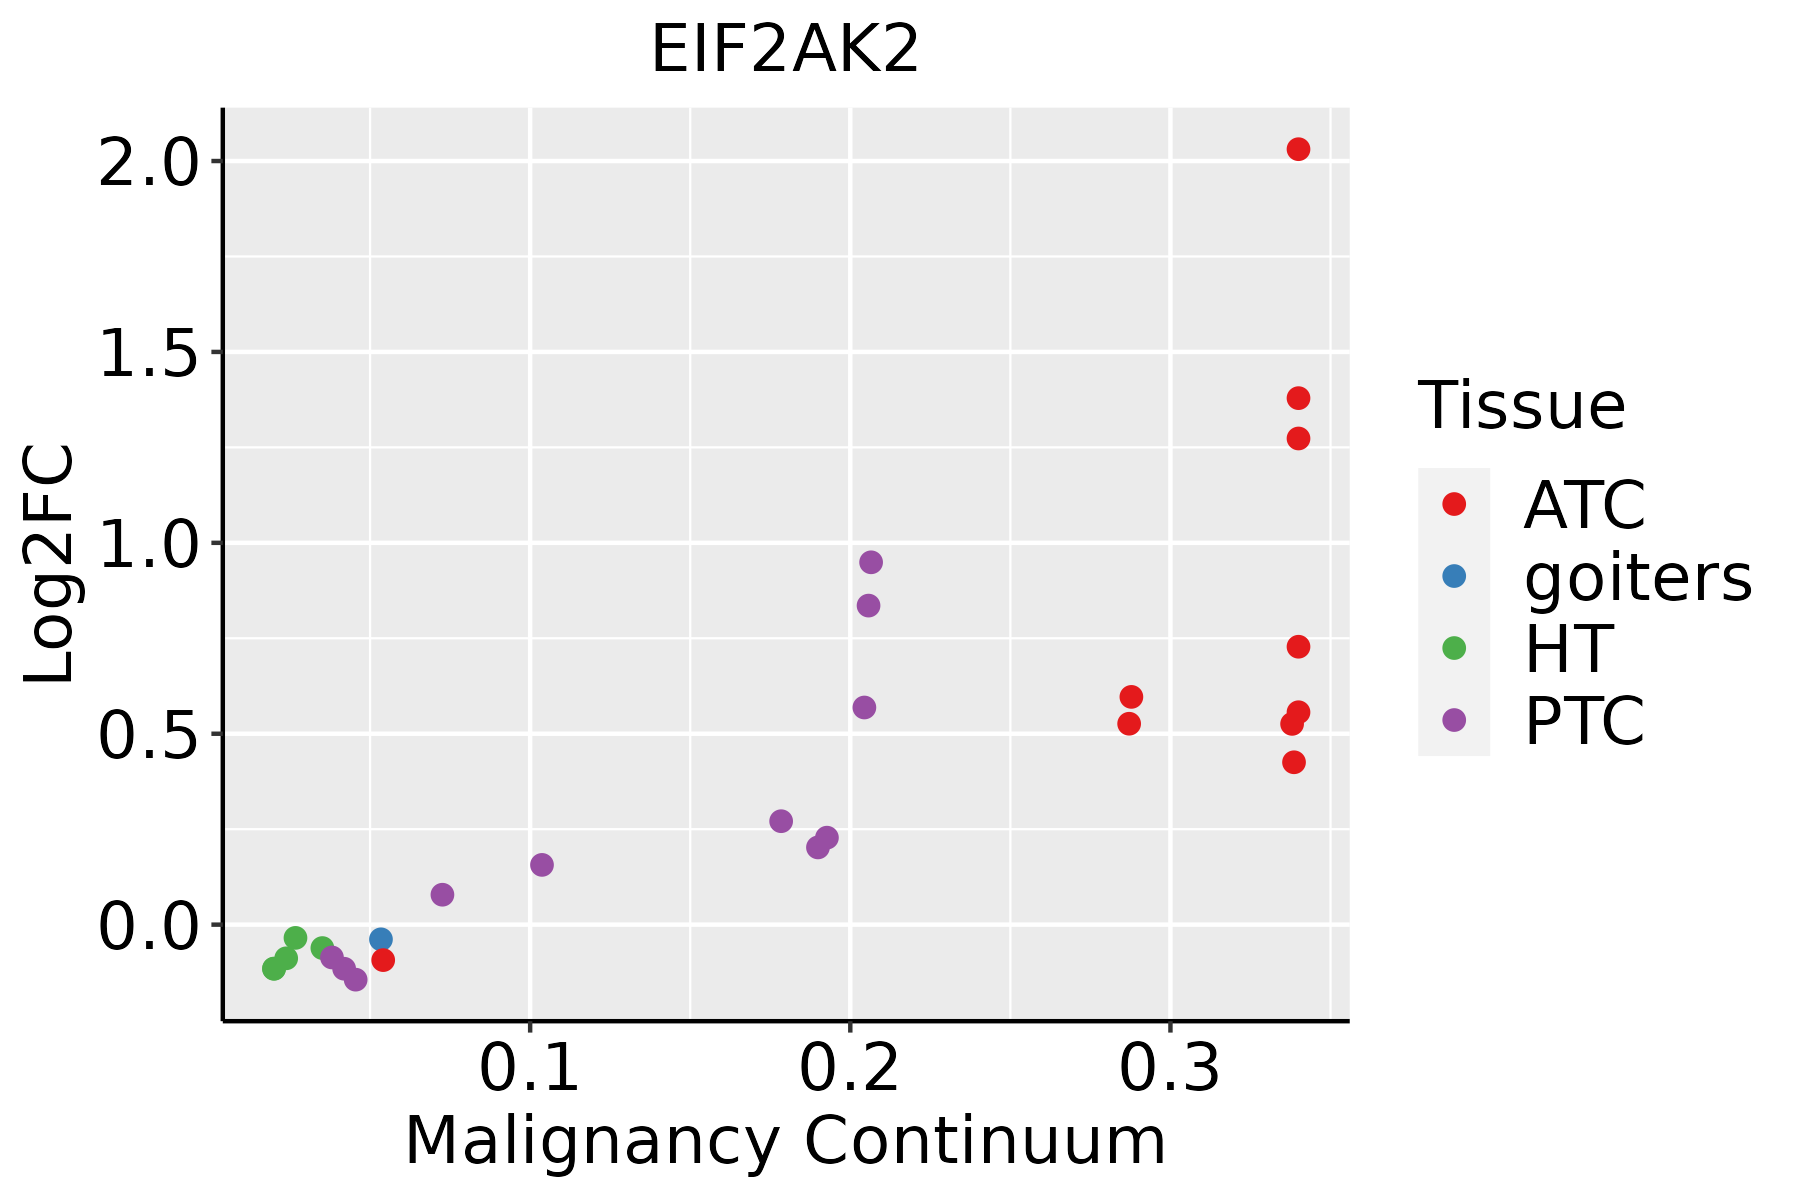 | ATC: Anaplastic thyroid cancer |
| HT: Hashimoto's thyroiditis | ||
| PTC: Papillary thyroid cancer |
| ∗log2FC in expression of this searched gene in stem-like cells from each diseased tissue sample relative to stem-like cells in normal samples in each tissue plotted against the malignancy continuum. Samples are colored based on if they are from different disease stage. |
Top |
Malignant transformation related pathway analysis |
| Find out the enriched GO biological processes and KEGG pathways involved in transition from healthy to precancer to cancer |
| Tissue | Disease Stage | Enriched GO biological Processes |
| Colorectum | AD |  |
| Colorectum | SER |  |
| Colorectum | MSS |  |
| Colorectum | MSI-H |  |
| Colorectum | FAP |  |
| ∗Top 15 enriched GO BP terms are showed in the bar plot of each disease state in each tissue. Each row represents a significant GO biological process which is colored according to the -log10(p.adjust). |
| Page: 1 2 3 4 5 6 7 8 9 |
| GO ID | Tissue | Disease Stage | Description | Gene Ratio | Bg Ratio | pvalue | p.adjust | Count |
| GO:0016032111 | Esophagus | ESCC | viral process | 301/8552 | 415/18723 | 3.34e-29 | 1.32e-26 | 301 |
| GO:0034976111 | Esophagus | ESCC | response to endoplasmic reticulum stress | 192/8552 | 256/18723 | 7.15e-22 | 1.30e-19 | 192 |
| GO:0019058111 | Esophagus | ESCC | viral life cycle | 226/8552 | 317/18723 | 1.17e-20 | 1.76e-18 | 226 |
| GO:0006413110 | Esophagus | ESCC | translational initiation | 100/8552 | 118/18723 | 1.16e-18 | 1.25e-16 | 100 |
| GO:0035966111 | Esophagus | ESCC | response to topologically incorrect protein | 125/8552 | 159/18723 | 1.44e-17 | 1.27e-15 | 125 |
| GO:0006417111 | Esophagus | ESCC | regulation of translation | 304/8552 | 468/18723 | 1.53e-17 | 1.33e-15 | 304 |
| GO:0043254111 | Esophagus | ESCC | regulation of protein-containing complex assembly | 278/8552 | 428/18723 | 3.81e-16 | 2.77e-14 | 278 |
| GO:0071496111 | Esophagus | ESCC | cellular response to external stimulus | 215/8552 | 320/18723 | 4.29e-15 | 2.43e-13 | 215 |
| GO:0006986111 | Esophagus | ESCC | response to unfolded protein | 107/8552 | 137/18723 | 7.01e-15 | 3.87e-13 | 107 |
| GO:0019079111 | Esophagus | ESCC | viral genome replication | 102/8552 | 131/18723 | 4.31e-14 | 2.19e-12 | 102 |
| GO:000961518 | Esophagus | ESCC | response to virus | 238/8552 | 367/18723 | 6.65e-14 | 3.32e-12 | 238 |
| GO:0031668111 | Esophagus | ESCC | cellular response to extracellular stimulus | 168/8552 | 246/18723 | 4.93e-13 | 2.23e-11 | 168 |
| GO:0035967111 | Esophagus | ESCC | cellular response to topologically incorrect protein | 90/8552 | 116/18723 | 1.94e-12 | 8.11e-11 | 90 |
| GO:0050792111 | Esophagus | ESCC | regulation of viral process | 119/8552 | 164/18723 | 2.19e-12 | 9.03e-11 | 119 |
| GO:0031669110 | Esophagus | ESCC | cellular response to nutrient levels | 148/8552 | 215/18723 | 4.58e-12 | 1.76e-10 | 148 |
| GO:0031667111 | Esophagus | ESCC | response to nutrient levels | 289/8552 | 474/18723 | 9.25e-12 | 3.47e-10 | 289 |
| GO:000644617 | Esophagus | ESCC | regulation of translational initiation | 65/8552 | 79/18723 | 2.04e-11 | 7.07e-10 | 65 |
| GO:1903900111 | Esophagus | ESCC | regulation of viral life cycle | 106/8552 | 148/18723 | 1.26e-10 | 3.72e-09 | 106 |
| GO:0009267110 | Esophagus | ESCC | cellular response to starvation | 110/8552 | 156/18723 | 2.63e-10 | 7.37e-09 | 110 |
| GO:0034620111 | Esophagus | ESCC | cellular response to unfolded protein | 74/8552 | 96/18723 | 3.10e-10 | 8.66e-09 | 74 |
| Page: 1 2 3 4 5 6 7 8 9 10 11 12 13 14 15 16 17 18 19 20 21 22 23 24 25 26 27 28 |
| Pathway ID | Tissue | Disease Stage | Description | Gene Ratio | Bg Ratio | pvalue | p.adjust | qvalue | Count |
| hsa04141211 | Esophagus | ESCC | Protein processing in endoplasmic reticulum | 147/4205 | 174/8465 | 3.29e-22 | 1.10e-19 | 5.64e-20 | 147 |
| hsa05010210 | Esophagus | ESCC | Alzheimer disease | 263/4205 | 384/8465 | 1.80e-14 | 5.47e-13 | 2.80e-13 | 263 |
| hsa05169210 | Esophagus | ESCC | Epstein-Barr virus infection | 151/4205 | 202/8465 | 1.55e-13 | 3.45e-12 | 1.77e-12 | 151 |
| hsa05167211 | Esophagus | ESCC | Kaposi sarcoma-associated herpesvirus infection | 136/4205 | 194/8465 | 4.28e-09 | 4.22e-08 | 2.16e-08 | 136 |
| hsa0516425 | Esophagus | ESCC | Influenza A | 122/4205 | 171/8465 | 5.01e-09 | 4.79e-08 | 2.45e-08 | 122 |
| hsa0516510 | Esophagus | ESCC | Human papillomavirus infection | 215/4205 | 331/8465 | 7.86e-09 | 7.12e-08 | 3.65e-08 | 215 |
| hsa05171211 | Esophagus | ESCC | Coronavirus disease - COVID-19 | 156/4205 | 232/8465 | 3.18e-08 | 2.68e-07 | 1.37e-07 | 156 |
| hsa0520325 | Esophagus | ESCC | Viral carcinogenesis | 137/4205 | 204/8465 | 2.47e-07 | 1.88e-06 | 9.62e-07 | 137 |
| hsa051609 | Esophagus | ESCC | Hepatitis C | 107/4205 | 157/8465 | 1.75e-06 | 1.08e-05 | 5.55e-06 | 107 |
| hsa051629 | Esophagus | ESCC | Measles | 90/4205 | 139/8465 | 2.16e-04 | 7.87e-04 | 4.03e-04 | 90 |
| hsa04141310 | Esophagus | ESCC | Protein processing in endoplasmic reticulum | 147/4205 | 174/8465 | 3.29e-22 | 1.10e-19 | 5.64e-20 | 147 |
| hsa0501038 | Esophagus | ESCC | Alzheimer disease | 263/4205 | 384/8465 | 1.80e-14 | 5.47e-13 | 2.80e-13 | 263 |
| hsa0516937 | Esophagus | ESCC | Epstein-Barr virus infection | 151/4205 | 202/8465 | 1.55e-13 | 3.45e-12 | 1.77e-12 | 151 |
| hsa0516738 | Esophagus | ESCC | Kaposi sarcoma-associated herpesvirus infection | 136/4205 | 194/8465 | 4.28e-09 | 4.22e-08 | 2.16e-08 | 136 |
| hsa0516435 | Esophagus | ESCC | Influenza A | 122/4205 | 171/8465 | 5.01e-09 | 4.79e-08 | 2.45e-08 | 122 |
| hsa0516515 | Esophagus | ESCC | Human papillomavirus infection | 215/4205 | 331/8465 | 7.86e-09 | 7.12e-08 | 3.65e-08 | 215 |
| hsa05171310 | Esophagus | ESCC | Coronavirus disease - COVID-19 | 156/4205 | 232/8465 | 3.18e-08 | 2.68e-07 | 1.37e-07 | 156 |
| hsa0520335 | Esophagus | ESCC | Viral carcinogenesis | 137/4205 | 204/8465 | 2.47e-07 | 1.88e-06 | 9.62e-07 | 137 |
| hsa0516016 | Esophagus | ESCC | Hepatitis C | 107/4205 | 157/8465 | 1.75e-06 | 1.08e-05 | 5.55e-06 | 107 |
| hsa0516213 | Esophagus | ESCC | Measles | 90/4205 | 139/8465 | 2.16e-04 | 7.87e-04 | 4.03e-04 | 90 |
| Page: 1 2 3 4 5 6 7 8 9 |
Top |
Cell-cell communication analysis |
| Identification of potential cell-cell interactions between two cell types and their ligand-receptor pairs for different disease states |
| Ligand | Receptor | LRpair | Pathway | Tissue | Disease Stage |
| Page: 1 |
Top |
Single-cell gene regulatory network inference analysis |
| Find out the significant the regulons (TFs) and the target genes of each regulon across cell types for different disease states |
| TF | Cell Type | Tissue | Disease Stage | Target Gene | RSS | Regulon Activity |
| ∗The dot plots of a searched regulon are shown for all cell subpopulations in each disease state of each tissue based on the regulon specific score inferred using pySCENIC and by calculating the average expression. |
| Page: 1 |
Top |
Somatic mutation of malignant transformation related genes |
| Annotation of somatic variants for genes involved in malignant transformation |
| Hugo Symbol | Variant Class | Variant Classification | dbSNP RS | HGVSc | HGVSp | HGVSp Short | SWISSPROT | BIOTYPE | SIFT | PolyPhen | Tumor Sample Barcode | Tissue | Histology | Sex | Age | Stage | Therapy Types | Drugs | Outcome |
| EIF2AK2 | SNV | Missense_Mutation | novel | c.1608G>C | p.Leu536Phe | p.L536F | P19525 | protein_coding | deleterious(0) | probably_damaging(1) | TCGA-A2-A3XZ-01 | Breast | breast invasive carcinoma | Female | <65 | I/II | Chemotherapy | carboplatin | CR |
| EIF2AK2 | SNV | Missense_Mutation | c.160N>A | p.Glu54Lys | p.E54K | P19525 | protein_coding | tolerated(0.23) | possibly_damaging(0.489) | TCGA-AC-A23H-01 | Breast | breast invasive carcinoma | Female | >=65 | I/II | Unknown | Unknown | PD | |
| EIF2AK2 | SNV | Missense_Mutation | c.1067N>T | p.Arg356Met | p.R356M | P19525 | protein_coding | deleterious(0) | possibly_damaging(0.892) | TCGA-EW-A1IZ-01 | Breast | breast invasive carcinoma | Female | <65 | III/IV | Chemotherapy | taxotere | SD | |
| EIF2AK2 | SNV | Missense_Mutation | novel | c.536N>T | p.Ser179Phe | p.S179F | P19525 | protein_coding | tolerated(0.18) | benign(0.006) | TCGA-C5-A2LZ-01 | Cervix | cervical & endocervical cancer | Female | >=65 | III/IV | Unknown | Unknown | PD |
| EIF2AK2 | SNV | Missense_Mutation | c.640G>C | p.Glu214Gln | p.E214Q | P19525 | protein_coding | tolerated(0.08) | benign(0.024) | TCGA-EK-A3GK-01 | Cervix | cervical & endocervical cancer | Female | <65 | I/II | Unknown | Unknown | SD | |
| EIF2AK2 | insertion | In_Frame_Ins | novel | c.748_749insAAATATTTTTAA | p.Pro250delinsGlnIlePheLeuThr | p.P250delinsQIFLT | P19525 | protein_coding | TCGA-DS-A1OC-01 | Cervix | cervical & endocervical cancer | Female | <65 | I/II | Chemotherapy | gemcitabine | SD | ||
| EIF2AK2 | insertion | In_Frame_Ins | novel | c.747_748insATT | p.Leu249_Pro250insIle | p.L249_P250insI | P19525 | protein_coding | TCGA-DS-A1OC-01 | Cervix | cervical & endocervical cancer | Female | <65 | I/II | Chemotherapy | gemcitabine | SD | ||
| EIF2AK2 | SNV | Missense_Mutation | c.1074G>C | p.Lys358Asn | p.K358N | P19525 | protein_coding | tolerated(0.12) | possibly_damaging(0.462) | TCGA-AD-A5EK-01 | Colorectum | colon adenocarcinoma | Male | <65 | I/II | Unknown | Unknown | SD | |
| EIF2AK2 | SNV | Missense_Mutation | c.704N>T | p.Asn235Ile | p.N235I | P19525 | protein_coding | deleterious(0.02) | benign(0.442) | TCGA-CK-4951-01 | Colorectum | colon adenocarcinoma | Female | >=65 | I/II | Unknown | Unknown | PD | |
| EIF2AK2 | SNV | Missense_Mutation | novel | c.1225N>C | p.Lys409Gln | p.K409Q | P19525 | protein_coding | tolerated(0.91) | benign(0.003) | TCGA-F5-6814-01 | Colorectum | rectum adenocarcinoma | Male | <65 | I/II | Unknown | Unknown | SD |
| Page: 1 2 3 4 5 |
Top |
Related drugs of malignant transformation related genes |
| Identification of chemicals and drugs interact with genes involved in malignant transfromation |
| (DGIdb 4.0) |
| Entrez ID | Symbol | Category | Interaction Types | Drug Claim Name | Drug Name | PMIDs |
| 5610 | EIF2AK2 | KINASE, DRUGGABLE GENOME, ENZYME, SERINE THREONINE KINASE, TRANSCRIPTION FACTOR | RICIN | 18599499 | ||
| 5610 | EIF2AK2 | KINASE, DRUGGABLE GENOME, ENZYME, SERINE THREONINE KINASE, TRANSCRIPTION FACTOR | IFN ALPHA-2B | 17501760 | ||
| 5610 | EIF2AK2 | KINASE, DRUGGABLE GENOME, ENZYME, SERINE THREONINE KINASE, TRANSCRIPTION FACTOR | BCG | BCG VACCINE | 16301626 | |
| 5610 | EIF2AK2 | KINASE, DRUGGABLE GENOME, ENZYME, SERINE THREONINE KINASE, TRANSCRIPTION FACTOR | IL-3 | 7519779 | ||
| 5610 | EIF2AK2 | KINASE, DRUGGABLE GENOME, ENZYME, SERINE THREONINE KINASE, TRANSCRIPTION FACTOR | inhibitor | 178102572 | ||
| 5610 | EIF2AK2 | KINASE, DRUGGABLE GENOME, ENZYME, SERINE THREONINE KINASE, TRANSCRIPTION FACTOR | inhibitor | 178102610 | ||
| 5610 | EIF2AK2 | KINASE, DRUGGABLE GENOME, ENZYME, SERINE THREONINE KINASE, TRANSCRIPTION FACTOR | inhibitor | 178102648 |
| Page: 1 |

Copyright 2023-Present -The University of Texas Health Science Center at Houston |