
|
|||||
|
 | |
| |
| |
| |
| |
| |
|
Gene: EIF2A |
Gene summary for EIF2A |
| Gene information | Species | Human | Gene symbol | EIF2A | Gene ID | 83939 |
| Gene name | eukaryotic translation initiation factor 2A | |
| Gene Alias | CDA02 | |
| Cytomap | 3q25.1 | |
| Gene Type | protein-coding | GO ID | GO:0006412 | UniProtAcc | Q9BY44 |
Top |
Malignant transformation analysis |
| Identification of the aberrant gene expression in precancerous and cancerous lesions by comparing the gene expression of stem-like cells in diseased tissues with normal stem cells |
| Entrez ID | Symbol | Replicates | Species | Organ | Tissue | Adj P-value | Log2FC | Malignancy |
| 83939 | EIF2A | LZE4T | Human | Esophagus | ESCC | 3.98e-19 | 8.69e-01 | 0.0811 |
| 83939 | EIF2A | LZE7T | Human | Esophagus | ESCC | 2.35e-04 | 3.86e-01 | 0.0667 |
| 83939 | EIF2A | LZE8T | Human | Esophagus | ESCC | 5.23e-05 | 4.97e-01 | 0.067 |
| 83939 | EIF2A | LZE20T | Human | Esophagus | ESCC | 4.27e-08 | 7.31e-03 | 0.0662 |
| 83939 | EIF2A | LZE22D1 | Human | Esophagus | HGIN | 2.96e-02 | 7.82e-02 | 0.0595 |
| 83939 | EIF2A | LZE24T | Human | Esophagus | ESCC | 1.16e-16 | 8.21e-01 | 0.0596 |
| 83939 | EIF2A | LZE21T | Human | Esophagus | ESCC | 8.15e-05 | 8.19e-01 | 0.0655 |
| 83939 | EIF2A | LZE6T | Human | Esophagus | ESCC | 4.87e-03 | 3.55e-01 | 0.0845 |
| 83939 | EIF2A | P1T-E | Human | Esophagus | ESCC | 4.07e-07 | 6.14e-01 | 0.0875 |
| 83939 | EIF2A | P2T-E | Human | Esophagus | ESCC | 2.35e-77 | 1.75e+00 | 0.1177 |
| 83939 | EIF2A | P4T-E | Human | Esophagus | ESCC | 6.53e-47 | 1.46e+00 | 0.1323 |
| 83939 | EIF2A | P5T-E | Human | Esophagus | ESCC | 2.99e-41 | 1.24e+00 | 0.1327 |
| 83939 | EIF2A | P8T-E | Human | Esophagus | ESCC | 3.55e-40 | 9.56e-01 | 0.0889 |
| 83939 | EIF2A | P9T-E | Human | Esophagus | ESCC | 3.04e-31 | 9.66e-01 | 0.1131 |
| 83939 | EIF2A | P10T-E | Human | Esophagus | ESCC | 1.25e-56 | 1.17e+00 | 0.116 |
| 83939 | EIF2A | P11T-E | Human | Esophagus | ESCC | 6.45e-15 | 8.95e-01 | 0.1426 |
| 83939 | EIF2A | P12T-E | Human | Esophagus | ESCC | 2.05e-34 | 8.54e-01 | 0.1122 |
| 83939 | EIF2A | P15T-E | Human | Esophagus | ESCC | 3.37e-61 | 1.72e+00 | 0.1149 |
| 83939 | EIF2A | P16T-E | Human | Esophagus | ESCC | 4.30e-61 | 1.29e+00 | 0.1153 |
| 83939 | EIF2A | P17T-E | Human | Esophagus | ESCC | 3.34e-14 | 7.86e-01 | 0.1278 |
| Page: 1 2 3 4 5 6 7 |
| Tissue | Expression Dynamics | Abbreviation |
| Esophagus | 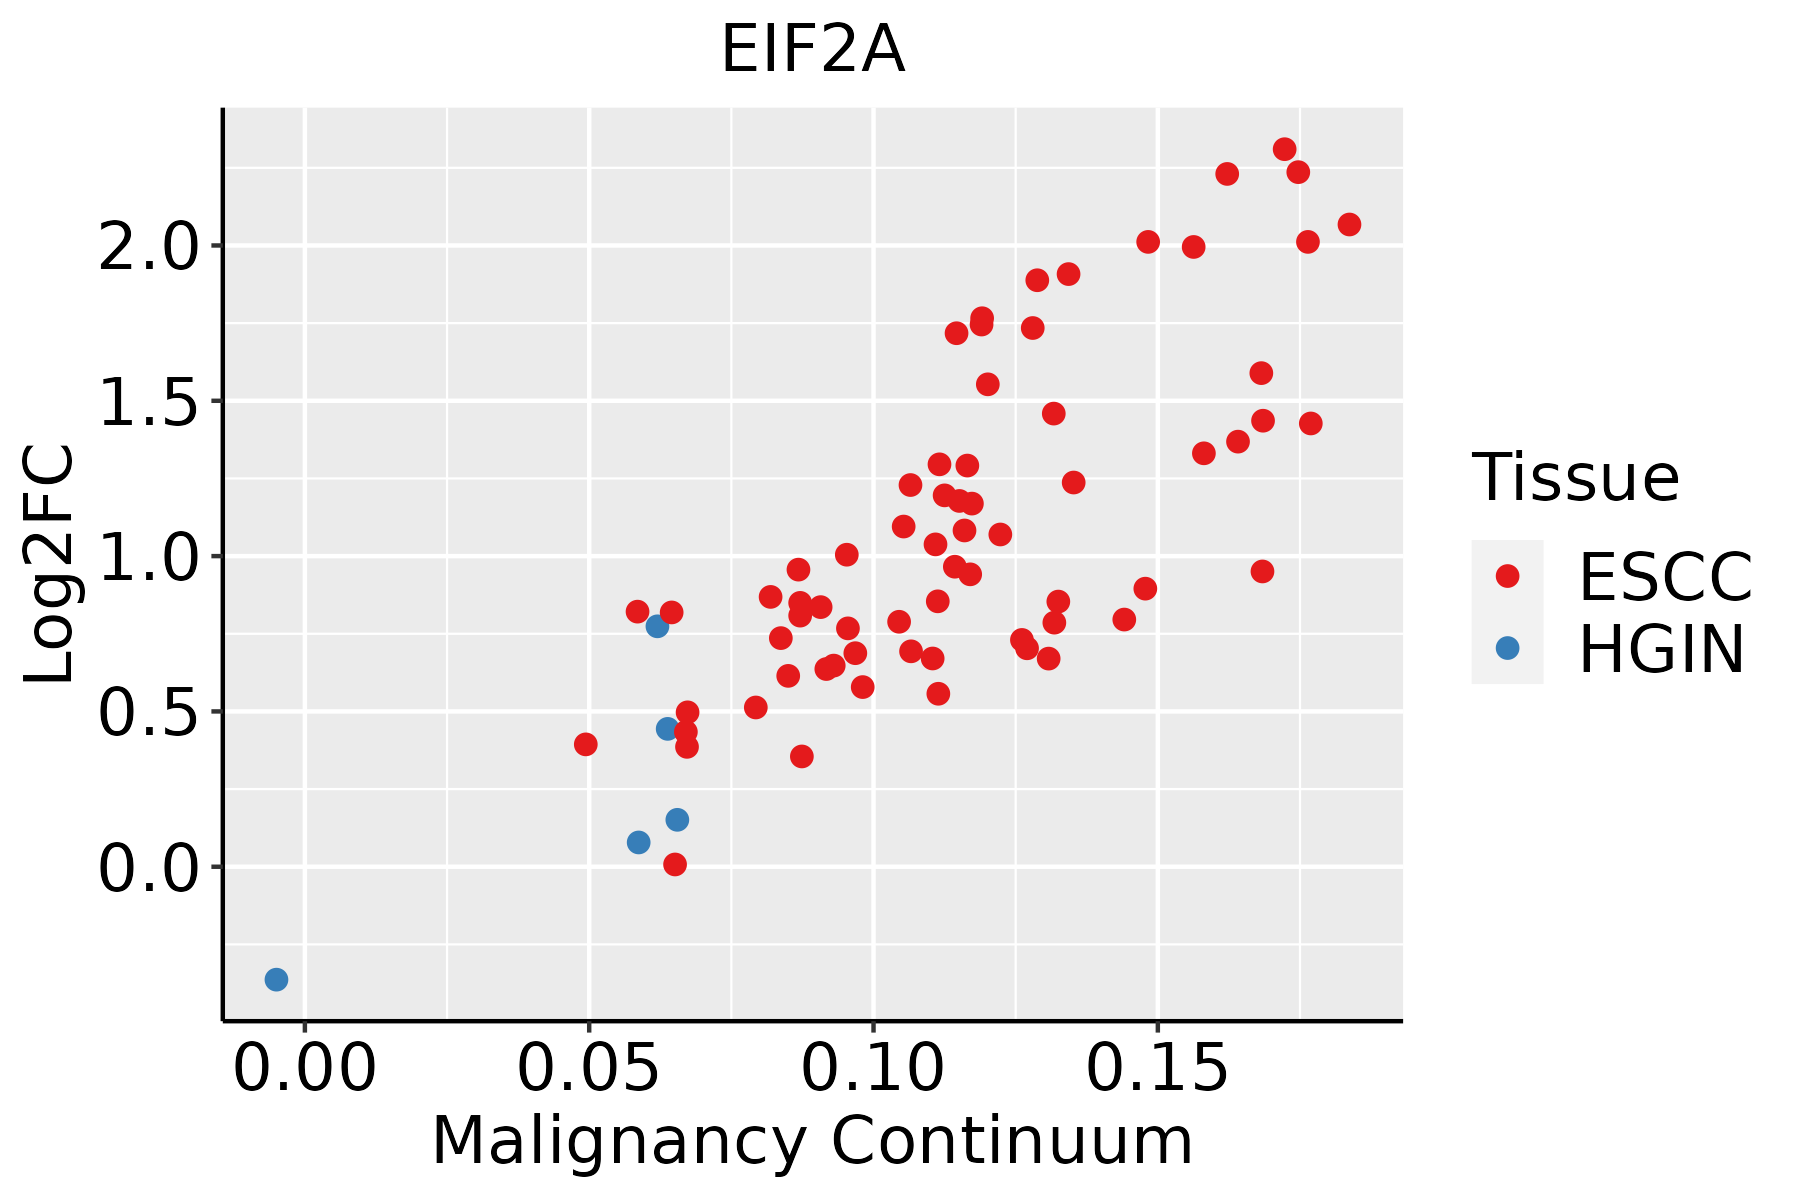 | ESCC: Esophageal squamous cell carcinoma |
| HGIN: High-grade intraepithelial neoplasias | ||
| LGIN: Low-grade intraepithelial neoplasias | ||
| Liver | 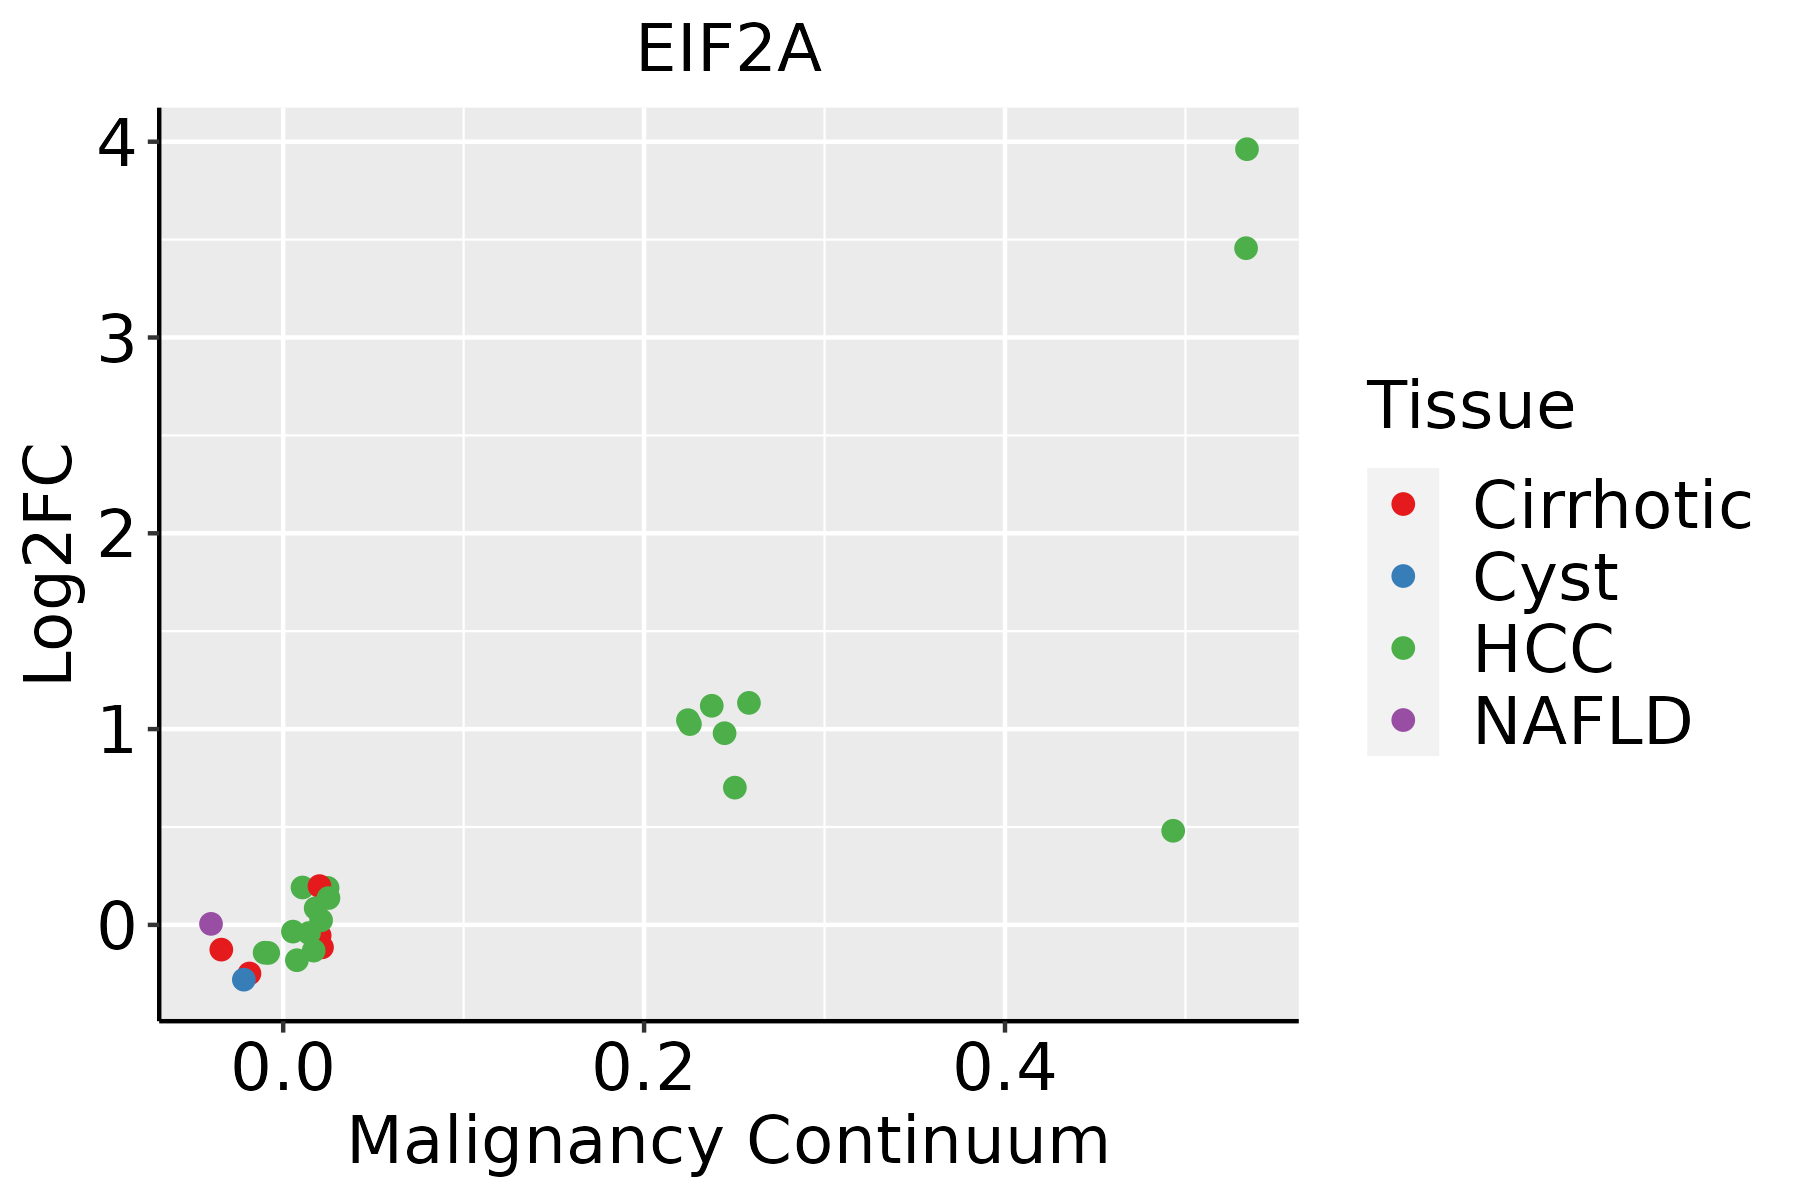 | HCC: Hepatocellular carcinoma |
| NAFLD: Non-alcoholic fatty liver disease | ||
| Oral Cavity | 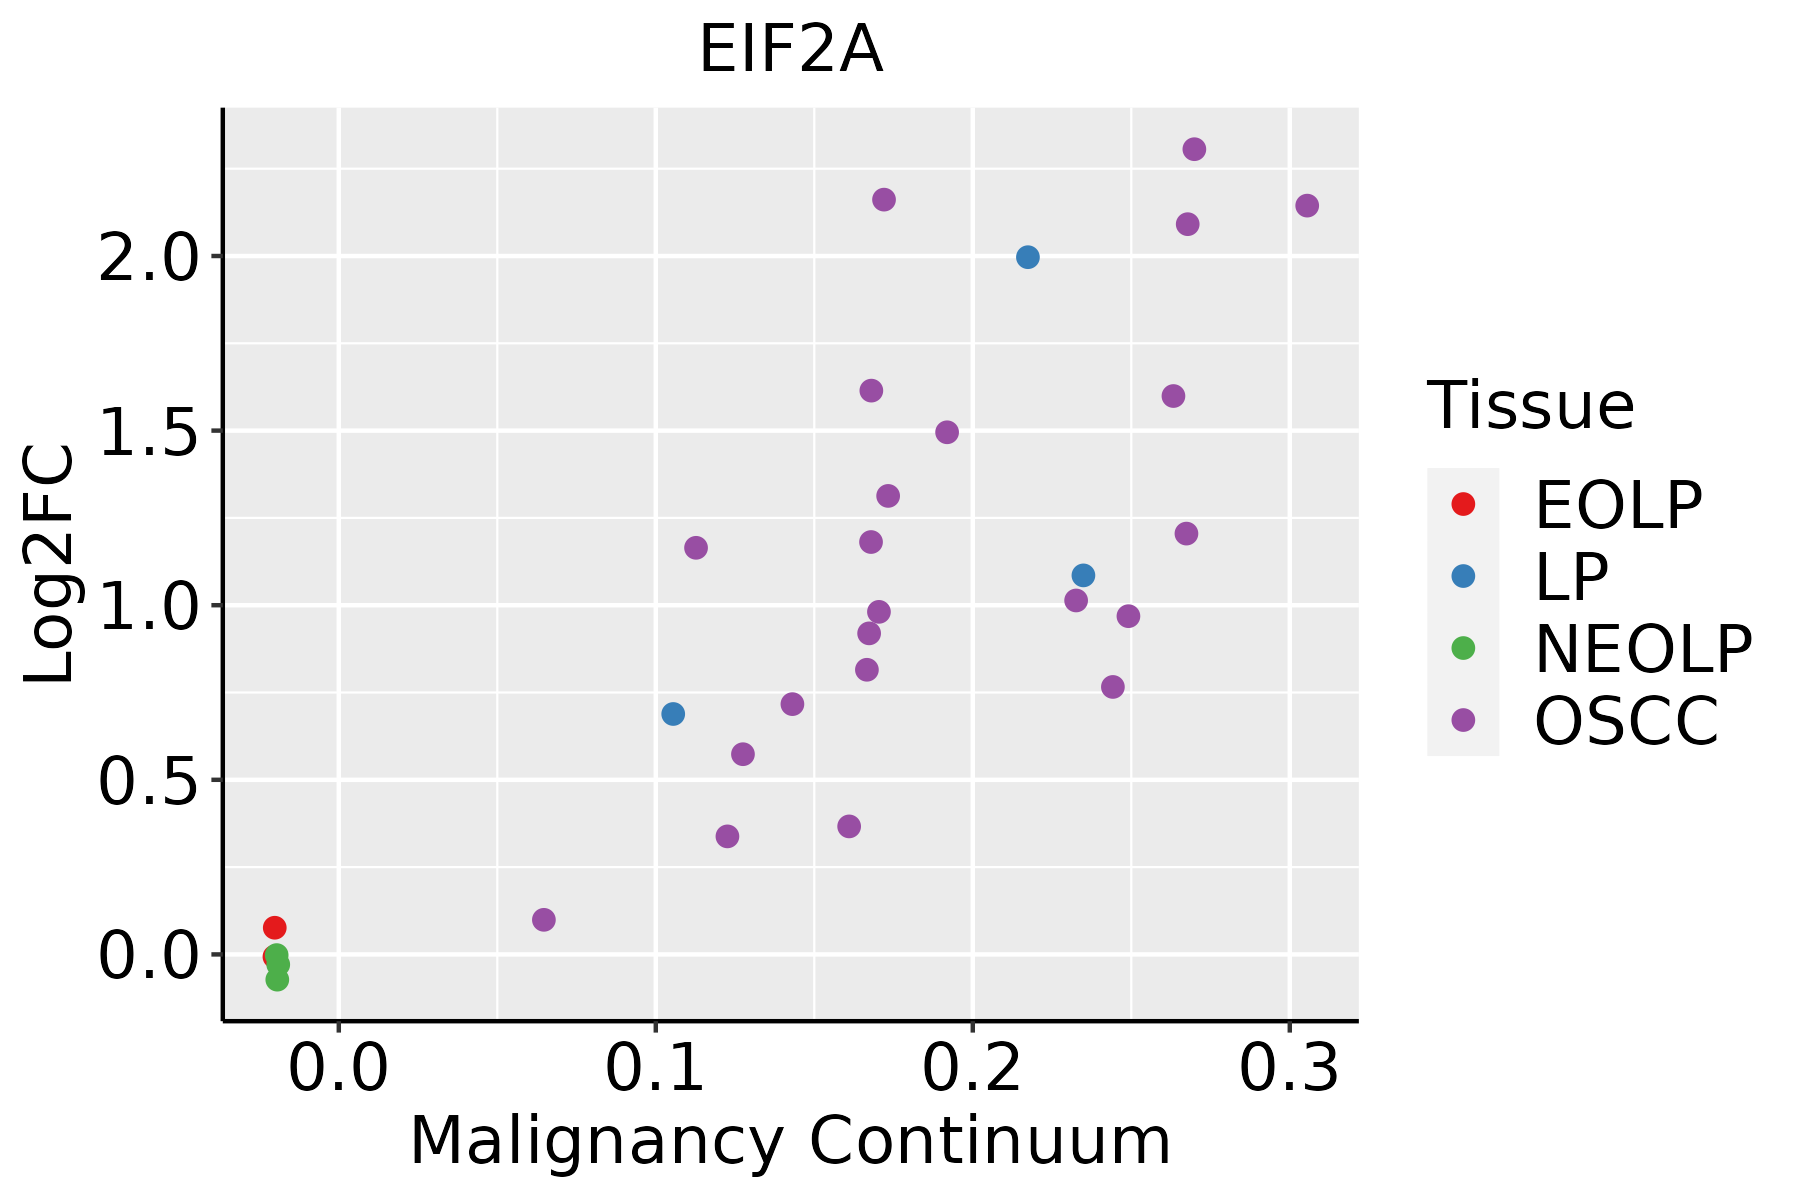 | EOLP: Erosive Oral lichen planus |
| LP: leukoplakia | ||
| NEOLP: Non-erosive oral lichen planus | ||
| OSCC: Oral squamous cell carcinoma | ||
| Skin | 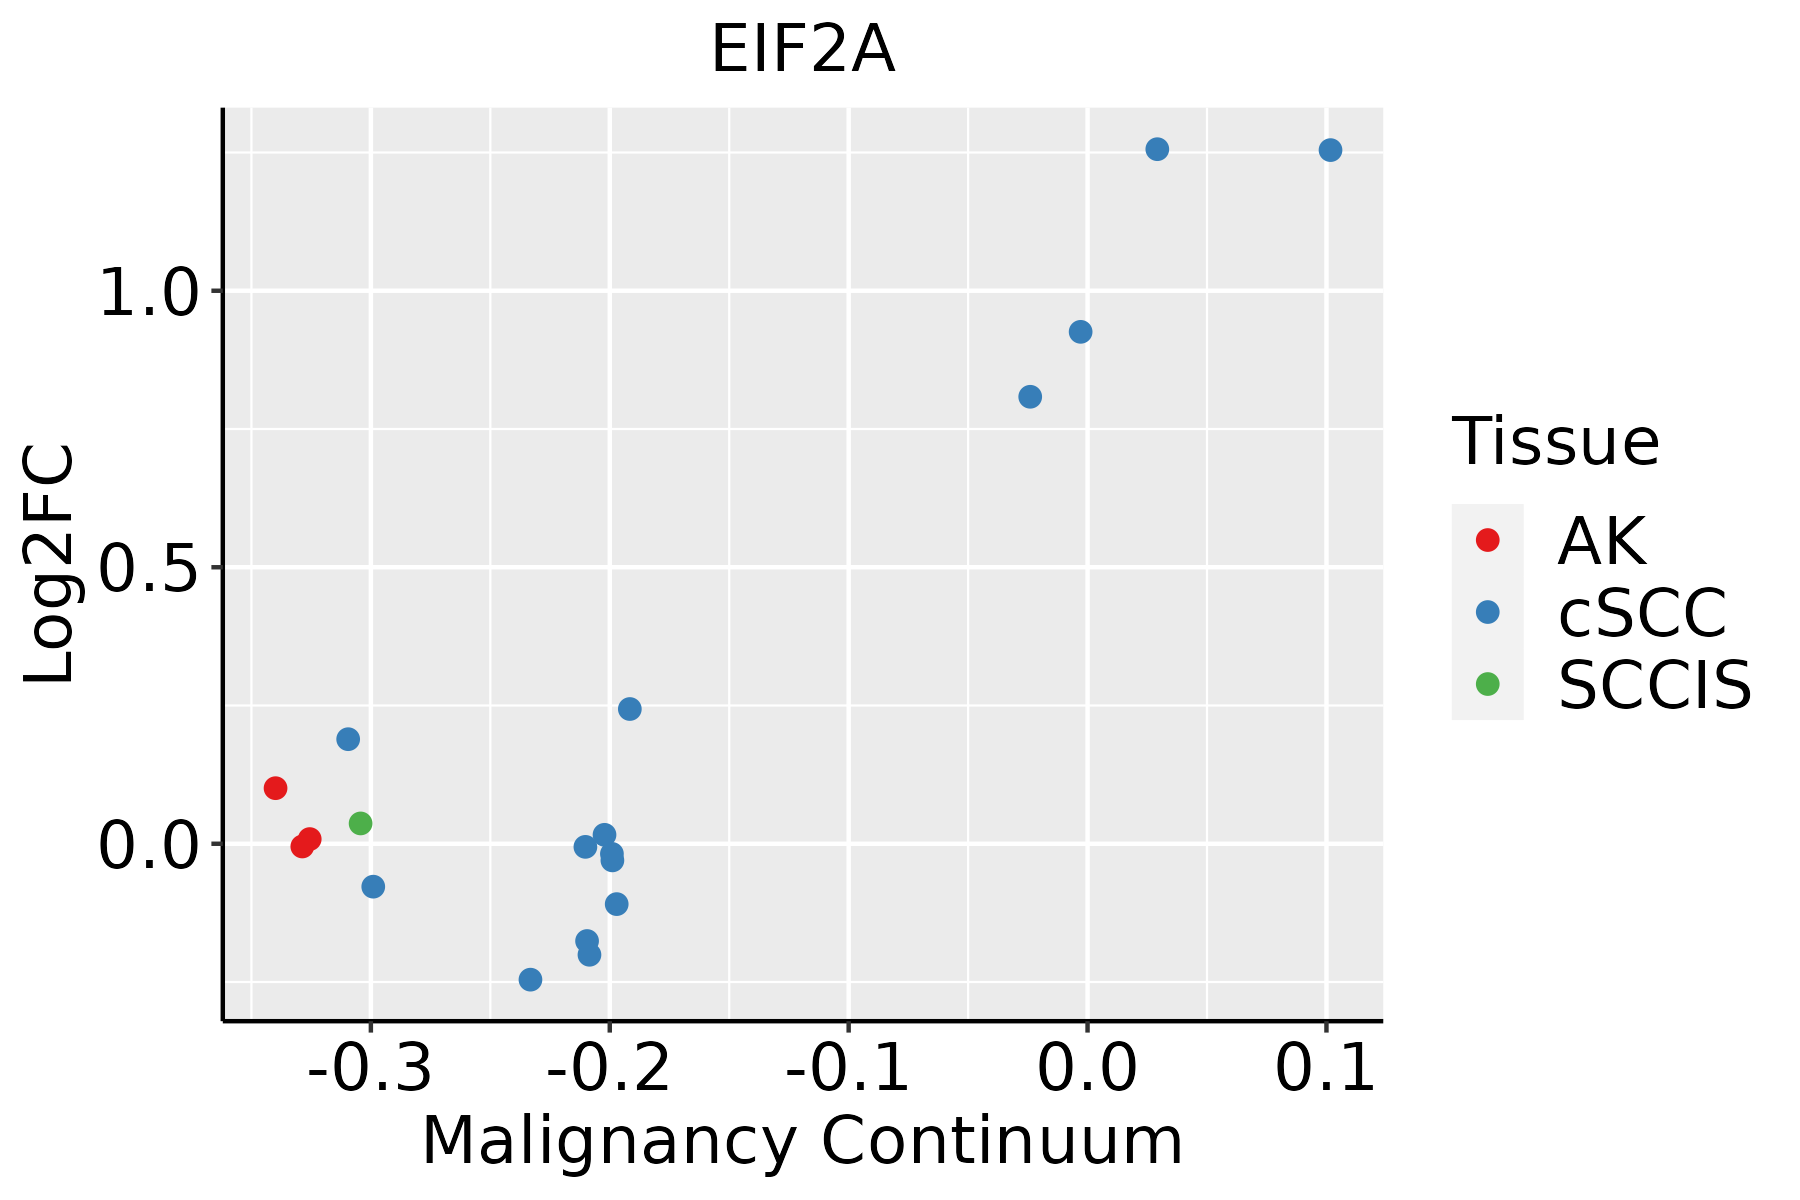 | AK: Actinic keratosis |
| cSCC: Cutaneous squamous cell carcinoma | ||
| SCCIS:squamous cell carcinoma in situ | ||
| Thyroid |  | ATC: Anaplastic thyroid cancer |
| HT: Hashimoto's thyroiditis | ||
| PTC: Papillary thyroid cancer |
| ∗log2FC in expression of this searched gene in stem-like cells from each diseased tissue sample relative to stem-like cells in normal samples in each tissue plotted against the malignancy continuum. Samples are colored based on if they are from different disease stage. |
Top |
Malignant transformation related pathway analysis |
| Find out the enriched GO biological processes and KEGG pathways involved in transition from healthy to precancer to cancer |
| Tissue | Disease Stage | Enriched GO biological Processes |
| Colorectum | AD |  |
| Colorectum | SER |  |
| Colorectum | MSS |  |
| Colorectum | MSI-H |  |
| Colorectum | FAP |  |
| ∗Top 15 enriched GO BP terms are showed in the bar plot of each disease state in each tissue. Each row represents a significant GO biological process which is colored according to the -log10(p.adjust). |
| Page: 1 2 3 4 5 6 7 8 9 |
| GO ID | Tissue | Disease Stage | Description | Gene Ratio | Bg Ratio | pvalue | p.adjust | Count |
| GO:0030099 | Colorectum | AD | myeloid cell differentiation | 119/3918 | 381/18723 | 1.24e-06 | 4.01e-05 | 119 |
| GO:0006417 | Colorectum | AD | regulation of translation | 141/3918 | 468/18723 | 1.32e-06 | 4.22e-05 | 141 |
| GO:0055076 | Colorectum | AD | transition metal ion homeostasis | 53/3918 | 138/18723 | 1.89e-06 | 5.65e-05 | 53 |
| GO:0031667 | Colorectum | AD | response to nutrient levels | 138/3918 | 474/18723 | 1.22e-05 | 2.68e-04 | 138 |
| GO:0006413 | Colorectum | AD | translational initiation | 45/3918 | 118/18723 | 1.35e-05 | 2.92e-04 | 45 |
| GO:0046777 | Colorectum | AD | protein autophosphorylation | 74/3918 | 227/18723 | 2.48e-05 | 4.76e-04 | 74 |
| GO:0042594 | Colorectum | AD | response to starvation | 63/3918 | 197/18723 | 1.77e-04 | 2.38e-03 | 63 |
| GO:0055072 | Colorectum | AD | iron ion homeostasis | 32/3918 | 85/18723 | 2.97e-04 | 3.60e-03 | 32 |
| GO:0006446 | Colorectum | AD | regulation of translational initiation | 28/3918 | 79/18723 | 2.02e-03 | 1.63e-02 | 28 |
| GO:0002573 | Colorectum | AD | myeloid leukocyte differentiation | 60/3918 | 208/18723 | 4.03e-03 | 2.81e-02 | 60 |
| GO:00064172 | Colorectum | MSS | regulation of translation | 134/3467 | 468/18723 | 4.43e-08 | 2.38e-06 | 134 |
| GO:00300992 | Colorectum | MSS | myeloid cell differentiation | 110/3467 | 381/18723 | 4.48e-07 | 1.75e-05 | 110 |
| GO:00064132 | Colorectum | MSS | translational initiation | 43/3467 | 118/18723 | 3.19e-06 | 9.38e-05 | 43 |
| GO:00316672 | Colorectum | MSS | response to nutrient levels | 125/3467 | 474/18723 | 1.24e-05 | 2.88e-04 | 125 |
| GO:00550762 | Colorectum | MSS | transition metal ion homeostasis | 45/3467 | 138/18723 | 4.99e-05 | 9.02e-04 | 45 |
| GO:00467772 | Colorectum | MSS | protein autophosphorylation | 63/3467 | 227/18723 | 3.96e-04 | 4.91e-03 | 63 |
| GO:00425942 | Colorectum | MSS | response to starvation | 56/3467 | 197/18723 | 4.25e-04 | 5.21e-03 | 56 |
| GO:00550722 | Colorectum | MSS | iron ion homeostasis | 29/3467 | 85/18723 | 4.44e-04 | 5.32e-03 | 29 |
| GO:00025731 | Colorectum | MSS | myeloid leukocyte differentiation | 57/3467 | 208/18723 | 1.01e-03 | 1.01e-02 | 57 |
| GO:00064461 | Colorectum | MSS | regulation of translational initiation | 26/3467 | 79/18723 | 1.56e-03 | 1.42e-02 | 26 |
| Page: 1 2 3 4 5 6 7 8 9 10 11 12 13 14 15 16 17 18 19 20 21 22 23 24 25 26 27 28 29 30 31 32 33 34 35 36 37 38 39 40 41 42 43 44 45 46 47 48 49 50 51 52 53 54 55 56 57 58 |
| Pathway ID | Tissue | Disease Stage | Description | Gene Ratio | Bg Ratio | pvalue | p.adjust | qvalue | Count |
| Page: 1 |
Top |
Cell-cell communication analysis |
| Identification of potential cell-cell interactions between two cell types and their ligand-receptor pairs for different disease states |
| Ligand | Receptor | LRpair | Pathway | Tissue | Disease Stage |
| Page: 1 |
Top |
Single-cell gene regulatory network inference analysis |
| Find out the significant the regulons (TFs) and the target genes of each regulon across cell types for different disease states |
| TF | Cell Type | Tissue | Disease Stage | Target Gene | RSS | Regulon Activity |
| ∗The dot plots of a searched regulon are shown for all cell subpopulations in each disease state of each tissue based on the regulon specific score inferred using pySCENIC and by calculating the average expression. |
| Page: 1 |
Top |
Somatic mutation of malignant transformation related genes |
| Annotation of somatic variants for genes involved in malignant transformation |
| Hugo Symbol | Variant Class | Variant Classification | dbSNP RS | HGVSc | HGVSp | HGVSp Short | SWISSPROT | BIOTYPE | SIFT | PolyPhen | Tumor Sample Barcode | Tissue | Histology | Sex | Age | Stage | Therapy Types | Drugs | Outcome |
| EIF2A | SNV | Missense_Mutation | novel | c.1330A>C | p.Thr444Pro | p.T444P | Q9BY44 | protein_coding | tolerated(0.08) | benign(0.011) | TCGA-AO-A0JB-01 | Breast | breast invasive carcinoma | Female | <65 | III/IV | Chemotherapy | cyclophosphamide | SD |
| EIF2A | SNV | Missense_Mutation | c.1669G>A | p.Gly557Arg | p.G557R | Q9BY44 | protein_coding | deleterious(0) | probably_damaging(1) | TCGA-BH-A0DE-01 | Breast | breast invasive carcinoma | Female | <65 | I/II | Unknown | Unknown | SD | |
| EIF2A | SNV | Missense_Mutation | novel | c.311N>T | p.Ala104Val | p.A104V | Q9BY44 | protein_coding | tolerated(0.2) | benign(0.017) | TCGA-EW-A6SC-01 | Breast | breast invasive carcinoma | Female | <65 | I/II | Hormone Therapy | aromatase | SD |
| EIF2A | SNV | Missense_Mutation | novel | c.923C>A | p.Pro308His | p.P308H | Q9BY44 | protein_coding | deleterious(0) | probably_damaging(0.987) | TCGA-2W-A8YY-01 | Cervix | cervical & endocervical cancer | Female | <65 | I/II | Chemotherapy | cisplatin | CR |
| EIF2A | SNV | Missense_Mutation | novel | c.360N>C | p.Leu120Phe | p.L120F | Q9BY44 | protein_coding | deleterious(0.01) | benign(0.344) | TCGA-EA-A3HU-01 | Cervix | cervical & endocervical cancer | Female | <65 | I/II | Unknown | Unknown | SD |
| EIF2A | SNV | Missense_Mutation | c.580N>A | p.Ala194Thr | p.A194T | Q9BY44 | protein_coding | tolerated(0.06) | benign(0.131) | TCGA-AA-3715-01 | Colorectum | colon adenocarcinoma | Male | >=65 | I/II | Unknown | Unknown | PD | |
| EIF2A | SNV | Missense_Mutation | novel | c.701N>T | p.Ala234Val | p.A234V | Q9BY44 | protein_coding | deleterious(0.02) | probably_damaging(0.937) | TCGA-AA-3812-01 | Colorectum | colon adenocarcinoma | Female | >=65 | I/II | Unknown | Unknown | PD |
| EIF2A | SNV | Missense_Mutation | c.869C>T | p.Ala290Val | p.A290V | Q9BY44 | protein_coding | tolerated(1) | benign(0) | TCGA-AA-A010-01 | Colorectum | colon adenocarcinoma | Female | <65 | I/II | Chemotherapy | folinic | CR | |
| EIF2A | SNV | Missense_Mutation | rs769029119 | c.431N>A | p.Arg144His | p.R144H | Q9BY44 | protein_coding | deleterious(0.04) | benign(0.335) | TCGA-AU-6004-01 | Colorectum | colon adenocarcinoma | Female | >=65 | I/II | Unknown | Unknown | SD |
| EIF2A | SNV | Missense_Mutation | novel | c.506N>C | p.Lys169Thr | p.K169T | Q9BY44 | protein_coding | deleterious(0) | benign(0.358) | TCGA-AZ-4315-01 | Colorectum | colon adenocarcinoma | Male | <65 | I/II | Unknown | Unknown | SD |
| Page: 1 2 3 4 5 6 |
Top |
Related drugs of malignant transformation related genes |
| Identification of chemicals and drugs interact with genes involved in malignant transfromation |
| (DGIdb 4.0) |
| Entrez ID | Symbol | Category | Interaction Types | Drug Claim Name | Drug Name | PMIDs |
| Page: 1 |

Copyright 2023-Present -The University of Texas Health Science Center at Houston |