| Tissue | Expression Dynamics | Abbreviation |
| Cervix | 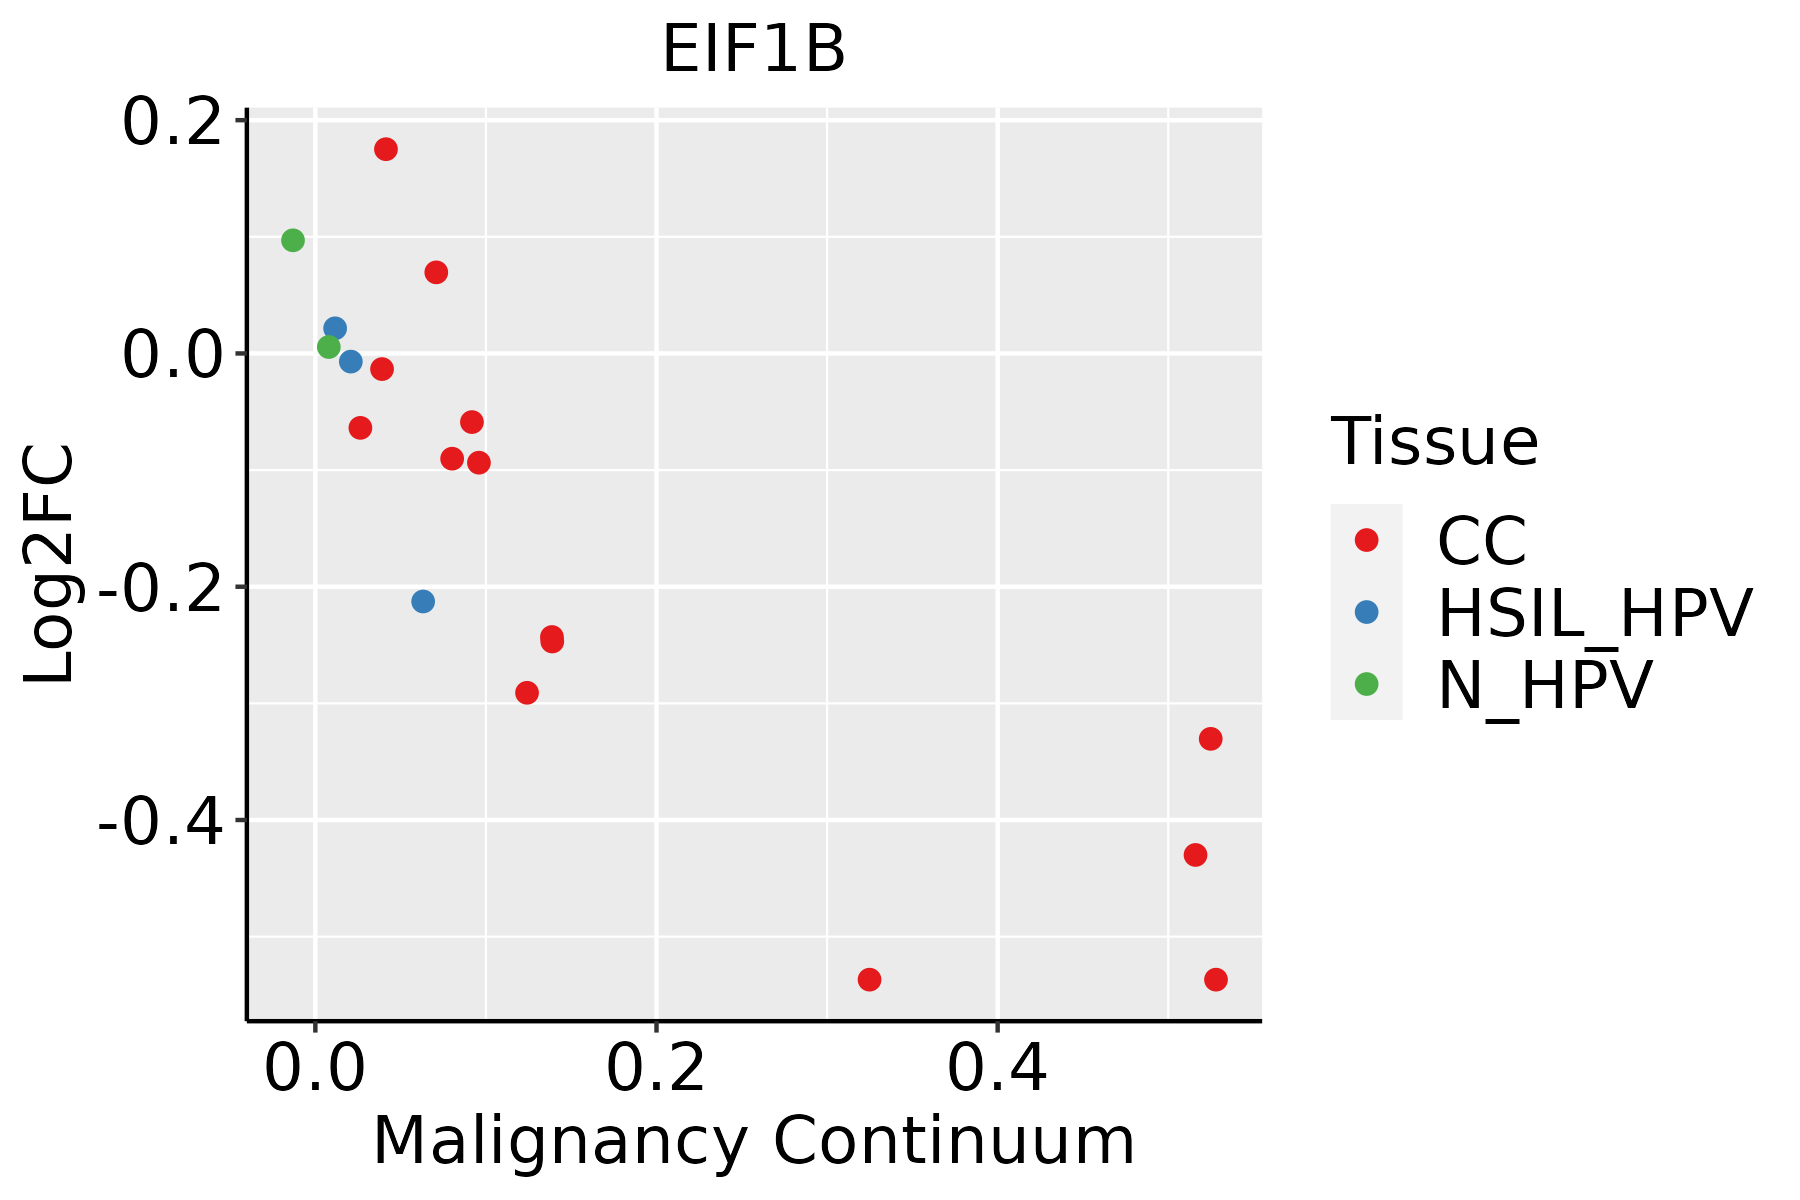 | CC: Cervix cancer |
| HSIL_HPV: HPV-infected high-grade squamous intraepithelial lesions |
| N_HPV: HPV-infected normal cervix |
| Endometrium | 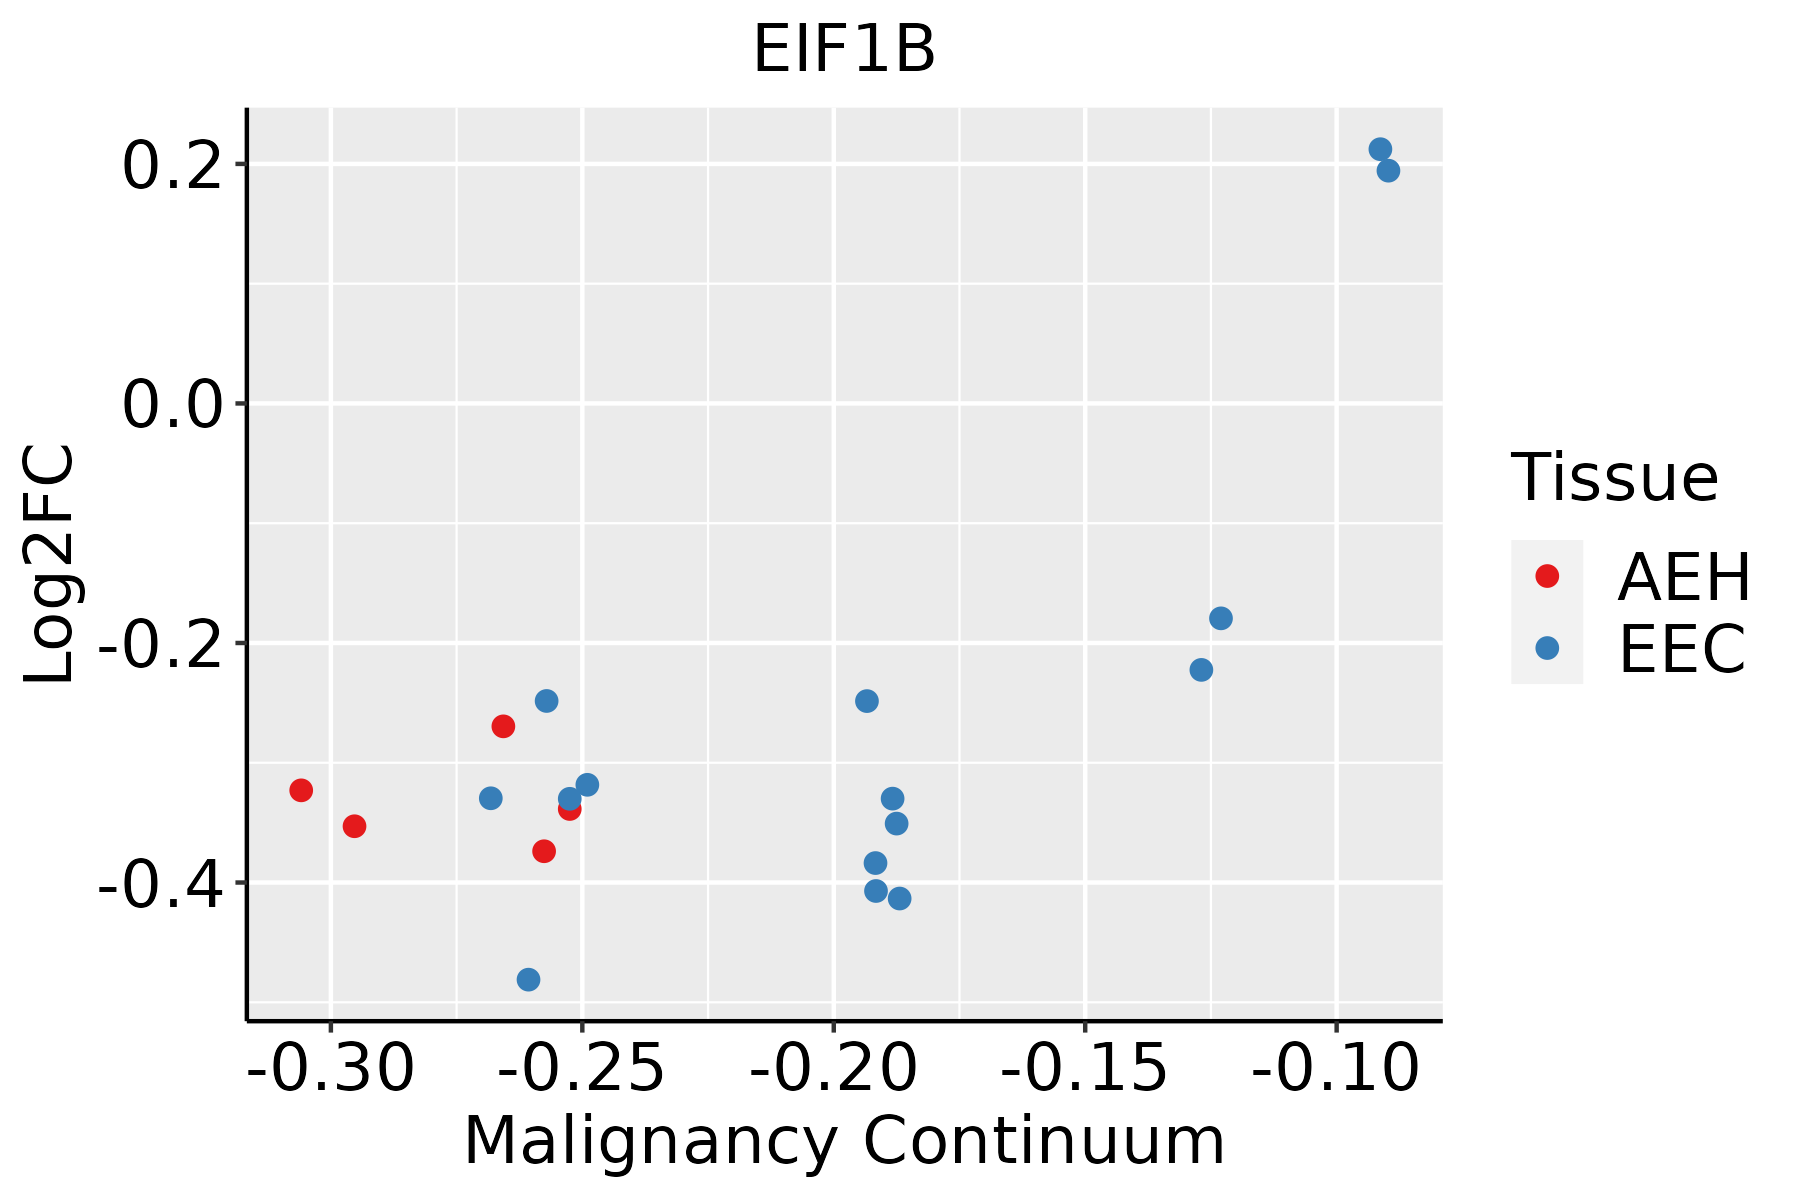 | AEH: Atypical endometrial hyperplasia |
| EEC: Endometrioid Cancer |
| Esophagus |  | ESCC: Esophageal squamous cell carcinoma |
| HGIN: High-grade intraepithelial neoplasias |
| LGIN: Low-grade intraepithelial neoplasias |
| Liver |  | HCC: Hepatocellular carcinoma |
| NAFLD: Non-alcoholic fatty liver disease |
| Oral Cavity |  | EOLP: Erosive Oral lichen planus |
| LP: leukoplakia |
| NEOLP: Non-erosive oral lichen planus |
| OSCC: Oral squamous cell carcinoma |
| Prostate | 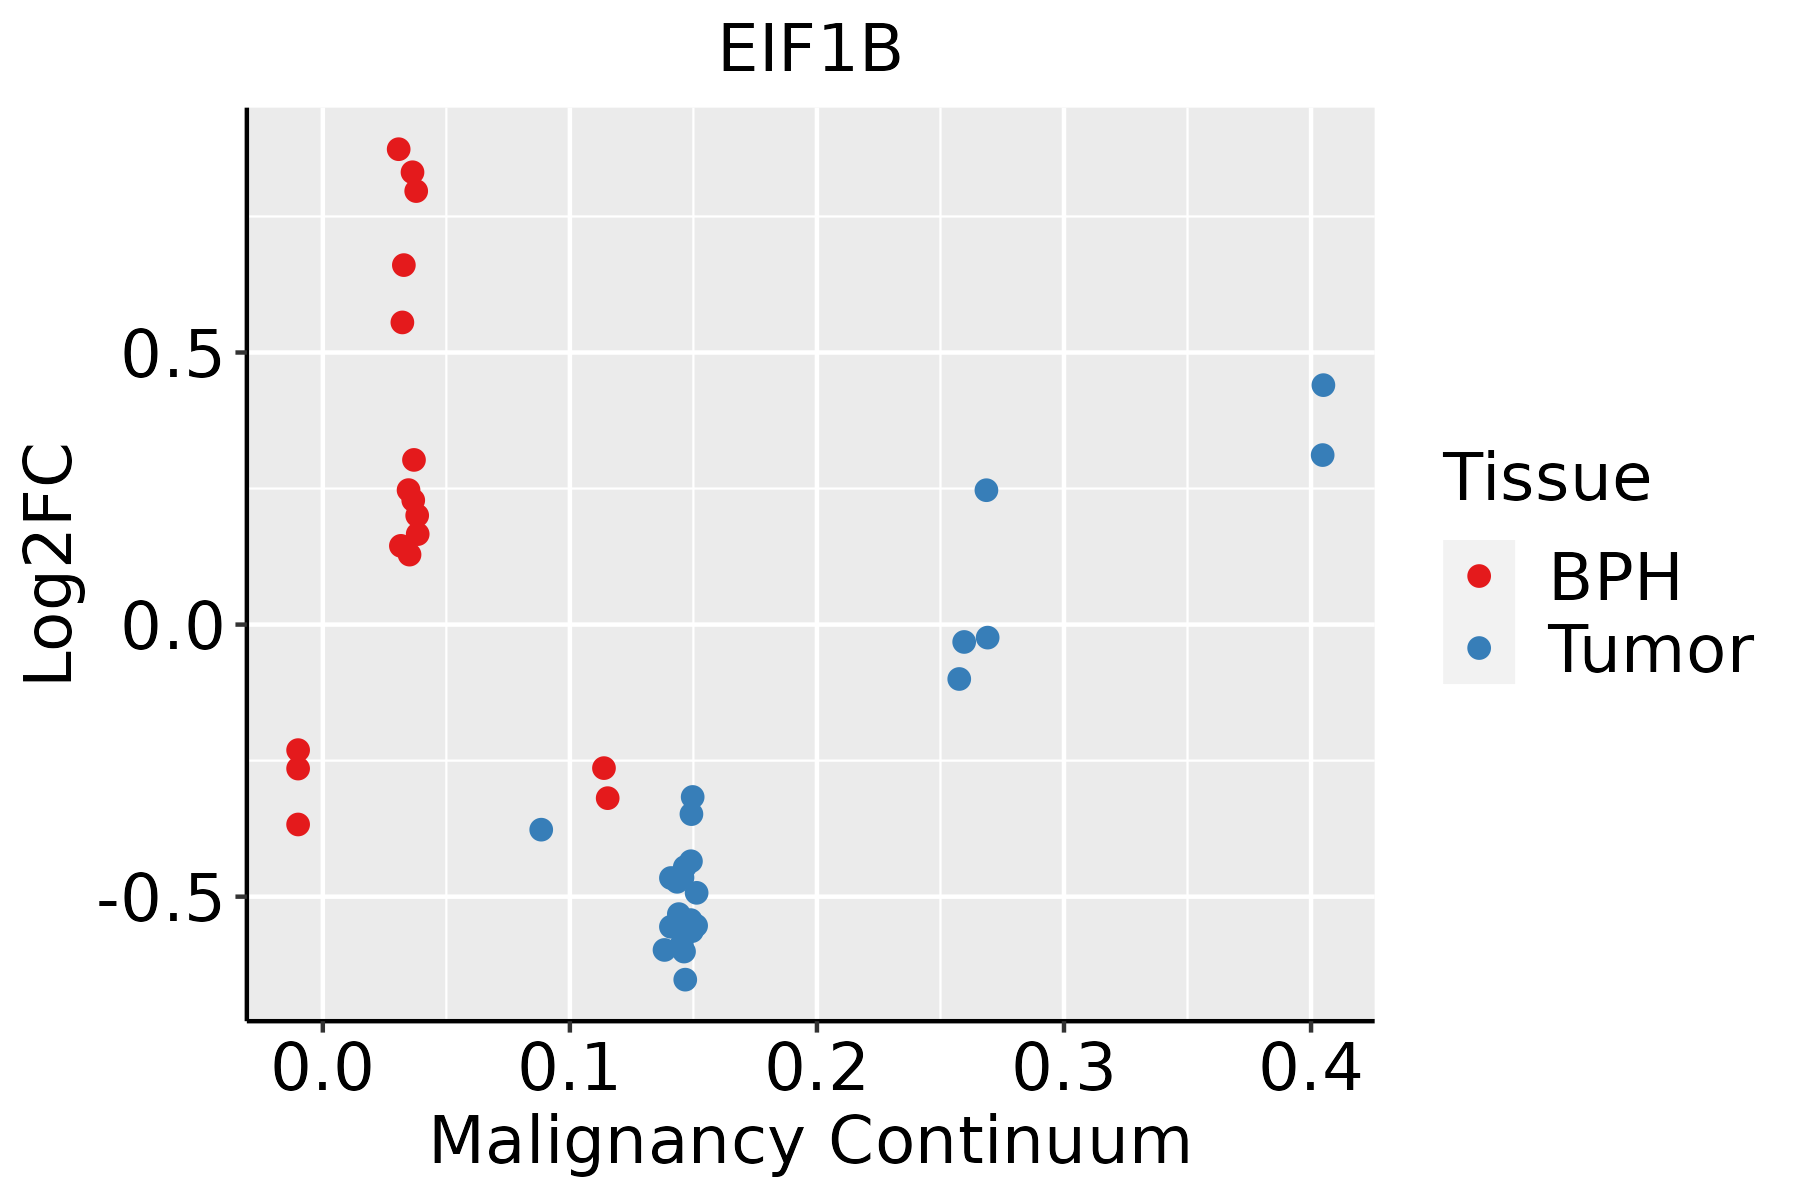 | BPH: Benign Prostatic Hyperplasia |
| Skin |  | AK: Actinic keratosis |
| cSCC: Cutaneous squamous cell carcinoma |
| SCCIS:squamous cell carcinoma in situ |
| Thyroid |  | ATC: Anaplastic thyroid cancer |
| HT: Hashimoto's thyroiditis |
| PTC: Papillary thyroid cancer |
| GO ID | Tissue | Disease Stage | Description | Gene Ratio | Bg Ratio | pvalue | p.adjust | Count |
| GO:000641710 | Cervix | CC | regulation of translation | 89/2311 | 468/18723 | 1.86e-05 | 3.46e-04 | 89 |
| GO:00064139 | Cervix | CC | translational initiation | 25/2311 | 118/18723 | 4.54e-03 | 2.75e-02 | 25 |
| GO:000641310 | Endometrium | AEH | translational initiation | 42/2100 | 118/18723 | 2.68e-12 | 4.67e-10 | 42 |
| GO:000641716 | Endometrium | AEH | regulation of translation | 94/2100 | 468/18723 | 1.14e-08 | 7.62e-07 | 94 |
| GO:00064467 | Endometrium | AEH | regulation of translational initiation | 25/2100 | 79/18723 | 8.99e-07 | 3.19e-05 | 25 |
| GO:000641315 | Endometrium | EEC | translational initiation | 42/2168 | 118/18723 | 7.65e-12 | 1.24e-09 | 42 |
| GO:000641717 | Endometrium | EEC | regulation of translation | 94/2168 | 468/18723 | 5.37e-08 | 2.88e-06 | 94 |
| GO:000644614 | Endometrium | EEC | regulation of translational initiation | 25/2168 | 79/18723 | 1.62e-06 | 5.03e-05 | 25 |
| GO:000641727 | Esophagus | HGIN | regulation of translation | 139/2587 | 468/18723 | 1.46e-19 | 7.98e-17 | 139 |
| GO:000641320 | Esophagus | HGIN | translational initiation | 55/2587 | 118/18723 | 7.33e-18 | 2.31e-15 | 55 |
| GO:000644610 | Esophagus | HGIN | regulation of translational initiation | 34/2587 | 79/18723 | 2.09e-10 | 1.97e-08 | 34 |
| GO:0006413110 | Esophagus | ESCC | translational initiation | 100/8552 | 118/18723 | 1.16e-18 | 1.25e-16 | 100 |
| GO:0006417111 | Esophagus | ESCC | regulation of translation | 304/8552 | 468/18723 | 1.53e-17 | 1.33e-15 | 304 |
| GO:000644617 | Esophagus | ESCC | regulation of translational initiation | 65/8552 | 79/18723 | 2.04e-11 | 7.07e-10 | 65 |
| GO:000641312 | Liver | Cirrhotic | translational initiation | 76/4634 | 118/18723 | 8.36e-20 | 2.18e-17 | 76 |
| GO:000641712 | Liver | Cirrhotic | regulation of translation | 194/4634 | 468/18723 | 7.28e-16 | 8.79e-14 | 194 |
| GO:000644612 | Liver | Cirrhotic | regulation of translational initiation | 48/4634 | 79/18723 | 1.14e-11 | 7.14e-10 | 48 |
| GO:000641722 | Liver | HCC | regulation of translation | 287/7958 | 468/18723 | 8.79e-17 | 8.08e-15 | 287 |
| GO:000641322 | Liver | HCC | translational initiation | 94/7958 | 118/18723 | 1.39e-16 | 1.24e-14 | 94 |
| GO:000644622 | Liver | HCC | regulation of translational initiation | 62/7958 | 79/18723 | 6.85e-11 | 2.48e-09 | 62 |
| Hugo Symbol | Variant Class | Variant Classification | dbSNP RS | HGVSc | HGVSp | HGVSp Short | SWISSPROT | BIOTYPE | SIFT | PolyPhen | Tumor Sample Barcode | Tissue | Histology | Sex | Age | Stage | Therapy Types | Drugs | Outcome |
| EIF1B | SNV | Missense_Mutation | novel | c.332N>G | p.His111Arg | p.H111R | O60739 | protein_coding | deleterious(0.01) | possibly_damaging(0.706) | TCGA-AA-A02R-01 | Colorectum | colon adenocarcinoma | Female | >=65 | I/II | Unknown | Unknown | PD |
| EIF1B | SNV | Missense_Mutation | novel | c.171N>T | p.Lys57Asn | p.K57N | O60739 | protein_coding | tolerated(0.1) | probably_damaging(0.976) | TCGA-EI-6917-01 | Colorectum | rectum adenocarcinoma | Male | <65 | III/IV | Chemotherapy | 5fluorouracil+oxaciplatina+l-folinian | SD |
| EIF1B | SNV | Missense_Mutation | novel | c.41N>T | p.Ala14Val | p.A14V | O60739 | protein_coding | deleterious(0.02) | benign(0.003) | TCGA-A5-A1OF-01 | Endometrium | uterine corpus endometrioid carcinoma | Female | <65 | I/II | Unknown | Unknown | SD |
| EIF1B | SNV | Missense_Mutation | novel | c.238N>A | p.Gly80Arg | p.G80R | O60739 | protein_coding | deleterious(0.03) | possibly_damaging(0.572) | TCGA-A5-A1OF-01 | Endometrium | uterine corpus endometrioid carcinoma | Female | <65 | I/II | Unknown | Unknown | SD |
| EIF1B | SNV | Missense_Mutation | novel | c.171N>T | p.Lys57Asn | p.K57N | O60739 | protein_coding | tolerated(0.1) | probably_damaging(0.976) | TCGA-AJ-A3EL-01 | Endometrium | uterine corpus endometrioid carcinoma | Female | <65 | I/II | Unknown | Unknown | SD |
| EIF1B | SNV | Missense_Mutation | novel | c.26N>A | p.Ser9Tyr | p.S9Y | O60739 | protein_coding | deleterious(0.02) | benign(0.033) | TCGA-AJ-A5DW-01 | Endometrium | uterine corpus endometrioid carcinoma | Female | <65 | I/II | Unknown | Unknown | SD |
| EIF1B | SNV | Missense_Mutation | novel | c.289N>A | p.Leu97Ile | p.L97I | O60739 | protein_coding | deleterious(0.03) | possibly_damaging(0.688) | TCGA-B5-A1MR-01 | Endometrium | uterine corpus endometrioid carcinoma | Female | >=65 | III/IV | Unknown | Unknown | SD |
| EIF1B | SNV | Missense_Mutation | novel | c.285G>T | p.Gln95His | p.Q95H | O60739 | protein_coding | deleterious(0.03) | benign(0.015) | TCGA-B5-A3FC-01 | Endometrium | uterine corpus endometrioid carcinoma | Female | <65 | I/II | Unknown | Unknown | SD |
| EIF1B | SNV | Missense_Mutation | | c.195N>T | p.Lys65Asn | p.K65N | O60739 | protein_coding | deleterious(0.01) | probably_damaging(0.986) | TCGA-BS-A0UV-01 | Endometrium | uterine corpus endometrioid carcinoma | Female | <65 | III/IV | Unknown | Unknown | SD |
| EIF1B | SNV | Missense_Mutation | novel | c.200N>C | p.Phe67Ser | p.F67S | O60739 | protein_coding | deleterious(0) | probably_damaging(0.968) | TCGA-EO-A3B0-01 | Endometrium | uterine corpus endometrioid carcinoma | Female | <65 | III/IV | Unknown | Unknown | SD |


