
|
|||||
|
 | |
| |
| |
| |
| |
| |
|
Gene: EIF1 |
Gene summary for EIF1 |
| Gene information | Species | Human | Gene symbol | EIF1 | Gene ID | 10209 |
| Gene name | eukaryotic translation initiation factor 1 | |
| Gene Alias | A121 | |
| Cytomap | 17q21.2 | |
| Gene Type | protein-coding | GO ID | GO:0006412 | UniProtAcc | P41567 |
Top |
Malignant transformation analysis |
| Identification of the aberrant gene expression in precancerous and cancerous lesions by comparing the gene expression of stem-like cells in diseased tissues with normal stem cells |
| Entrez ID | Symbol | Replicates | Species | Organ | Tissue | Adj P-value | Log2FC | Malignancy |
| 10209 | EIF1 | GSM4909281 | Human | Breast | IDC | 2.75e-11 | -2.52e-01 | 0.21 |
| 10209 | EIF1 | GSM4909286 | Human | Breast | IDC | 3.21e-06 | 1.27e-01 | 0.1081 |
| 10209 | EIF1 | GSM4909287 | Human | Breast | IDC | 2.53e-12 | -2.86e-01 | 0.2057 |
| 10209 | EIF1 | GSM4909290 | Human | Breast | IDC | 3.74e-16 | -2.64e-01 | 0.2096 |
| 10209 | EIF1 | GSM4909293 | Human | Breast | IDC | 1.43e-24 | -3.00e-01 | 0.1581 |
| 10209 | EIF1 | GSM4909294 | Human | Breast | IDC | 6.83e-03 | -1.79e-01 | 0.2022 |
| 10209 | EIF1 | GSM4909296 | Human | Breast | IDC | 1.17e-20 | -4.89e-01 | 0.1524 |
| 10209 | EIF1 | GSM4909297 | Human | Breast | IDC | 3.43e-14 | -7.92e-02 | 0.1517 |
| 10209 | EIF1 | GSM4909298 | Human | Breast | IDC | 5.52e-17 | -2.58e-01 | 0.1551 |
| 10209 | EIF1 | GSM4909301 | Human | Breast | IDC | 1.93e-31 | -4.81e-01 | 0.1577 |
| 10209 | EIF1 | GSM4909302 | Human | Breast | IDC | 2.55e-24 | -4.12e-01 | 0.1545 |
| 10209 | EIF1 | GSM4909304 | Human | Breast | IDC | 3.78e-35 | -3.80e-01 | 0.1636 |
| 10209 | EIF1 | GSM4909306 | Human | Breast | IDC | 1.80e-03 | -1.56e-01 | 0.1564 |
| 10209 | EIF1 | GSM4909307 | Human | Breast | IDC | 8.72e-14 | -2.62e-01 | 0.1569 |
| 10209 | EIF1 | GSM4909309 | Human | Breast | IDC | 3.38e-04 | -1.87e-01 | 0.0483 |
| 10209 | EIF1 | GSM4909311 | Human | Breast | IDC | 1.63e-36 | -5.62e-01 | 0.1534 |
| 10209 | EIF1 | GSM4909316 | Human | Breast | IDC | 8.51e-03 | -2.16e-01 | 0.21 |
| 10209 | EIF1 | GSM4909319 | Human | Breast | IDC | 3.05e-44 | -3.29e-01 | 0.1563 |
| 10209 | EIF1 | GSM4909320 | Human | Breast | IDC | 2.47e-07 | -3.41e-01 | 0.1575 |
| 10209 | EIF1 | GSM4909321 | Human | Breast | IDC | 2.45e-03 | 4.72e-02 | 0.1559 |
| Page: 1 2 3 4 5 6 7 8 9 10 11 12 13 14 15 16 17 18 19 20 |
| Tissue | Expression Dynamics | Abbreviation |
| Breast | 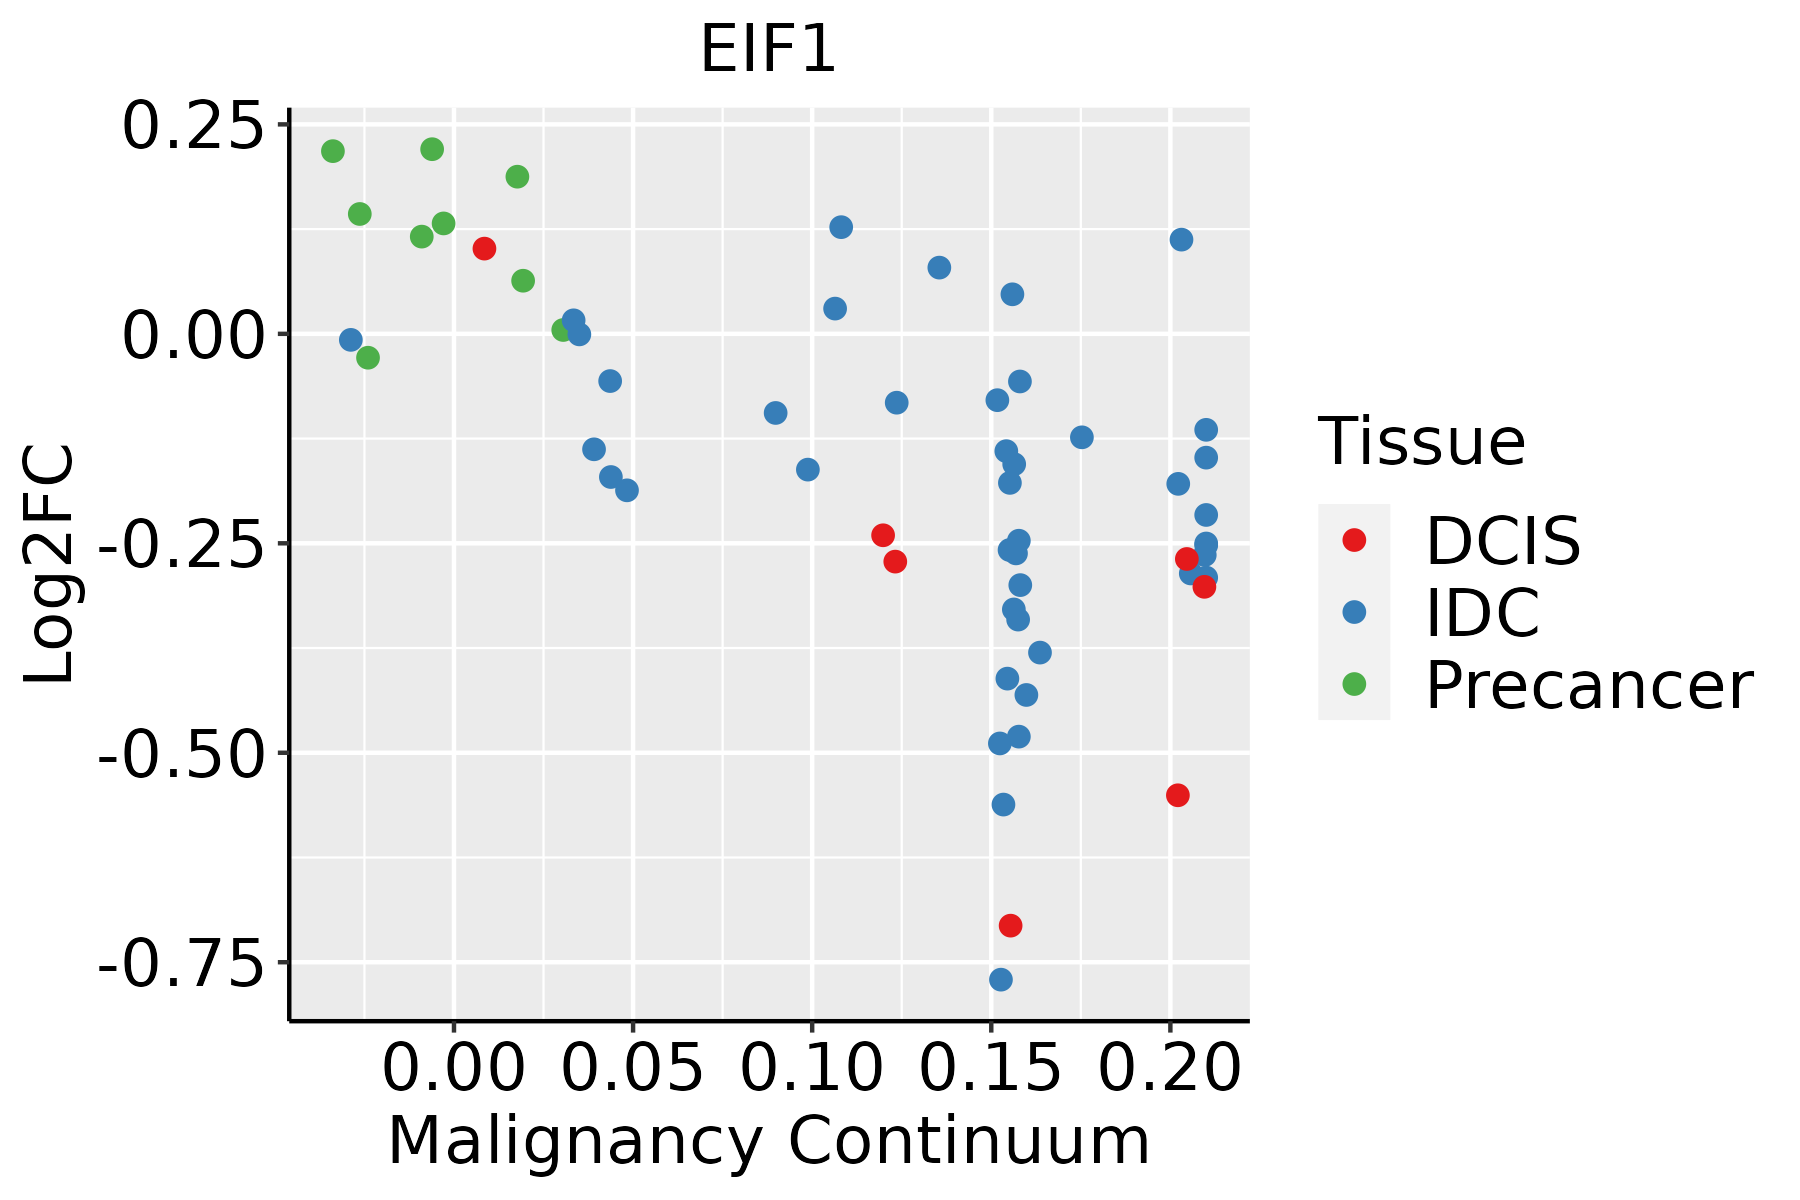 | IDC: Invasive ductal carcinoma |
| DCIS: Ductal carcinoma in situ | ||
| Precancer(BRCA1-mut): Precancerous lesion from BRCA1 mutation carriers | ||
| Cervix |  | CC: Cervix cancer |
| HSIL_HPV: HPV-infected high-grade squamous intraepithelial lesions | ||
| N_HPV: HPV-infected normal cervix | ||
| Colorectum (GSE201348) |  | FAP: Familial adenomatous polyposis |
| CRC: Colorectal cancer | ||
| Colorectum (HTA11) |  | AD: Adenomas |
| SER: Sessile serrated lesions | ||
| MSI-H: Microsatellite-high colorectal cancer | ||
| MSS: Microsatellite stable colorectal cancer | ||
| Endometrium | 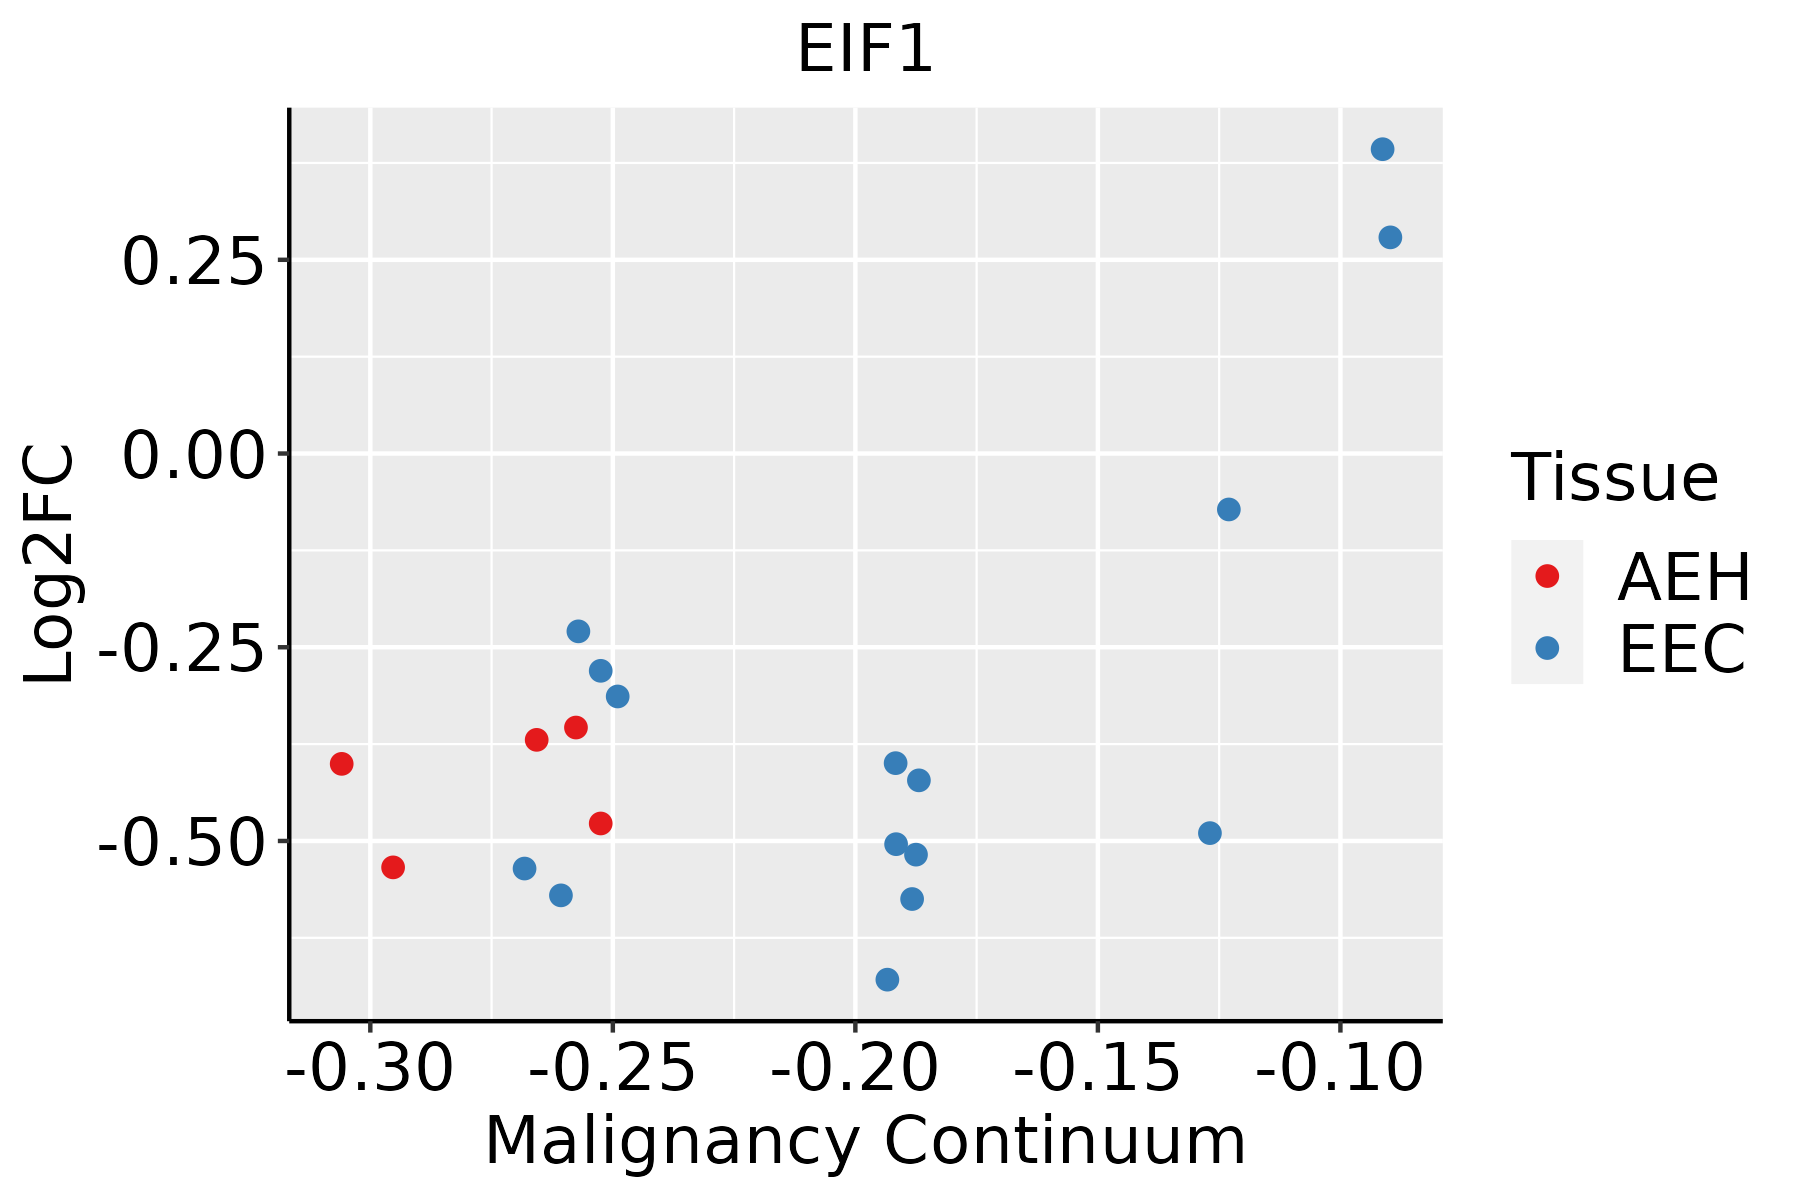 | AEH: Atypical endometrial hyperplasia |
| EEC: Endometrioid Cancer | ||
| Esophagus |  | ESCC: Esophageal squamous cell carcinoma |
| HGIN: High-grade intraepithelial neoplasias | ||
| LGIN: Low-grade intraepithelial neoplasias | ||
| GC |  | CAG: Chronic atrophic gastritis |
| CAG with IM: Chronic atrophic gastritis with intestinal metaplasia | ||
| CSG: Chronic superficial gastritis | ||
| GC: Gastric cancer | ||
| SIM: Severe intestinal metaplasia | ||
| WIM: Wild intestinal metaplasia | ||
| Liver | 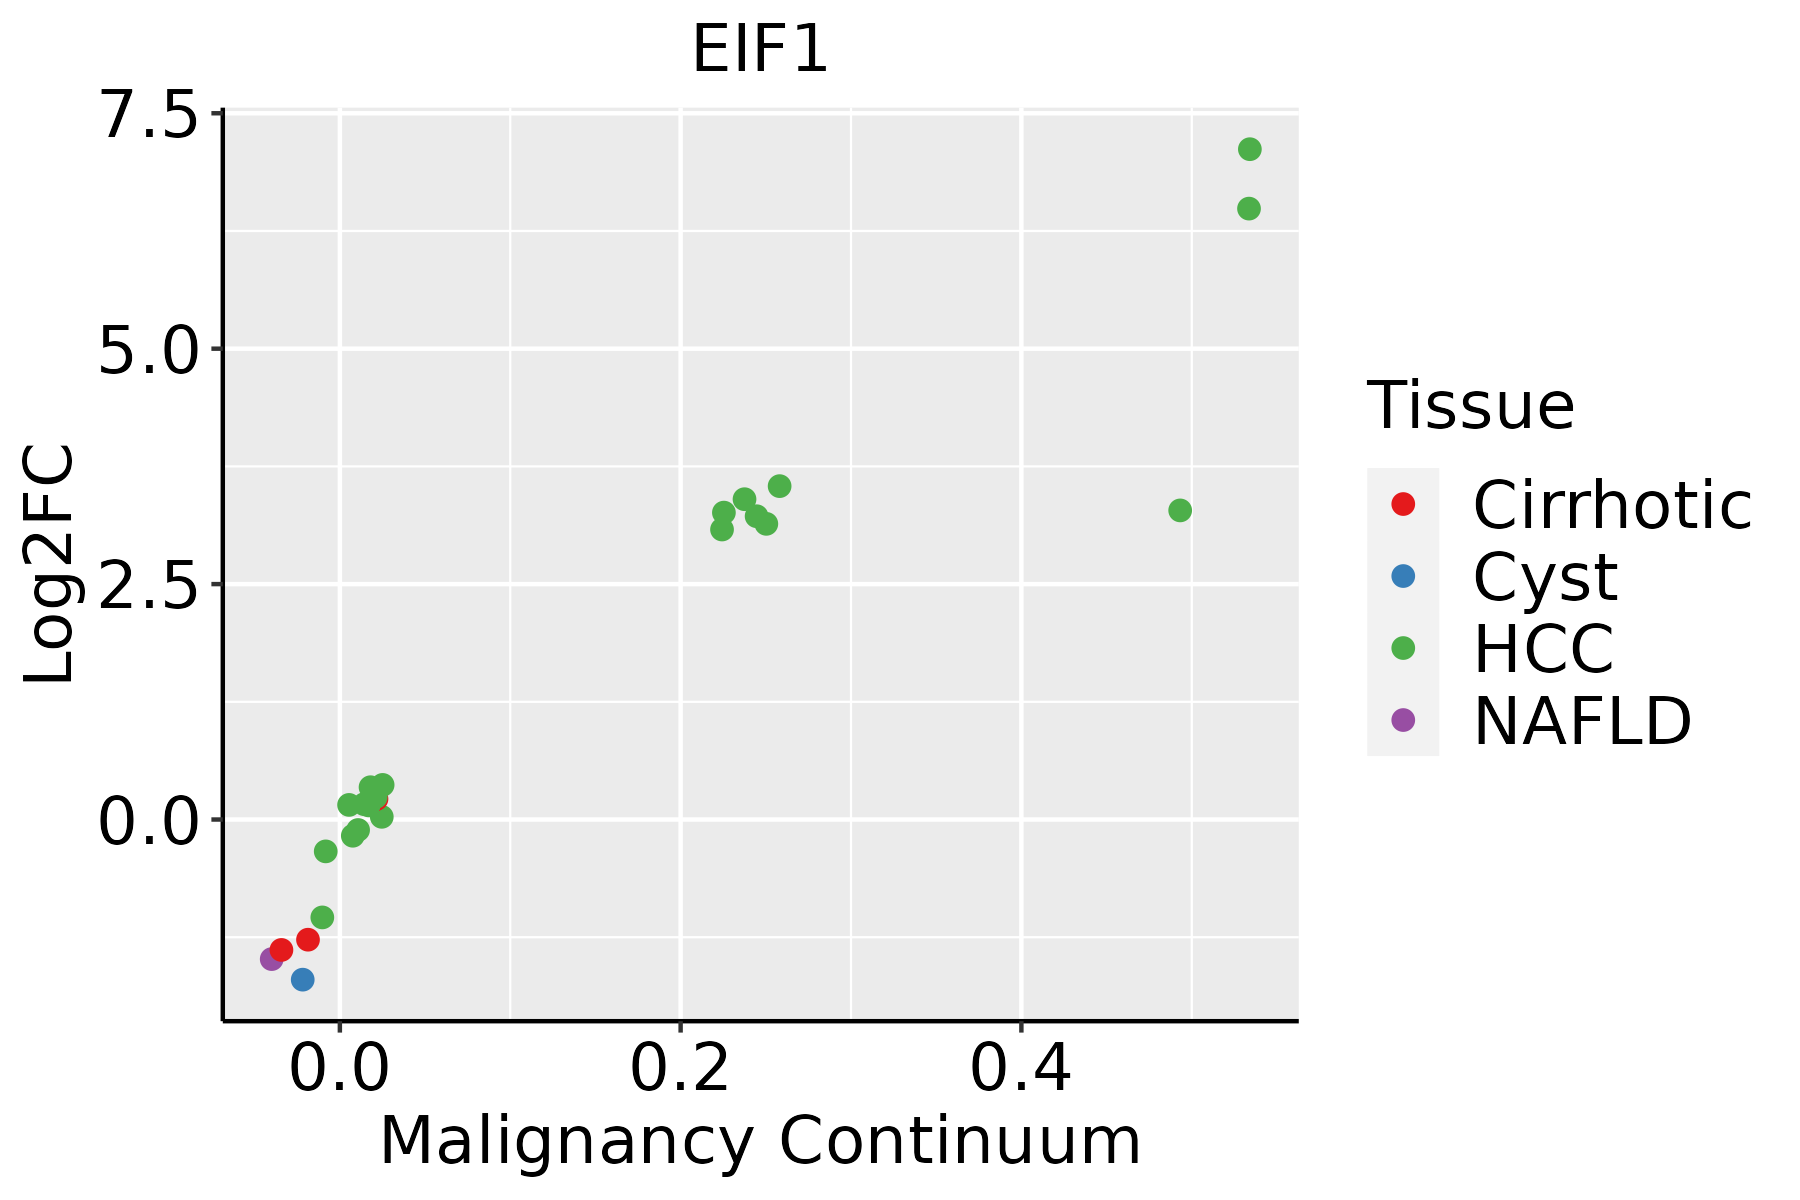 | HCC: Hepatocellular carcinoma |
| NAFLD: Non-alcoholic fatty liver disease | ||
| Lung | 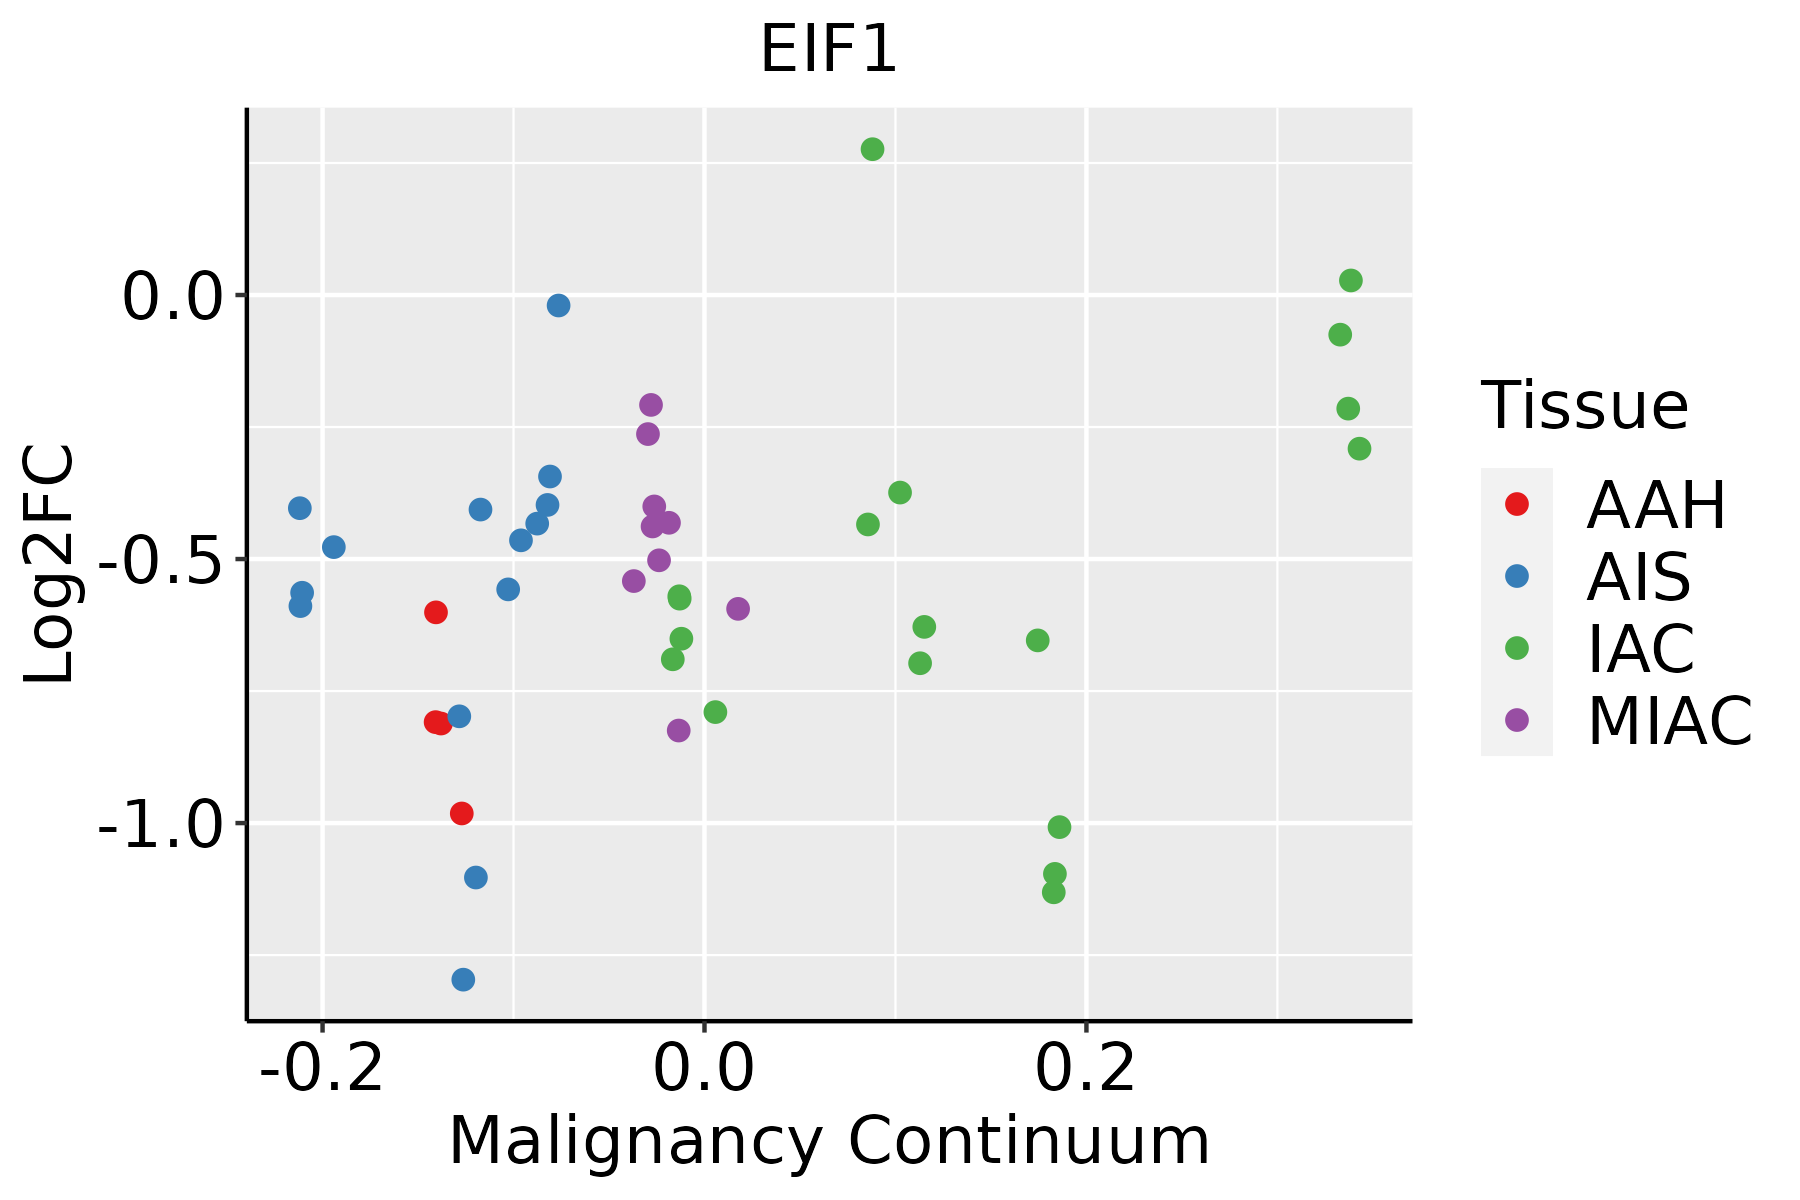 | AAH: Atypical adenomatous hyperplasia |
| AIS: Adenocarcinoma in situ | ||
| IAC: Invasive lung adenocarcinoma | ||
| MIA: Minimally invasive adenocarcinoma | ||
| Oral Cavity |  | EOLP: Erosive Oral lichen planus |
| LP: leukoplakia | ||
| NEOLP: Non-erosive oral lichen planus | ||
| OSCC: Oral squamous cell carcinoma | ||
| Prostate | 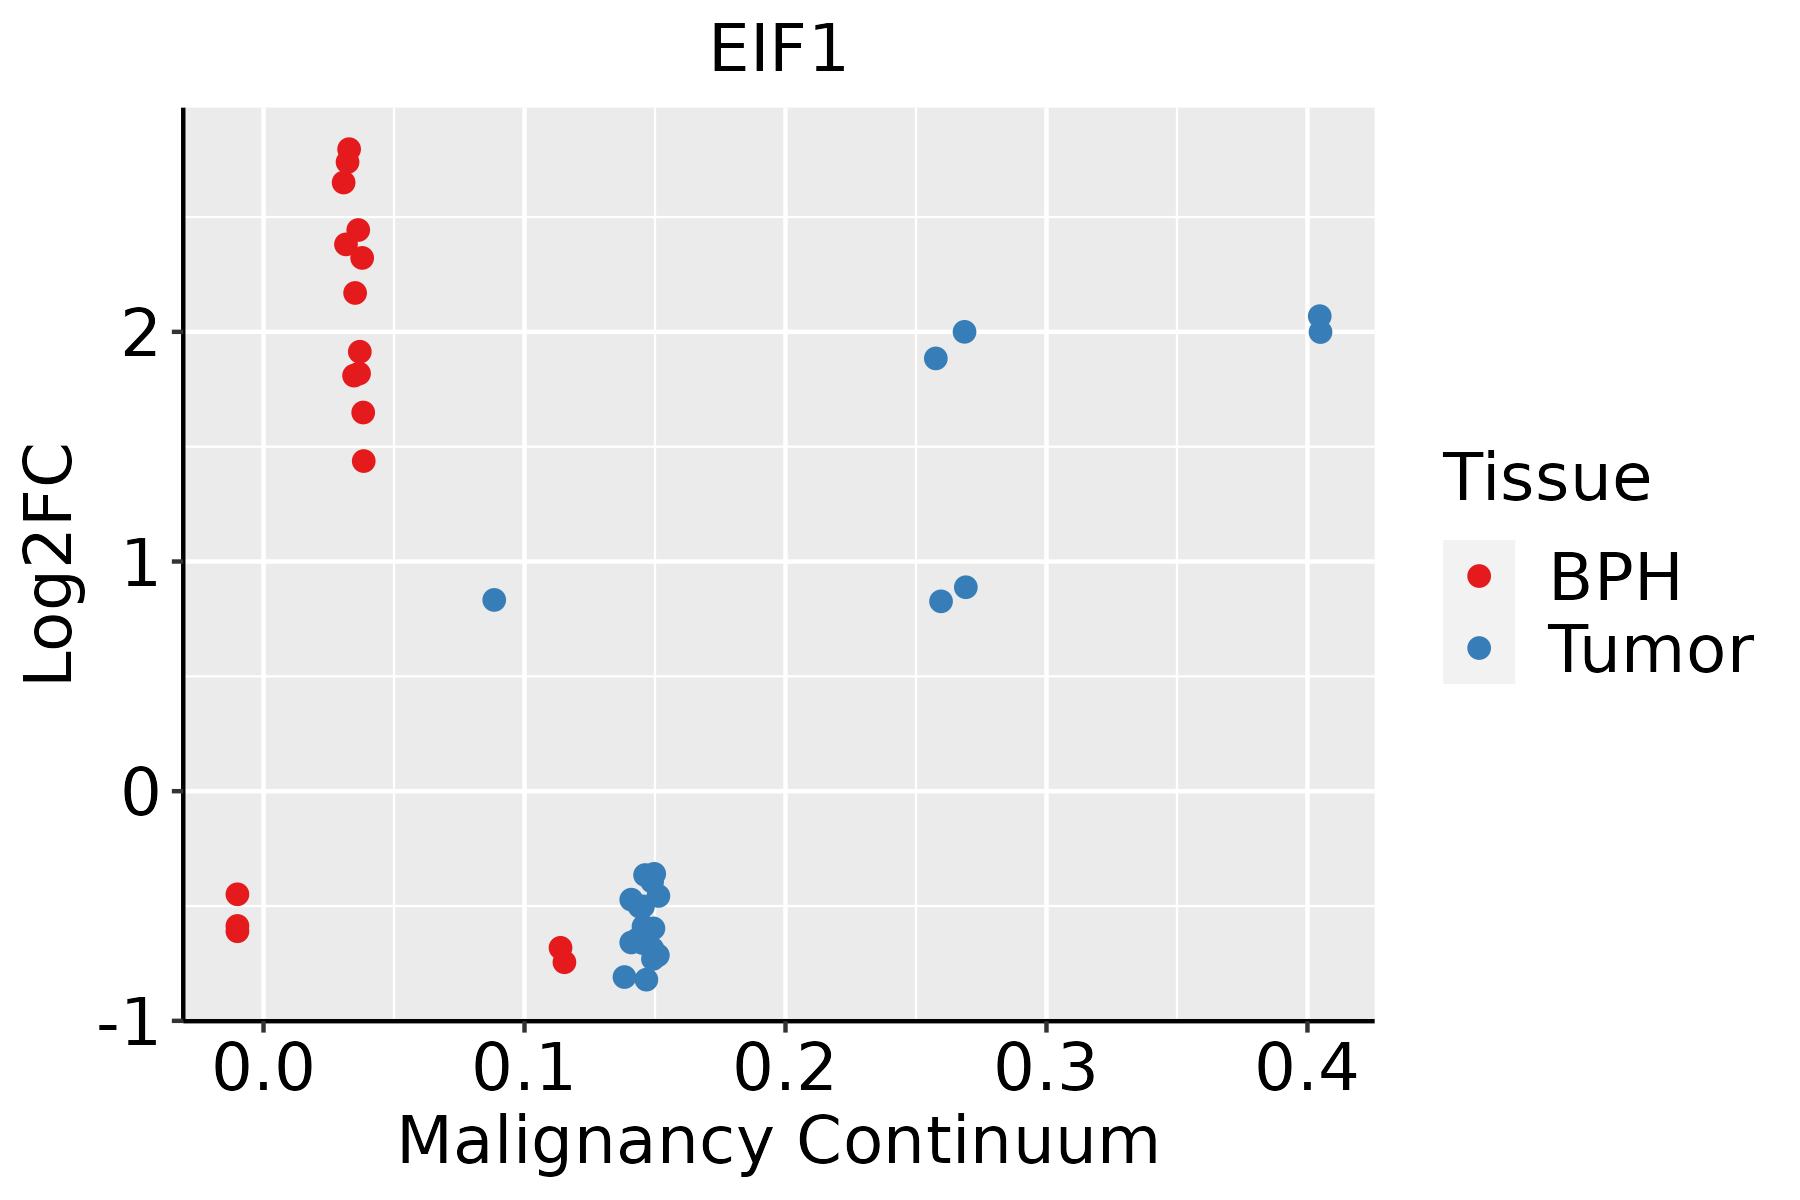 | BPH: Benign Prostatic Hyperplasia |
| Skin | 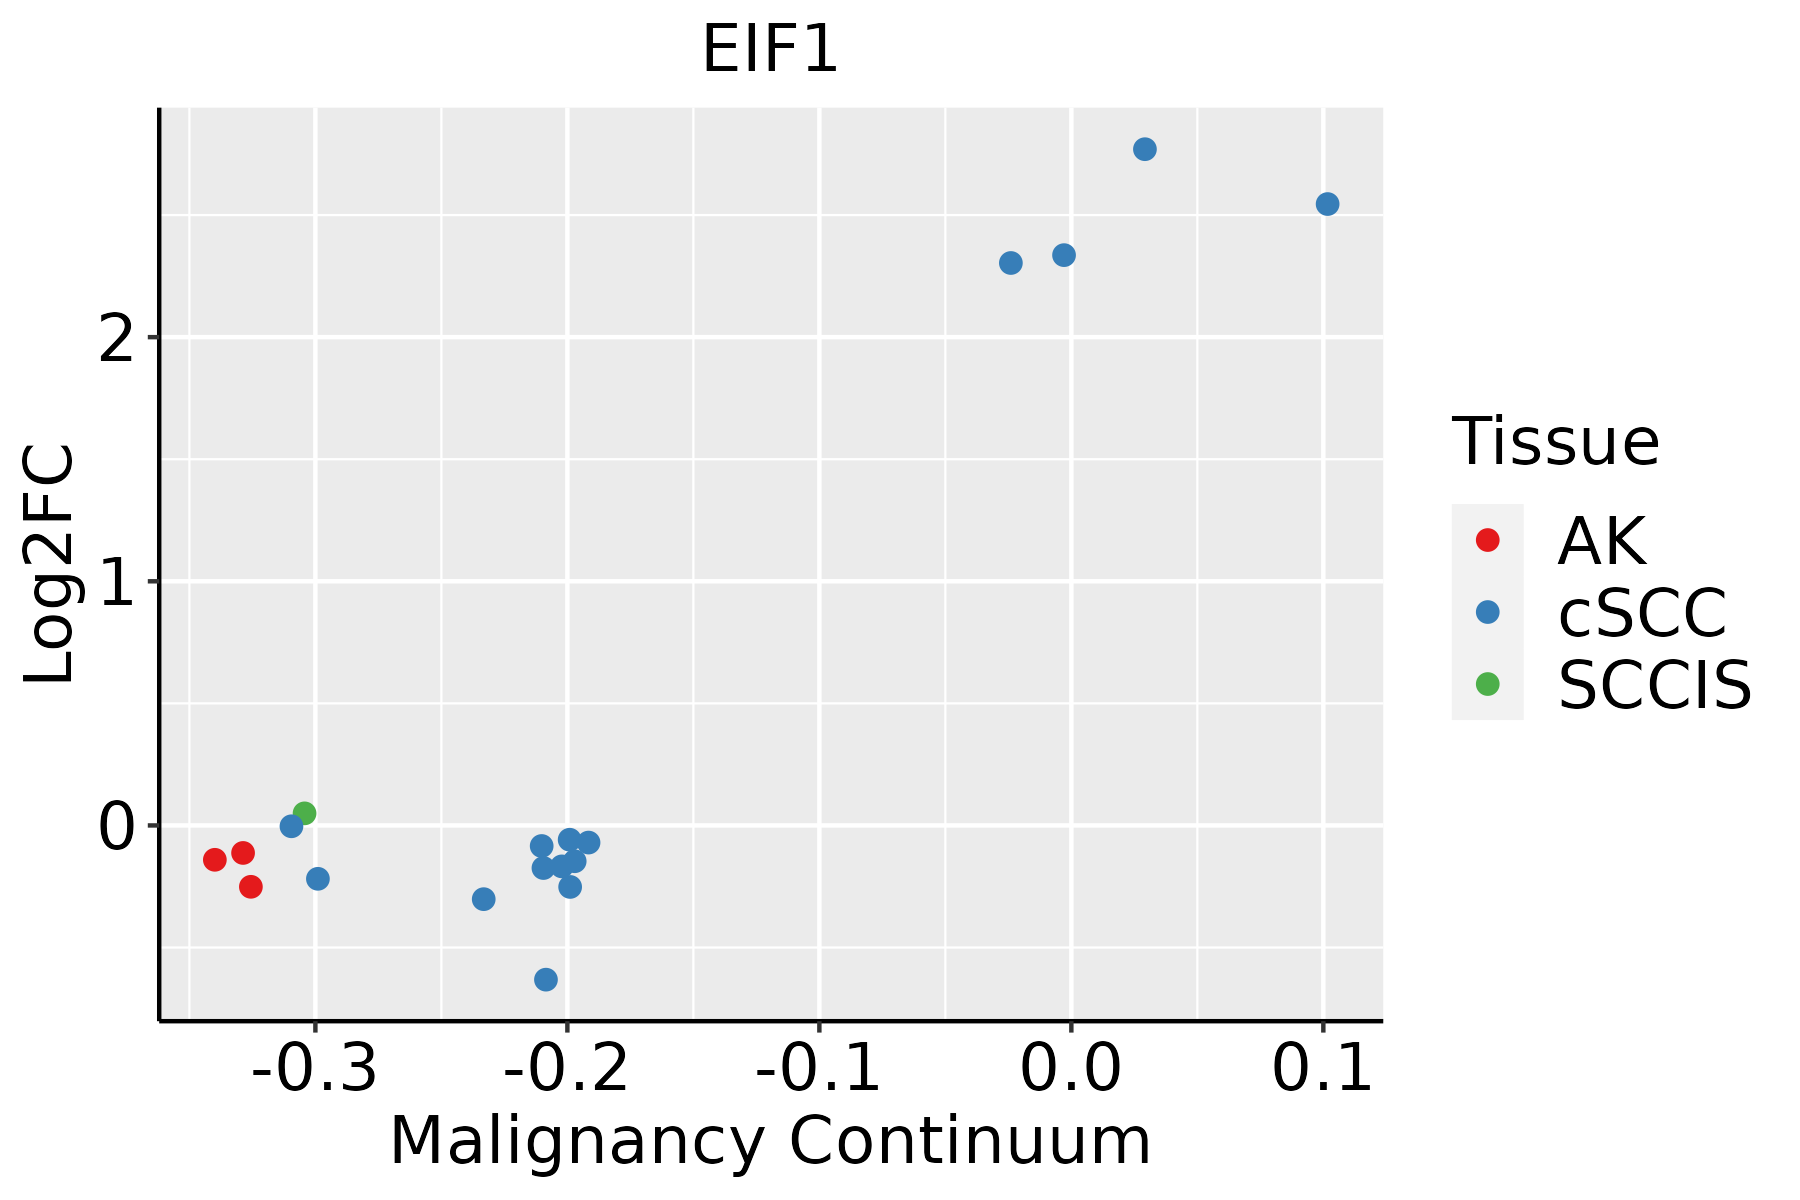 | AK: Actinic keratosis |
| cSCC: Cutaneous squamous cell carcinoma | ||
| SCCIS:squamous cell carcinoma in situ | ||
| Thyroid |  | ATC: Anaplastic thyroid cancer |
| HT: Hashimoto's thyroiditis | ||
| PTC: Papillary thyroid cancer |
| ∗log2FC in expression of this searched gene in stem-like cells from each diseased tissue sample relative to stem-like cells in normal samples in each tissue plotted against the malignancy continuum. Samples are colored based on if they are from different disease stage. |
Top |
Malignant transformation related pathway analysis |
| Find out the enriched GO biological processes and KEGG pathways involved in transition from healthy to precancer to cancer |
| Tissue | Disease Stage | Enriched GO biological Processes |
| Colorectum | AD |  |
| Colorectum | SER |  |
| Colorectum | MSS |  |
| Colorectum | MSI-H |  |
| Colorectum | FAP |  |
| ∗Top 15 enriched GO BP terms are showed in the bar plot of each disease state in each tissue. Each row represents a significant GO biological process which is colored according to the -log10(p.adjust). |
| Page: 1 2 3 4 5 6 7 8 9 |
| GO ID | Tissue | Disease Stage | Description | Gene Ratio | Bg Ratio | pvalue | p.adjust | Count |
| GO:00064138 | Breast | Precancer | translational initiation | 30/1080 | 118/18723 | 3.23e-12 | 5.58e-10 | 30 |
| GO:00064179 | Breast | Precancer | regulation of translation | 67/1080 | 468/18723 | 4.71e-12 | 7.64e-10 | 67 |
| GO:00064466 | Breast | Precancer | regulation of translational initiation | 19/1080 | 79/18723 | 7.99e-08 | 4.60e-06 | 19 |
| GO:000641313 | Breast | IDC | translational initiation | 31/1434 | 118/18723 | 7.29e-10 | 7.52e-08 | 31 |
| GO:000641714 | Breast | IDC | regulation of translation | 74/1434 | 468/18723 | 1.67e-09 | 1.53e-07 | 74 |
| GO:000644613 | Breast | IDC | regulation of translational initiation | 20/1434 | 79/18723 | 1.40e-06 | 6.00e-05 | 20 |
| GO:000641323 | Breast | DCIS | translational initiation | 30/1390 | 118/18723 | 1.53e-09 | 1.43e-07 | 30 |
| GO:000641724 | Breast | DCIS | regulation of translation | 72/1390 | 468/18723 | 2.46e-09 | 2.17e-07 | 72 |
| GO:000644623 | Breast | DCIS | regulation of translational initiation | 19/1390 | 79/18723 | 3.69e-06 | 1.16e-04 | 19 |
| GO:000641710 | Cervix | CC | regulation of translation | 89/2311 | 468/18723 | 1.86e-05 | 3.46e-04 | 89 |
| GO:00064139 | Cervix | CC | translational initiation | 25/2311 | 118/18723 | 4.54e-03 | 2.75e-02 | 25 |
| GO:000641314 | Cervix | HSIL_HPV | translational initiation | 16/737 | 118/18723 | 1.56e-05 | 4.80e-04 | 16 |
| GO:000641715 | Cervix | HSIL_HPV | regulation of translation | 34/737 | 468/18723 | 4.66e-04 | 6.83e-03 | 34 |
| GO:0006417 | Colorectum | AD | regulation of translation | 141/3918 | 468/18723 | 1.32e-06 | 4.22e-05 | 141 |
| GO:0006413 | Colorectum | AD | translational initiation | 45/3918 | 118/18723 | 1.35e-05 | 2.92e-04 | 45 |
| GO:0006446 | Colorectum | AD | regulation of translational initiation | 28/3918 | 79/18723 | 2.02e-03 | 1.63e-02 | 28 |
| GO:00064131 | Colorectum | SER | translational initiation | 36/2897 | 118/18723 | 2.84e-05 | 7.63e-04 | 36 |
| GO:00064171 | Colorectum | SER | regulation of translation | 100/2897 | 468/18723 | 3.76e-04 | 5.74e-03 | 100 |
| GO:00064172 | Colorectum | MSS | regulation of translation | 134/3467 | 468/18723 | 4.43e-08 | 2.38e-06 | 134 |
| GO:00064132 | Colorectum | MSS | translational initiation | 43/3467 | 118/18723 | 3.19e-06 | 9.38e-05 | 43 |
| Page: 1 2 3 4 5 6 |
| Pathway ID | Tissue | Disease Stage | Description | Gene Ratio | Bg Ratio | pvalue | p.adjust | qvalue | Count |
| Page: 1 |
Top |
Cell-cell communication analysis |
| Identification of potential cell-cell interactions between two cell types and their ligand-receptor pairs for different disease states |
| Ligand | Receptor | LRpair | Pathway | Tissue | Disease Stage |
| Page: 1 |
Top |
Single-cell gene regulatory network inference analysis |
| Find out the significant the regulons (TFs) and the target genes of each regulon across cell types for different disease states |
| TF | Cell Type | Tissue | Disease Stage | Target Gene | RSS | Regulon Activity |
| ∗The dot plots of a searched regulon are shown for all cell subpopulations in each disease state of each tissue based on the regulon specific score inferred using pySCENIC and by calculating the average expression. |
| Page: 1 |
Top |
Somatic mutation of malignant transformation related genes |
| Annotation of somatic variants for genes involved in malignant transformation |
| Hugo Symbol | Variant Class | Variant Classification | dbSNP RS | HGVSc | HGVSp | HGVSp Short | SWISSPROT | BIOTYPE | SIFT | PolyPhen | Tumor Sample Barcode | Tissue | Histology | Sex | Age | Stage | Therapy Types | Drugs | Outcome |
| EIF1 | insertion | Frame_Shift_Ins | novel | c.178_179insCTATCCAGAACCTCCACTCTTTCGGTAAGCTA | p.Val60AlafsTer12 | p.V60Afs*12 | P41567 | protein_coding | TCGA-A8-A090-01 | Breast | breast invasive carcinoma | Female | >=65 | I/II | Unknown | Unknown | SD | ||
| EIF1 | SNV | Missense_Mutation | c.101N>T | p.Arg34Ile | p.R34I | P41567 | protein_coding | deleterious(0) | possibly_damaging(0.889) | TCGA-CA-6717-01 | Colorectum | colon adenocarcinoma | Male | <65 | I/II | Chemotherapy | oxaliplatin | CR | |
| EIF1 | SNV | Missense_Mutation | c.224A>G | p.Glu75Gly | p.E75G | P41567 | protein_coding | deleterious(0.02) | possibly_damaging(0.849) | TCGA-CM-5861-01 | Colorectum | colon adenocarcinoma | Female | <65 | I/II | Unknown | Unknown | PD | |
| EIF1 | SNV | Missense_Mutation | novel | c.171N>T | p.Lys57Asn | p.K57N | P41567 | protein_coding | tolerated(0.1) | benign(0.288) | TCGA-F5-6814-01 | Colorectum | rectum adenocarcinoma | Male | <65 | I/II | Unknown | Unknown | SD |
| EIF1 | SNV | Missense_Mutation | c.101N>T | p.Arg34Ile | p.R34I | P41567 | protein_coding | deleterious(0) | possibly_damaging(0.889) | TCGA-AX-A05Z-01 | Endometrium | uterine corpus endometrioid carcinoma | Female | <65 | III/IV | Chemotherapy | adriamycin | SD | |
| EIF1 | SNV | Missense_Mutation | novel | c.62A>G | p.Asp21Gly | p.D21G | P41567 | protein_coding | tolerated(0.12) | benign(0.003) | TCGA-B5-A3FC-01 | Endometrium | uterine corpus endometrioid carcinoma | Female | <65 | I/II | Unknown | Unknown | SD |
| EIF1 | SNV | Missense_Mutation | c.101N>T | p.Arg34Ile | p.R34I | P41567 | protein_coding | deleterious(0) | possibly_damaging(0.889) | TCGA-DF-A2KU-01 | Endometrium | uterine corpus endometrioid carcinoma | Female | Unknown | I/II | Unknown | Unknown | SD | |
| EIF1 | SNV | Missense_Mutation | c.262N>A | p.Asp88Asn | p.D88N | P41567 | protein_coding | deleterious(0.01) | benign(0.229) | TCGA-50-6594-01 | Lung | lung adenocarcinoma | Female | >=65 | III/IV | Unknown | Unknown | PD | |
| EIF1 | SNV | Missense_Mutation | c.61N>T | p.Asp21Tyr | p.D21Y | P41567 | protein_coding | deleterious(0.02) | possibly_damaging(0.838) | TCGA-97-A4M7-01 | Lung | lung adenocarcinoma | Male | >=65 | I/II | Unknown | Unknown | SD | |
| EIF1 | SNV | Missense_Mutation | c.250N>G | p.Gln84Glu | p.Q84E | P41567 | protein_coding | deleterious(0) | possibly_damaging(0.774) | TCGA-85-A4CL-01 | Lung | lung squamous cell carcinoma | Male | >=65 | I/II | Unknown | Unknown | SD |
| Page: 1 2 |
Top |
Related drugs of malignant transformation related genes |
| Identification of chemicals and drugs interact with genes involved in malignant transfromation |
| (DGIdb 4.0) |
| Entrez ID | Symbol | Category | Interaction Types | Drug Claim Name | Drug Name | PMIDs |
| Page: 1 |

Copyright 2023-Present -The University of Texas Health Science Center at Houston |