
|
|||||
|
 | |
| |
| |
| |
| |
| |
|
Gene: EID2 |
Gene summary for EID2 |
| Gene information | Species | Human | Gene symbol | EID2 | Gene ID | 163126 |
| Gene name | EP300 interacting inhibitor of differentiation 2 | |
| Gene Alias | CRI2 | |
| Cytomap | 19q13.2 | |
| Gene Type | protein-coding | GO ID | GO:0000122 | UniProtAcc | Q8N6I1 |
Top |
Malignant transformation analysis |
| Identification of the aberrant gene expression in precancerous and cancerous lesions by comparing the gene expression of stem-like cells in diseased tissues with normal stem cells |
| Entrez ID | Symbol | Replicates | Species | Organ | Tissue | Adj P-value | Log2FC | Malignancy |
| 163126 | EID2 | C04 | Human | Oral cavity | OSCC | 3.50e-05 | 3.95e-01 | 0.2633 |
| 163126 | EID2 | C21 | Human | Oral cavity | OSCC | 1.75e-07 | 1.96e-01 | 0.2678 |
| 163126 | EID2 | C30 | Human | Oral cavity | OSCC | 2.89e-21 | 8.96e-01 | 0.3055 |
| 163126 | EID2 | C43 | Human | Oral cavity | OSCC | 1.02e-07 | 2.05e-01 | 0.1704 |
| 163126 | EID2 | C46 | Human | Oral cavity | OSCC | 1.53e-06 | 1.84e-01 | 0.1673 |
| 163126 | EID2 | C57 | Human | Oral cavity | OSCC | 1.51e-03 | 1.27e-01 | 0.1679 |
| 163126 | EID2 | C08 | Human | Oral cavity | OSCC | 1.04e-06 | 2.72e-01 | 0.1919 |
| 163126 | EID2 | C09 | Human | Oral cavity | OSCC | 4.85e-02 | 7.51e-02 | 0.1431 |
| 163126 | EID2 | LN22 | Human | Oral cavity | OSCC | 2.15e-09 | 1.13e+00 | 0.1733 |
| 163126 | EID2 | LN46 | Human | Oral cavity | OSCC | 7.72e-05 | 2.56e-01 | 0.1666 |
| 163126 | EID2 | SYSMH1 | Human | Oral cavity | OSCC | 2.37e-05 | 1.91e-01 | 0.1127 |
| 163126 | EID2 | SYSMH2 | Human | Oral cavity | OSCC | 1.74e-09 | 3.31e-01 | 0.2326 |
| 163126 | EID2 | SYSMH3 | Human | Oral cavity | OSCC | 1.08e-20 | 5.37e-01 | 0.2442 |
| 163126 | EID2 | male-WTA | Human | Thyroid | PTC | 3.70e-09 | 5.86e-02 | 0.1037 |
| 163126 | EID2 | PTC04 | Human | Thyroid | PTC | 3.12e-06 | 4.91e-02 | 0.1927 |
| 163126 | EID2 | PTC05 | Human | Thyroid | PTC | 1.15e-04 | 2.52e-01 | 0.2065 |
| 163126 | EID2 | PTC06 | Human | Thyroid | PTC | 1.85e-12 | 2.91e-01 | 0.2057 |
| 163126 | EID2 | PTC07 | Human | Thyroid | PTC | 6.32e-19 | 2.33e-01 | 0.2044 |
| 163126 | EID2 | ATC12 | Human | Thyroid | ATC | 1.18e-04 | 1.93e-02 | 0.34 |
| 163126 | EID2 | ATC13 | Human | Thyroid | ATC | 2.60e-56 | 1.68e+00 | 0.34 |
| Page: 1 2 |
| Tissue | Expression Dynamics | Abbreviation |
| Oral Cavity | 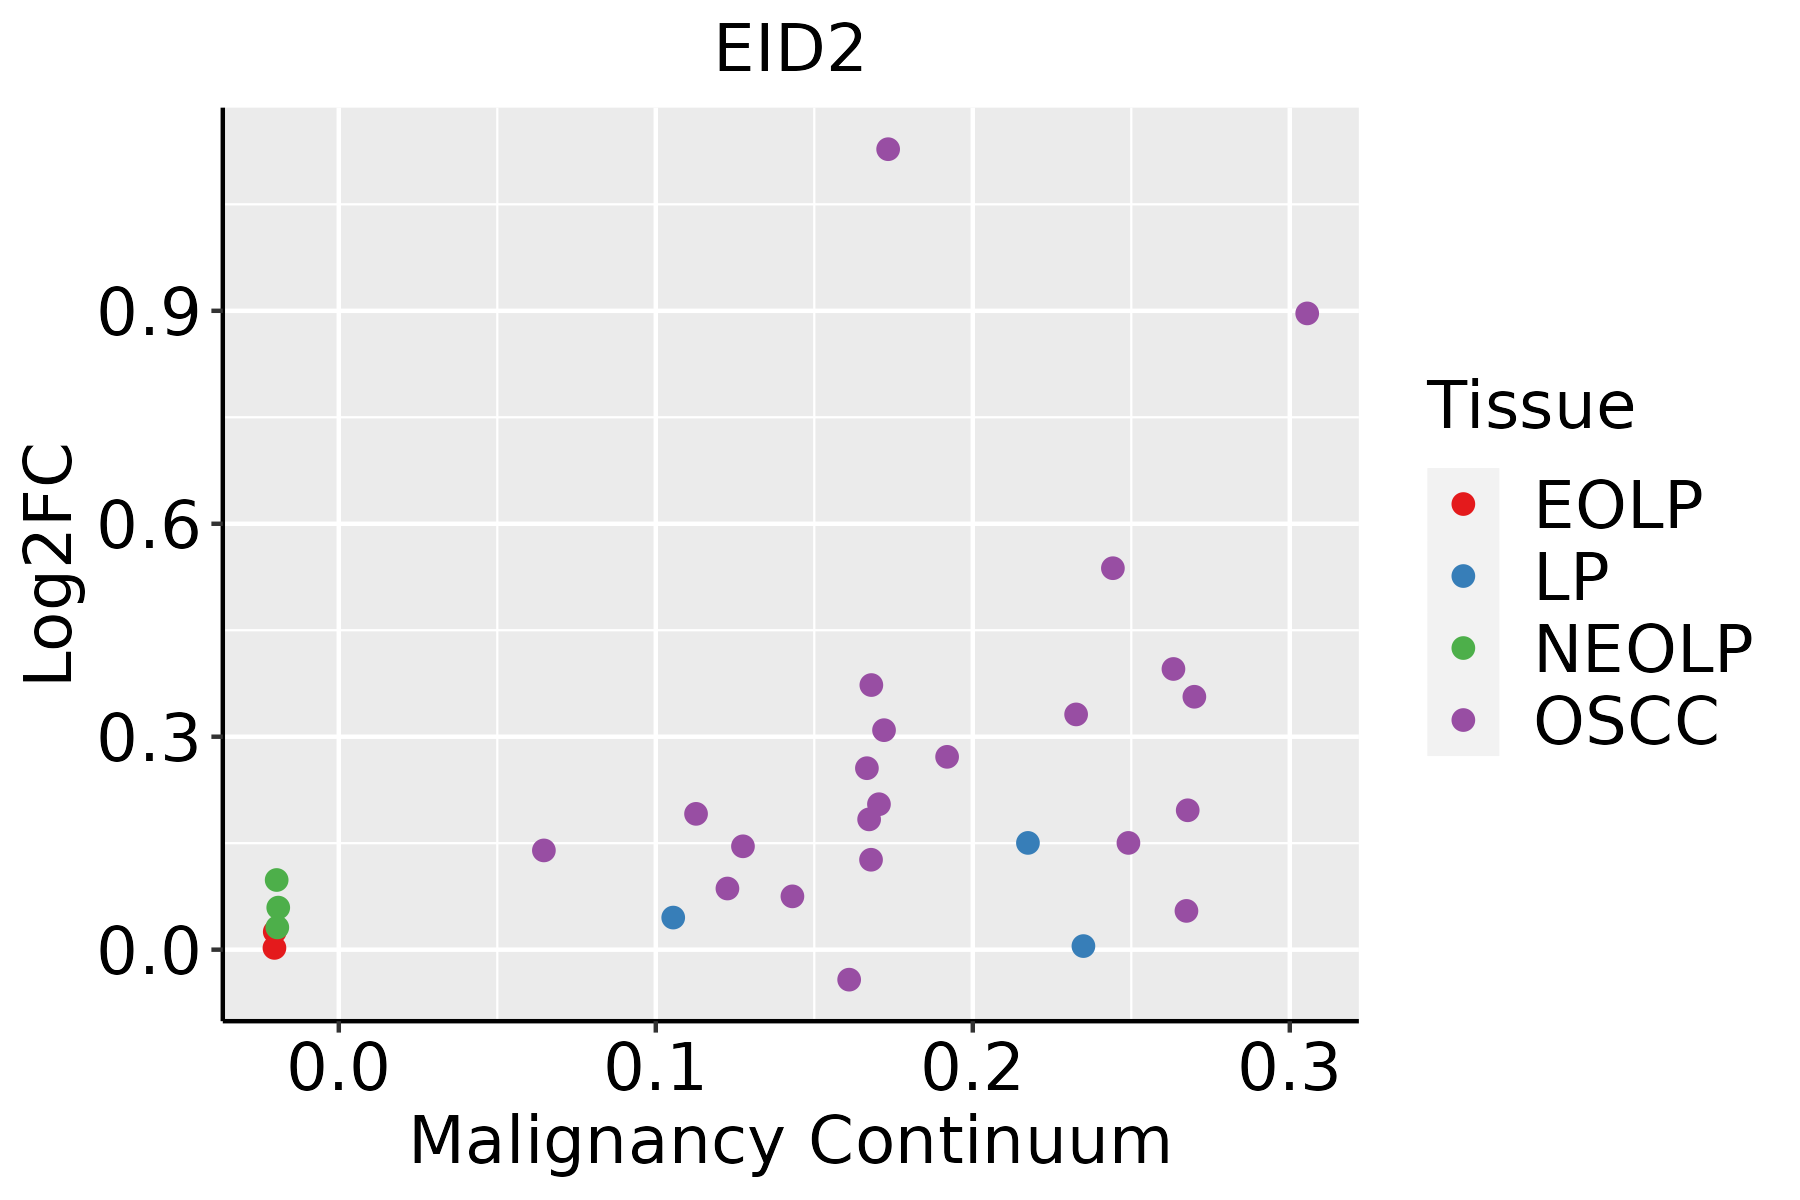 | EOLP: Erosive Oral lichen planus |
| LP: leukoplakia | ||
| NEOLP: Non-erosive oral lichen planus | ||
| OSCC: Oral squamous cell carcinoma | ||
| Thyroid | 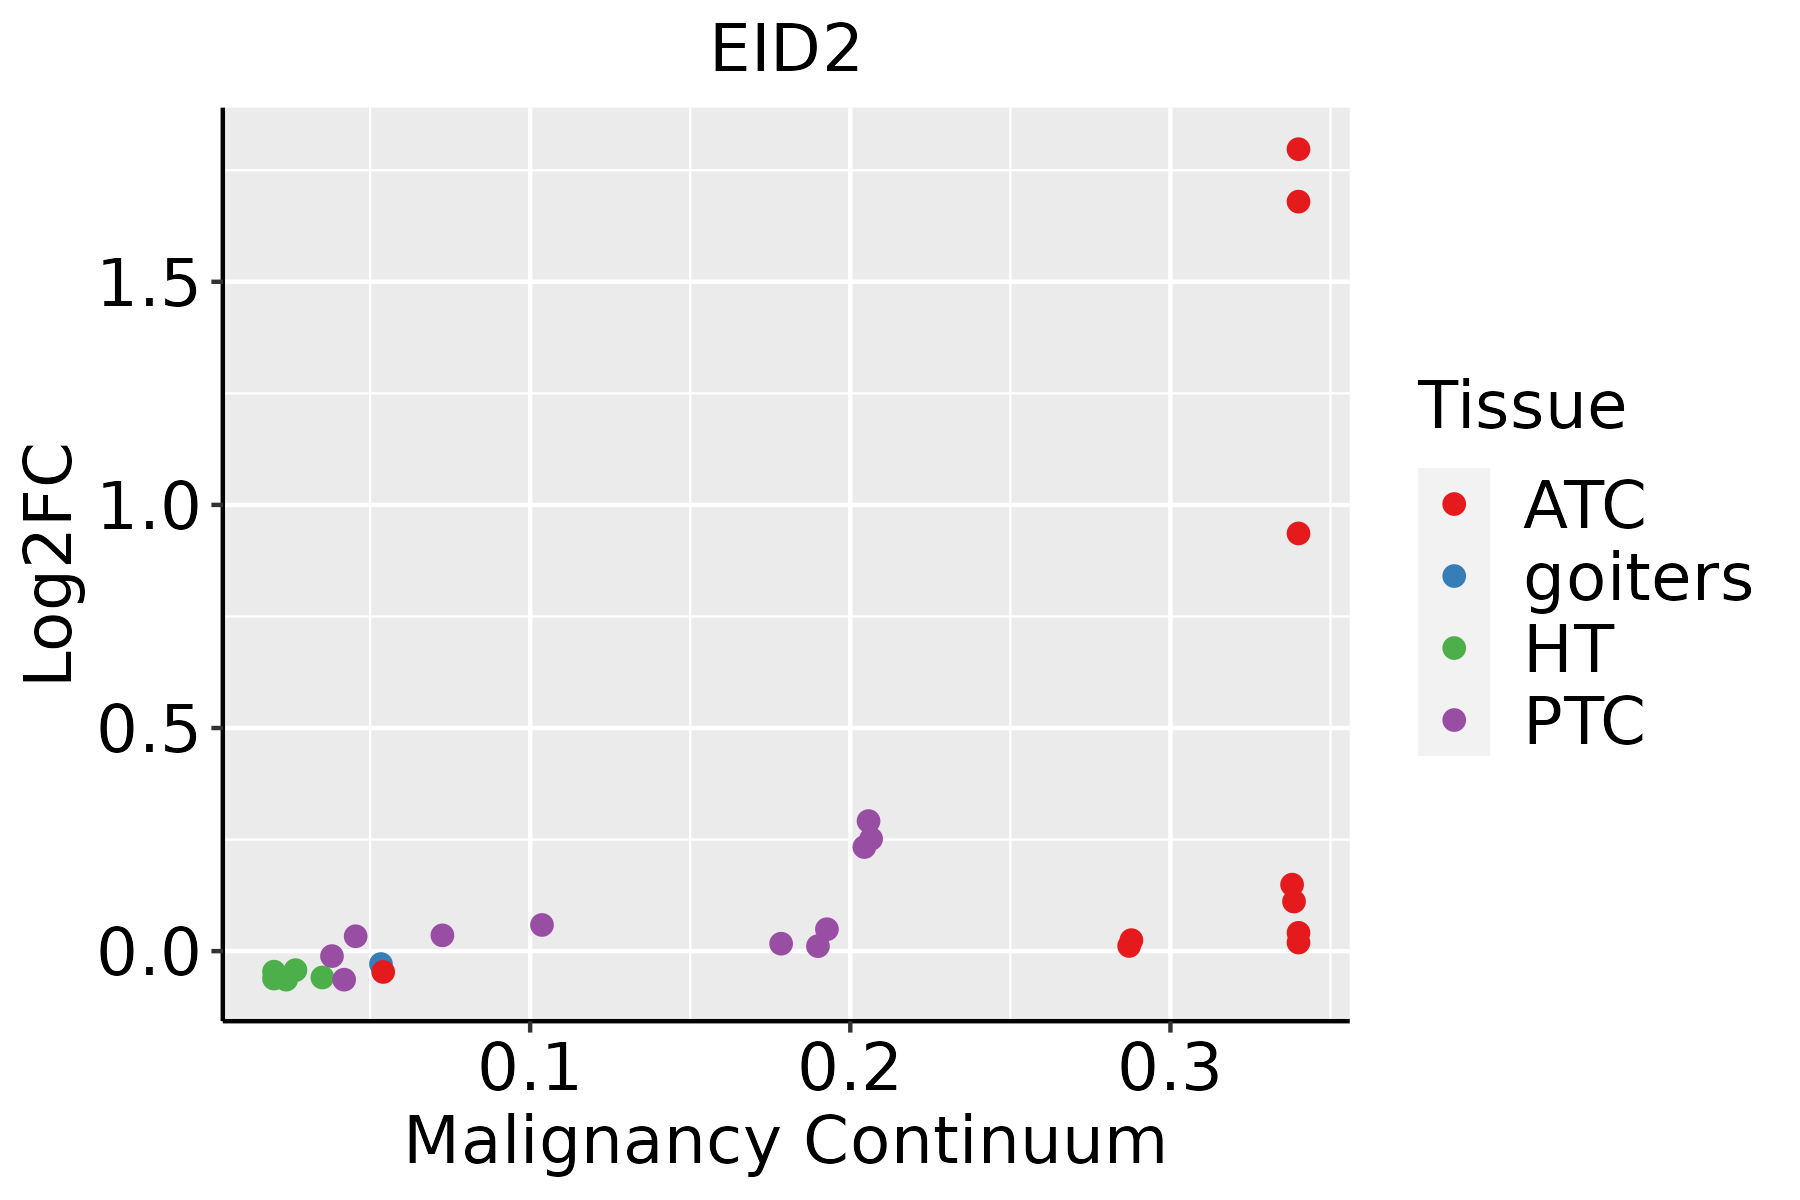 | ATC: Anaplastic thyroid cancer |
| HT: Hashimoto's thyroiditis | ||
| PTC: Papillary thyroid cancer |
| ∗log2FC in expression of this searched gene in stem-like cells from each diseased tissue sample relative to stem-like cells in normal samples in each tissue plotted against the malignancy continuum. Samples are colored based on if they are from different disease stage. |
Top |
Malignant transformation related pathway analysis |
| Find out the enriched GO biological processes and KEGG pathways involved in transition from healthy to precancer to cancer |
| Tissue | Disease Stage | Enriched GO biological Processes |
| Colorectum | AD |  |
| Colorectum | SER |  |
| Colorectum | MSS |  |
| Colorectum | MSI-H |  |
| Colorectum | FAP |  |
| ∗Top 15 enriched GO BP terms are showed in the bar plot of each disease state in each tissue. Each row represents a significant GO biological process which is colored according to the -log10(p.adjust). |
| Page: 1 2 3 4 5 6 7 8 9 |
| GO ID | Tissue | Disease Stage | Description | Gene Ratio | Bg Ratio | pvalue | p.adjust | Count |
| GO:00715598 | Oral cavity | OSCC | response to transforming growth factor beta | 140/7305 | 256/18723 | 2.34e-07 | 3.70e-06 | 140 |
| GO:00715608 | Oral cavity | OSCC | cellular response to transforming growth factor beta stimulus | 137/7305 | 250/18723 | 2.68e-07 | 4.15e-06 | 137 |
| GO:00071798 | Oral cavity | OSCC | transforming growth factor beta receptor signaling pathway | 109/7305 | 198/18723 | 3.21e-06 | 3.86e-05 | 109 |
| GO:00170155 | Oral cavity | OSCC | regulation of transforming growth factor beta receptor signaling pathway | 71/7305 | 128/18723 | 1.14e-04 | 8.34e-04 | 71 |
| GO:19038446 | Oral cavity | OSCC | regulation of cellular response to transforming growth factor beta stimulus | 72/7305 | 131/18723 | 1.51e-04 | 1.06e-03 | 72 |
| GO:00071789 | Oral cavity | OSCC | transmembrane receptor protein serine/threonine kinase signaling pathway | 165/7305 | 355/18723 | 2.31e-03 | 1.02e-02 | 165 |
| GO:00071833 | Oral cavity | OSCC | SMAD protein complex assembly | 10/7305 | 13/18723 | 6.32e-03 | 2.35e-02 | 10 |
| GO:007155919 | Thyroid | PTC | response to transforming growth factor beta | 131/5968 | 256/18723 | 9.20e-11 | 3.17e-09 | 131 |
| GO:007156019 | Thyroid | PTC | cellular response to transforming growth factor beta stimulus | 126/5968 | 250/18723 | 7.34e-10 | 2.19e-08 | 126 |
| GO:000717919 | Thyroid | PTC | transforming growth factor beta receptor signaling pathway | 104/5968 | 198/18723 | 1.20e-09 | 3.47e-08 | 104 |
| GO:001701515 | Thyroid | PTC | regulation of transforming growth factor beta receptor signaling pathway | 69/5968 | 128/18723 | 1.92e-07 | 3.51e-06 | 69 |
| GO:190384415 | Thyroid | PTC | regulation of cellular response to transforming growth factor beta stimulus | 70/5968 | 131/18723 | 2.47e-07 | 4.31e-06 | 70 |
| GO:000717819 | Thyroid | PTC | transmembrane receptor protein serine/threonine kinase signaling pathway | 156/5968 | 355/18723 | 1.02e-06 | 1.51e-05 | 156 |
| GO:00900925 | Thyroid | PTC | regulation of transmembrane receptor protein serine/threonine kinase signaling pathway | 108/5968 | 256/18723 | 3.07e-04 | 2.14e-03 | 108 |
| GO:00305124 | Thyroid | PTC | negative regulation of transforming growth factor beta receptor signaling pathway | 39/5968 | 81/18723 | 1.61e-03 | 8.93e-03 | 39 |
| GO:009028712 | Thyroid | PTC | regulation of cellular response to growth factor stimulus | 120/5968 | 304/18723 | 2.87e-03 | 1.42e-02 | 120 |
| GO:00901013 | Thyroid | PTC | negative regulation of transmembrane receptor protein serine/threonine kinase signaling pathway | 56/5968 | 131/18723 | 5.63e-03 | 2.55e-02 | 56 |
| GO:007155925 | Thyroid | ATC | response to transforming growth factor beta | 142/6293 | 256/18723 | 4.30e-13 | 1.94e-11 | 142 |
| GO:007156026 | Thyroid | ATC | cellular response to transforming growth factor beta stimulus | 137/6293 | 250/18723 | 3.69e-12 | 1.49e-10 | 137 |
| GO:000717924 | Thyroid | ATC | transforming growth factor beta receptor signaling pathway | 112/6293 | 198/18723 | 2.42e-11 | 8.44e-10 | 112 |
| Page: 1 2 |
| Pathway ID | Tissue | Disease Stage | Description | Gene Ratio | Bg Ratio | pvalue | p.adjust | qvalue | Count |
| Page: 1 |
Top |
Cell-cell communication analysis |
| Identification of potential cell-cell interactions between two cell types and their ligand-receptor pairs for different disease states |
| Ligand | Receptor | LRpair | Pathway | Tissue | Disease Stage |
| Page: 1 |
Top |
Single-cell gene regulatory network inference analysis |
| Find out the significant the regulons (TFs) and the target genes of each regulon across cell types for different disease states |
| TF | Cell Type | Tissue | Disease Stage | Target Gene | RSS | Regulon Activity |
| ∗The dot plots of a searched regulon are shown for all cell subpopulations in each disease state of each tissue based on the regulon specific score inferred using pySCENIC and by calculating the average expression. |
| Page: 1 |
Top |
Somatic mutation of malignant transformation related genes |
| Annotation of somatic variants for genes involved in malignant transformation |
| Hugo Symbol | Variant Class | Variant Classification | dbSNP RS | HGVSc | HGVSp | HGVSp Short | SWISSPROT | BIOTYPE | SIFT | PolyPhen | Tumor Sample Barcode | Tissue | Histology | Sex | Age | Stage | Therapy Types | Drugs | Outcome |
| EID2 | insertion | Frame_Shift_Ins | novel | c.323_324insTTTGTGTTTTCTTAGG | p.Ala109LeufsTer44 | p.A109Lfs*44 | Q8N6I1 | protein_coding | TCGA-A8-A090-01 | Breast | breast invasive carcinoma | Female | >=65 | I/II | Unknown | Unknown | SD | ||
| EID2 | insertion | Nonsense_Mutation | novel | c.351_352insTGAAGTTATCAACCCTCT | p.Asp117_Glu118insTer | p.D117_E118ins* | Q8N6I1 | protein_coding | TCGA-AQ-A04J-01 | Breast | breast invasive carcinoma | Female | <65 | I/II | Chemotherapy | cytoxan | SD | ||
| EID2 | SNV | Missense_Mutation | novel | c.407N>T | p.Ala136Val | p.A136V | Q8N6I1 | protein_coding | deleterious(0.02) | possibly_damaging(0.805) | TCGA-2W-A8YY-01 | Cervix | cervical & endocervical cancer | Female | <65 | I/II | Chemotherapy | cisplatin | CR |
| EID2 | SNV | Missense_Mutation | novel | c.660N>G | p.Ile220Met | p.I220M | Q8N6I1 | protein_coding | tolerated(0.06) | probably_damaging(0.997) | TCGA-JX-A3Q0-01 | Cervix | cervical & endocervical cancer | Female | <65 | III/IV | Unknown | Unknown | SD |
| EID2 | SNV | Missense_Mutation | c.317N>T | p.Ala106Val | p.A106V | Q8N6I1 | protein_coding | deleterious(0.01) | probably_damaging(0.994) | TCGA-AA-3715-01 | Colorectum | colon adenocarcinoma | Male | >=65 | I/II | Unknown | Unknown | PD | |
| EID2 | SNV | Missense_Mutation | novel | c.621T>G | p.Ile207Met | p.I207M | Q8N6I1 | protein_coding | tolerated(0.05) | benign(0.316) | TCGA-F5-6814-01 | Colorectum | rectum adenocarcinoma | Male | <65 | I/II | Unknown | Unknown | SD |
| EID2 | SNV | Missense_Mutation | novel | c.610G>T | p.Asp204Tyr | p.D204Y | Q8N6I1 | protein_coding | tolerated(0.06) | probably_damaging(0.998) | TCGA-A5-A0G2-01 | Endometrium | uterine corpus endometrioid carcinoma | Female | <65 | III/IV | Unknown | Unknown | SD |
| EID2 | SNV | Missense_Mutation | novel | c.647C>A | p.Ala216Asp | p.A216D | Q8N6I1 | protein_coding | deleterious(0) | probably_damaging(0.998) | TCGA-B5-A3FA-01 | Endometrium | uterine corpus endometrioid carcinoma | Female | >=65 | I/II | Unknown | Unknown | SD |
| EID2 | SNV | Missense_Mutation | c.469N>A | p.Leu157Ile | p.L157I | Q8N6I1 | protein_coding | deleterious(0.04) | benign(0.059) | TCGA-D1-A16X-01 | Endometrium | uterine corpus endometrioid carcinoma | Female | <65 | I/II | Unknown | Unknown | SD | |
| EID2 | SNV | Missense_Mutation | c.469C>A | p.Leu157Ile | p.L157I | Q8N6I1 | protein_coding | deleterious(0.04) | benign(0.059) | TCGA-EO-A3AY-01 | Endometrium | uterine corpus endometrioid carcinoma | Female | <65 | I/II | Unknown | Unknown | PD |
| Page: 1 2 |
Top |
Related drugs of malignant transformation related genes |
| Identification of chemicals and drugs interact with genes involved in malignant transfromation |
| (DGIdb 4.0) |
| Entrez ID | Symbol | Category | Interaction Types | Drug Claim Name | Drug Name | PMIDs |
| Page: 1 |

Copyright 2023-Present -The University of Texas Health Science Center at Houston |