
|
|||||
|
 | |
| |
| |
| |
| |
| |
|
Gene: EID1 |
Gene summary for EID1 |
| Gene information | Species | Human | Gene symbol | EID1 | Gene ID | 23741 |
| Gene name | EP300 interacting inhibitor of differentiation 1 | |
| Gene Alias | C15orf3 | |
| Cytomap | 15q21.1 | |
| Gene Type | protein-coding | GO ID | GO:0000122 | UniProtAcc | Q9Y6B2 |
Top |
Malignant transformation analysis |
| Identification of the aberrant gene expression in precancerous and cancerous lesions by comparing the gene expression of stem-like cells in diseased tissues with normal stem cells |
| Entrez ID | Symbol | Replicates | Species | Organ | Tissue | Adj P-value | Log2FC | Malignancy |
| 23741 | EID1 | GSM4909281 | Human | Breast | IDC | 6.10e-23 | -5.32e-01 | 0.21 |
| 23741 | EID1 | GSM4909282 | Human | Breast | IDC | 4.23e-07 | 3.13e-01 | -0.0288 |
| 23741 | EID1 | GSM4909285 | Human | Breast | IDC | 4.21e-11 | 2.76e-01 | 0.21 |
| 23741 | EID1 | GSM4909286 | Human | Breast | IDC | 1.63e-27 | -5.43e-01 | 0.1081 |
| 23741 | EID1 | GSM4909290 | Human | Breast | IDC | 2.61e-03 | 3.34e-01 | 0.2096 |
| 23741 | EID1 | GSM4909296 | Human | Breast | IDC | 7.84e-06 | -2.60e-01 | 0.1524 |
| 23741 | EID1 | GSM4909297 | Human | Breast | IDC | 2.02e-24 | 2.93e-01 | 0.1517 |
| 23741 | EID1 | GSM4909299 | Human | Breast | IDC | 1.31e-06 | 3.26e-01 | 0.035 |
| 23741 | EID1 | GSM4909301 | Human | Breast | IDC | 4.82e-02 | 2.26e-01 | 0.1577 |
| 23741 | EID1 | GSM4909305 | Human | Breast | IDC | 4.23e-03 | 3.05e-01 | 0.0436 |
| 23741 | EID1 | GSM4909307 | Human | Breast | IDC | 6.13e-15 | 4.70e-01 | 0.1569 |
| 23741 | EID1 | GSM4909308 | Human | Breast | IDC | 3.63e-35 | 6.99e-01 | 0.158 |
| 23741 | EID1 | GSM4909311 | Human | Breast | IDC | 1.91e-24 | -3.31e-01 | 0.1534 |
| 23741 | EID1 | GSM4909312 | Human | Breast | IDC | 5.89e-11 | -1.69e-01 | 0.1552 |
| 23741 | EID1 | GSM4909319 | Human | Breast | IDC | 2.08e-36 | -2.62e-01 | 0.1563 |
| 23741 | EID1 | GSM4909320 | Human | Breast | IDC | 5.48e-06 | -4.22e-01 | 0.1575 |
| 23741 | EID1 | GSM4909321 | Human | Breast | IDC | 1.06e-13 | 2.40e-02 | 0.1559 |
| 23741 | EID1 | brca2 | Human | Breast | Precancer | 4.09e-04 | 1.80e-01 | -0.024 |
| 23741 | EID1 | M2 | Human | Breast | IDC | 5.42e-03 | 1.80e-01 | 0.21 |
| 23741 | EID1 | NCCBC14 | Human | Breast | DCIS | 1.73e-13 | 2.84e-01 | 0.2021 |
| Page: 1 2 3 4 5 6 7 8 9 10 11 12 |
| Tissue | Expression Dynamics | Abbreviation |
| Breast | 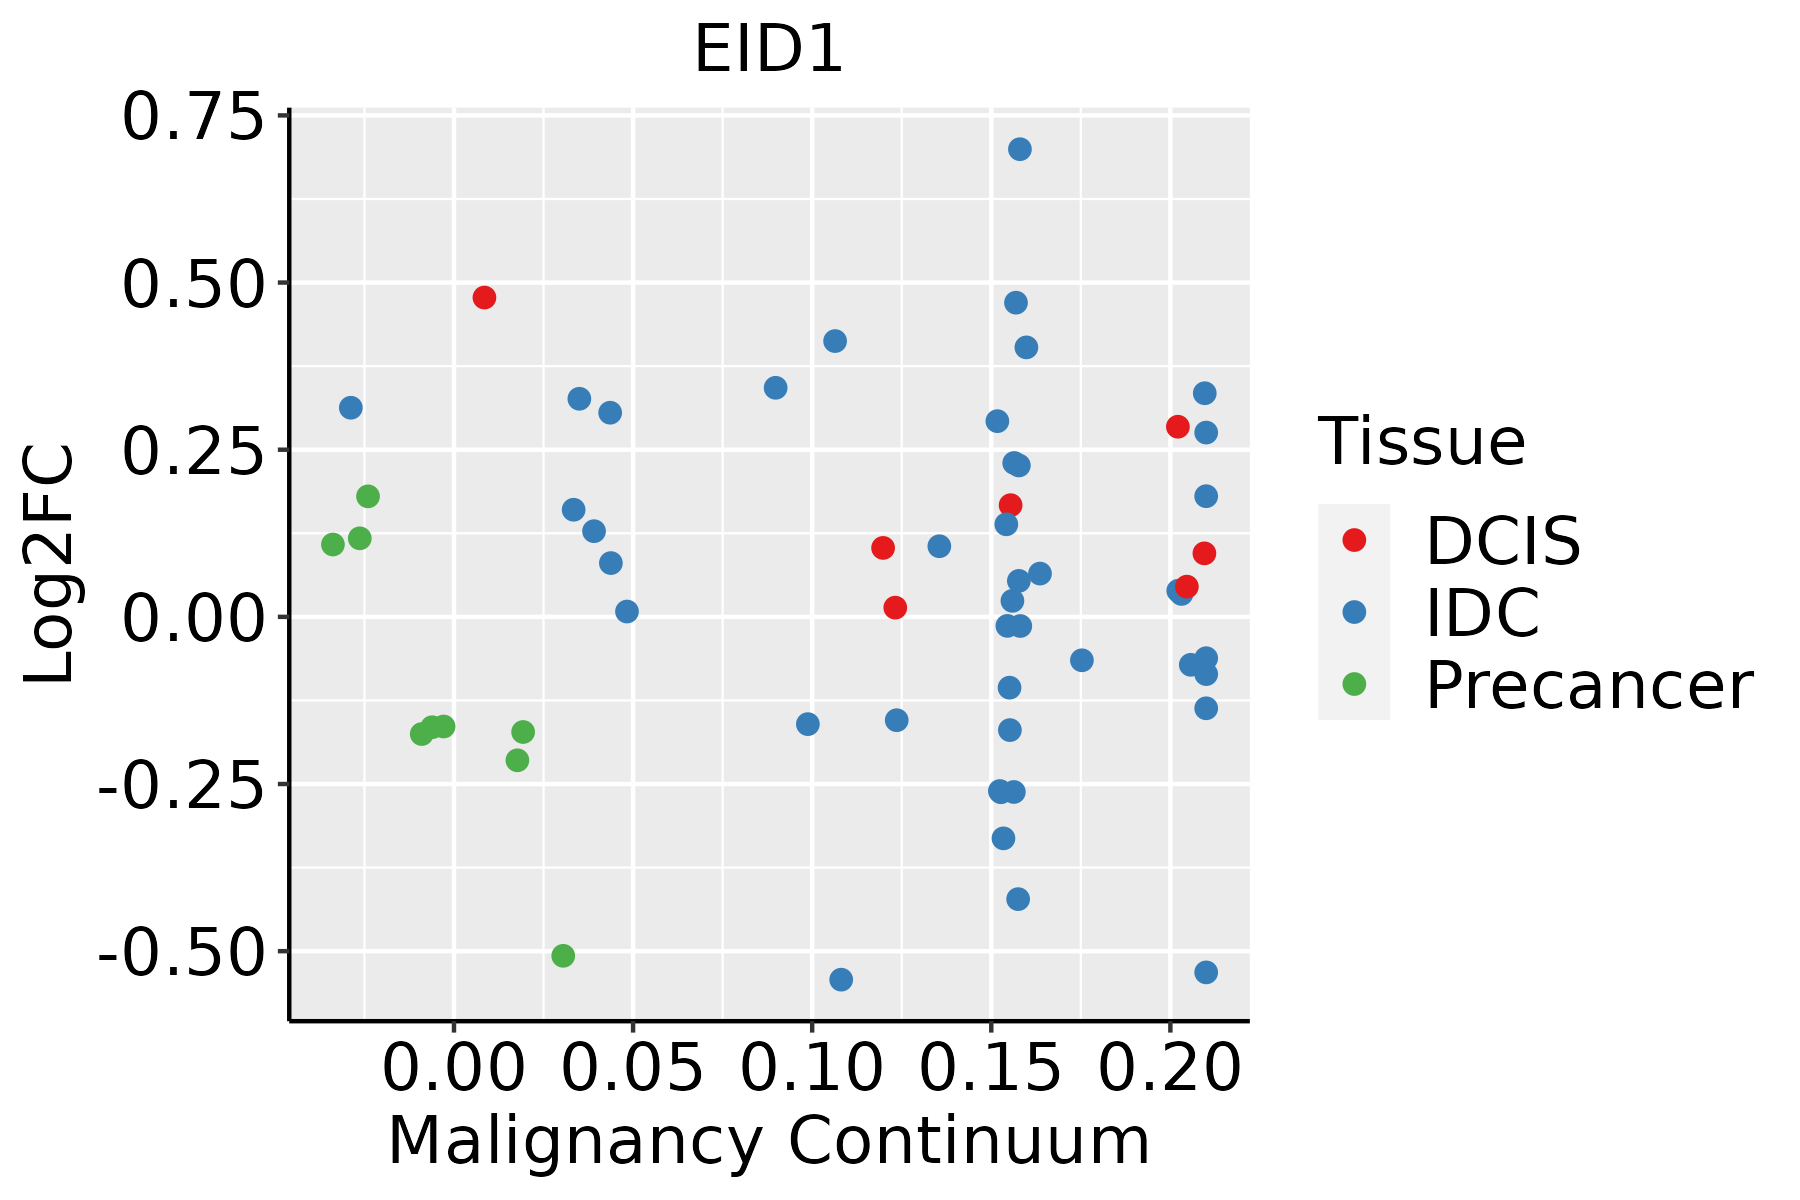 | IDC: Invasive ductal carcinoma |
| DCIS: Ductal carcinoma in situ | ||
| Precancer(BRCA1-mut): Precancerous lesion from BRCA1 mutation carriers | ||
| Cervix | 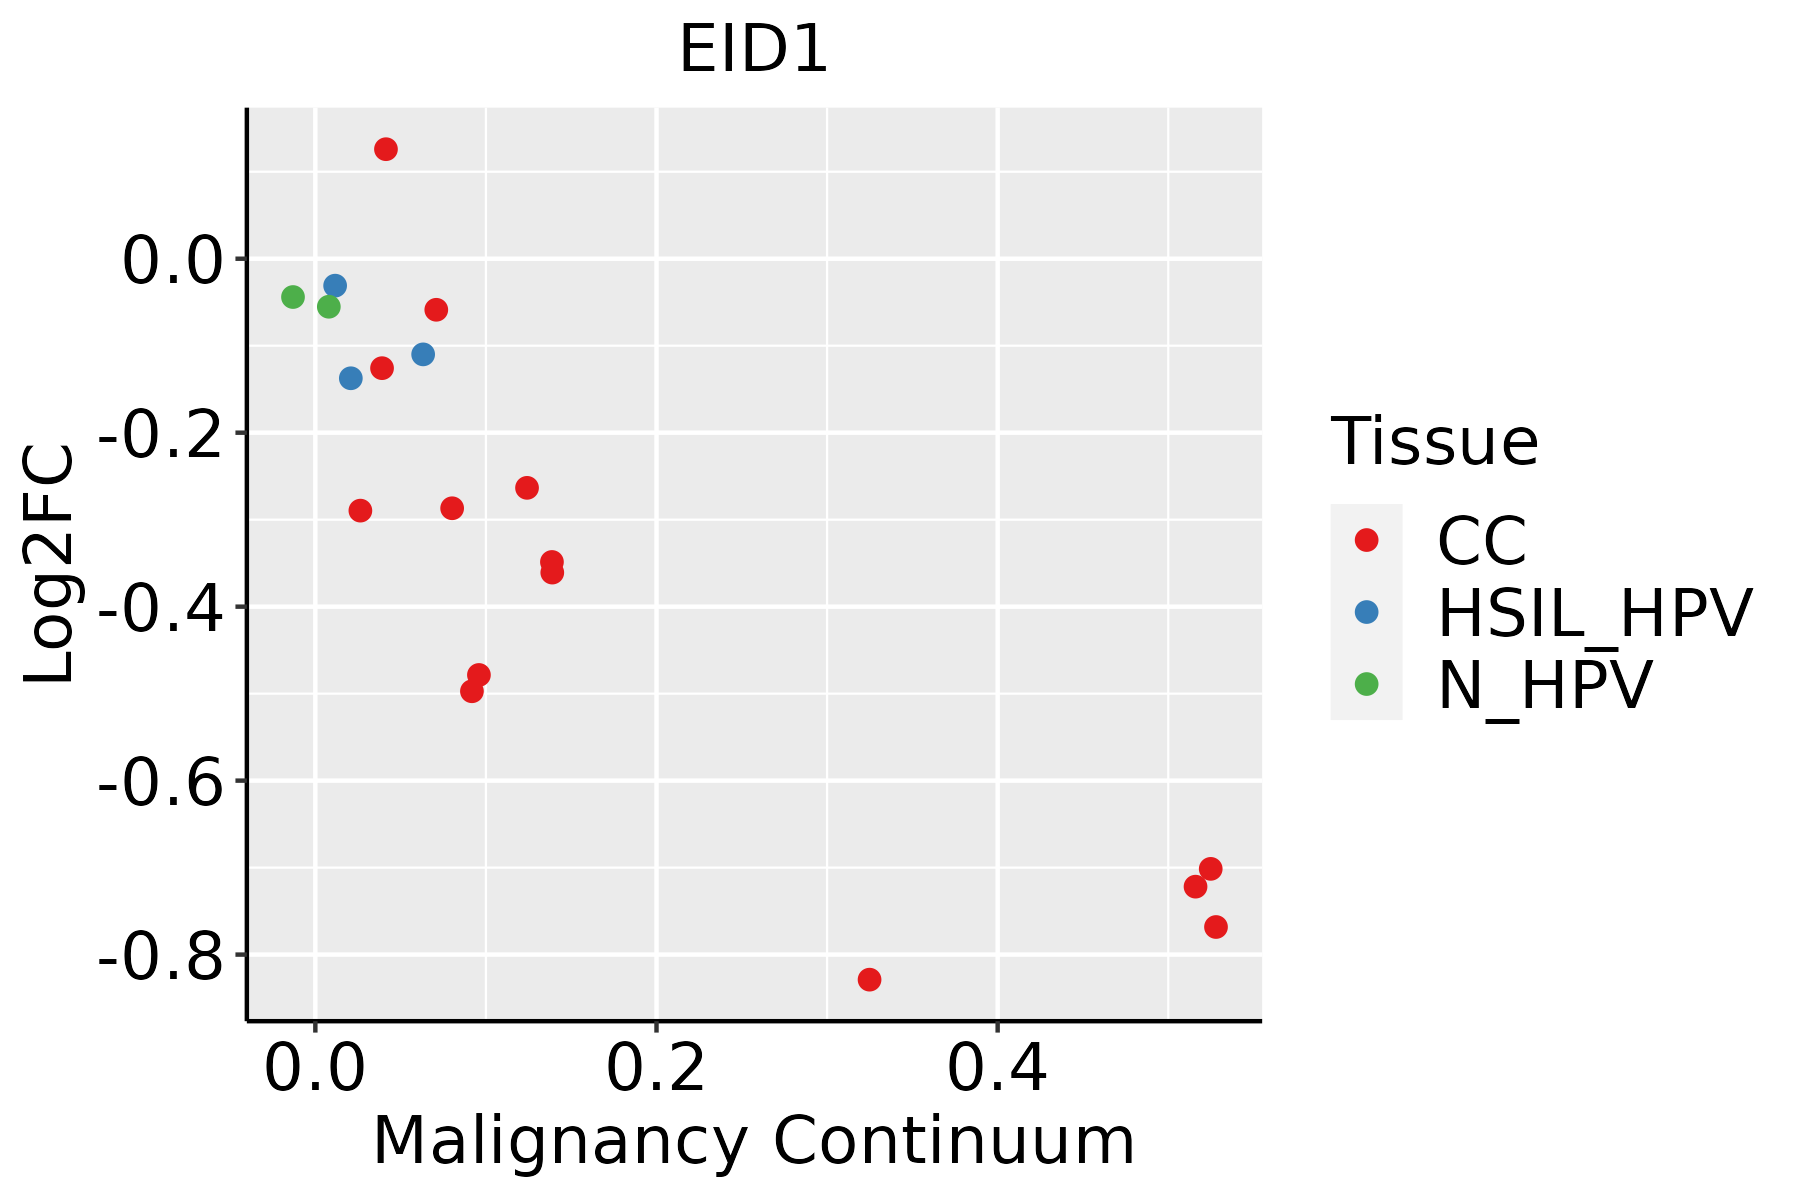 | CC: Cervix cancer |
| HSIL_HPV: HPV-infected high-grade squamous intraepithelial lesions | ||
| N_HPV: HPV-infected normal cervix | ||
| Colorectum (GSE201348) |  | FAP: Familial adenomatous polyposis |
| CRC: Colorectal cancer | ||
| Colorectum (HTA11) |  | AD: Adenomas |
| SER: Sessile serrated lesions | ||
| MSI-H: Microsatellite-high colorectal cancer | ||
| MSS: Microsatellite stable colorectal cancer | ||
| Endometrium | 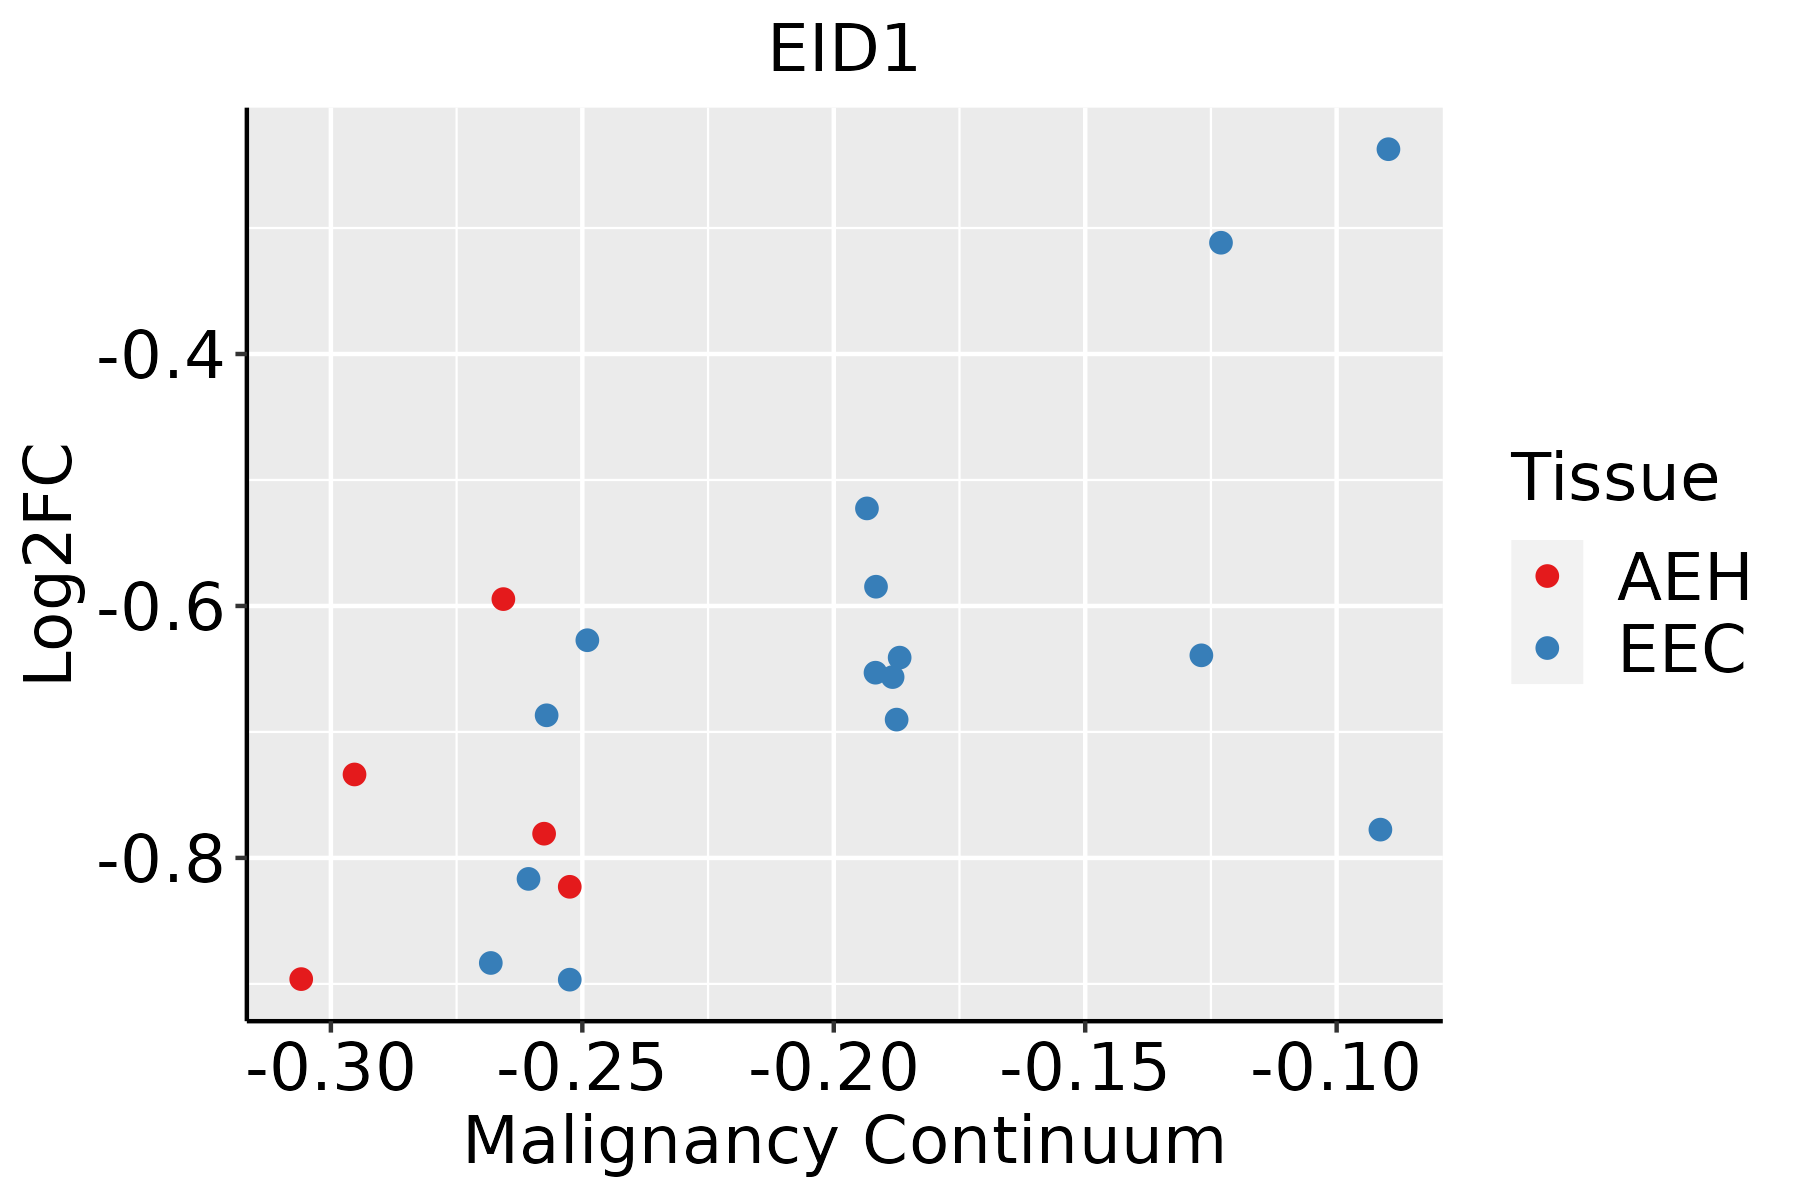 | AEH: Atypical endometrial hyperplasia |
| EEC: Endometrioid Cancer | ||
| Esophagus | 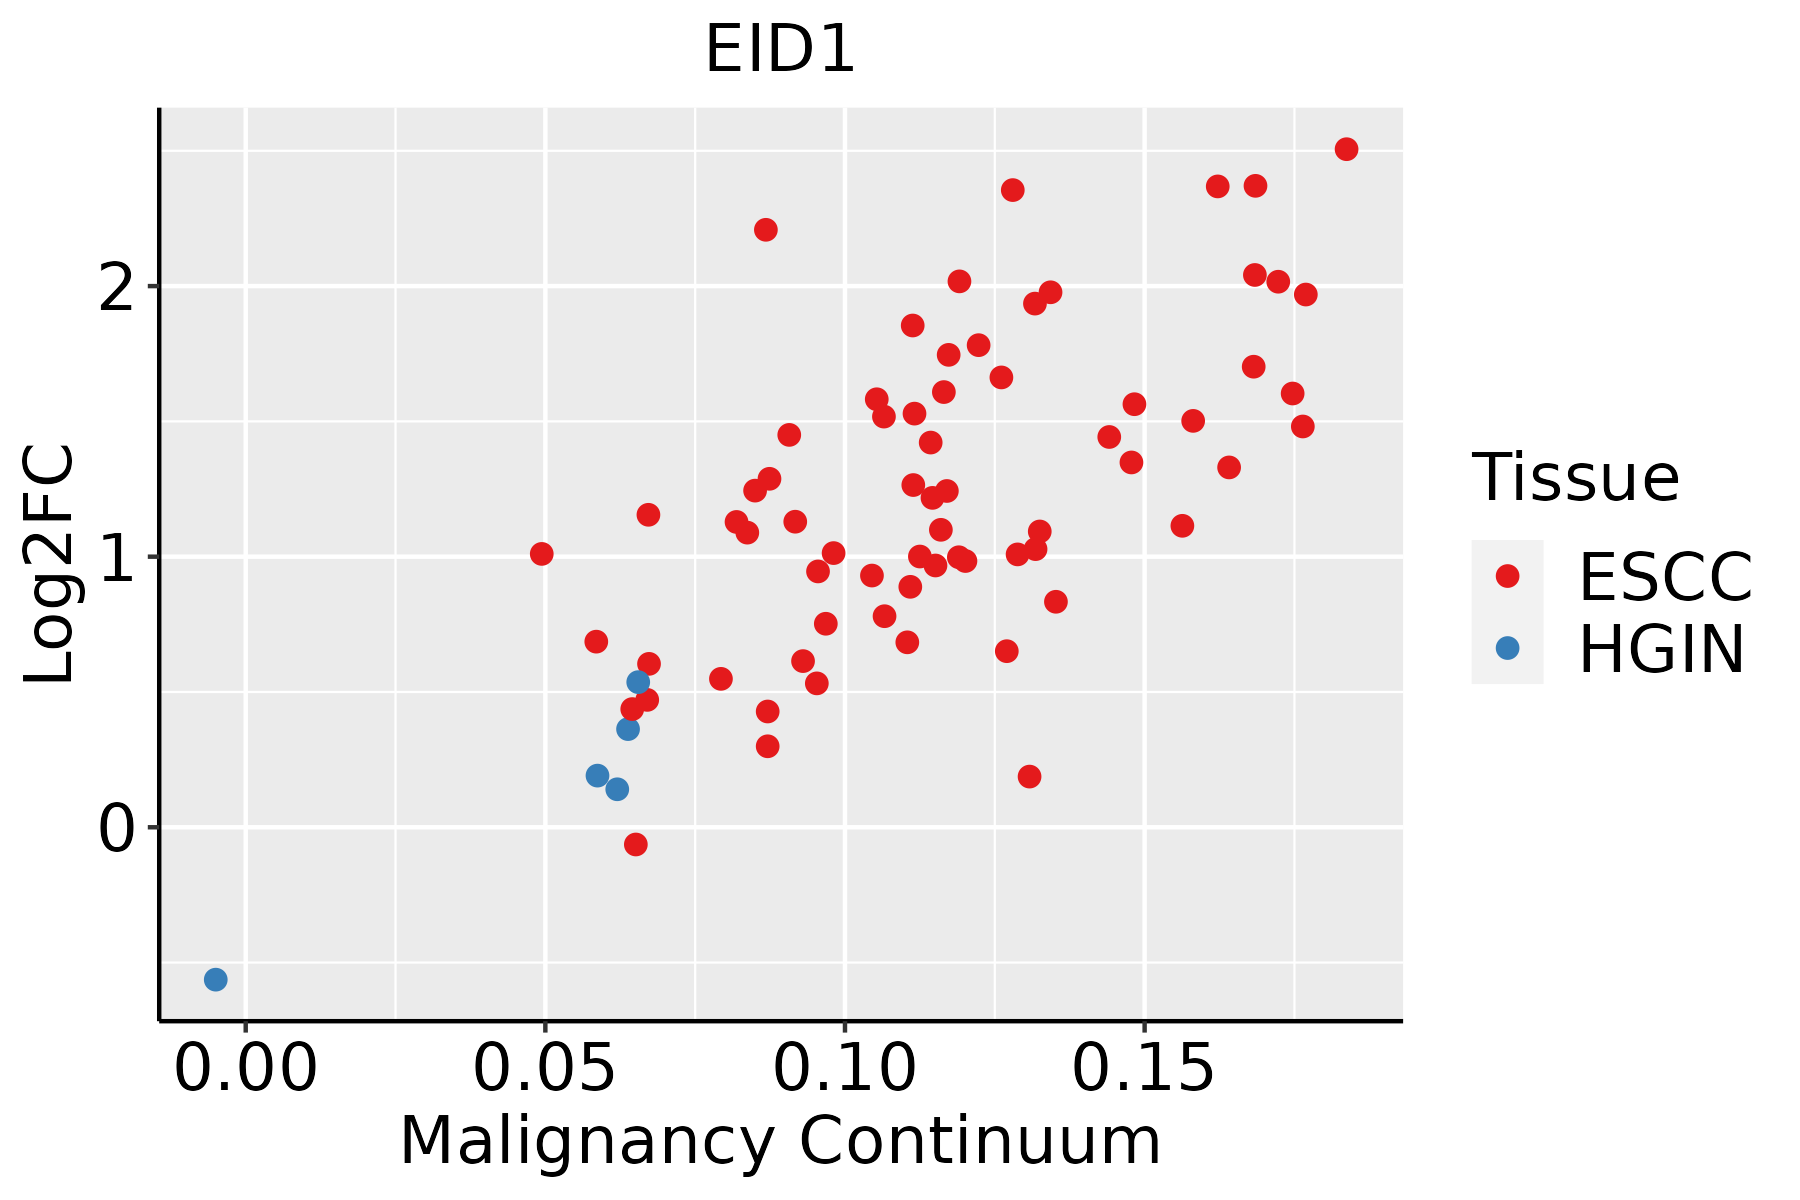 | ESCC: Esophageal squamous cell carcinoma |
| HGIN: High-grade intraepithelial neoplasias | ||
| LGIN: Low-grade intraepithelial neoplasias | ||
| Liver | 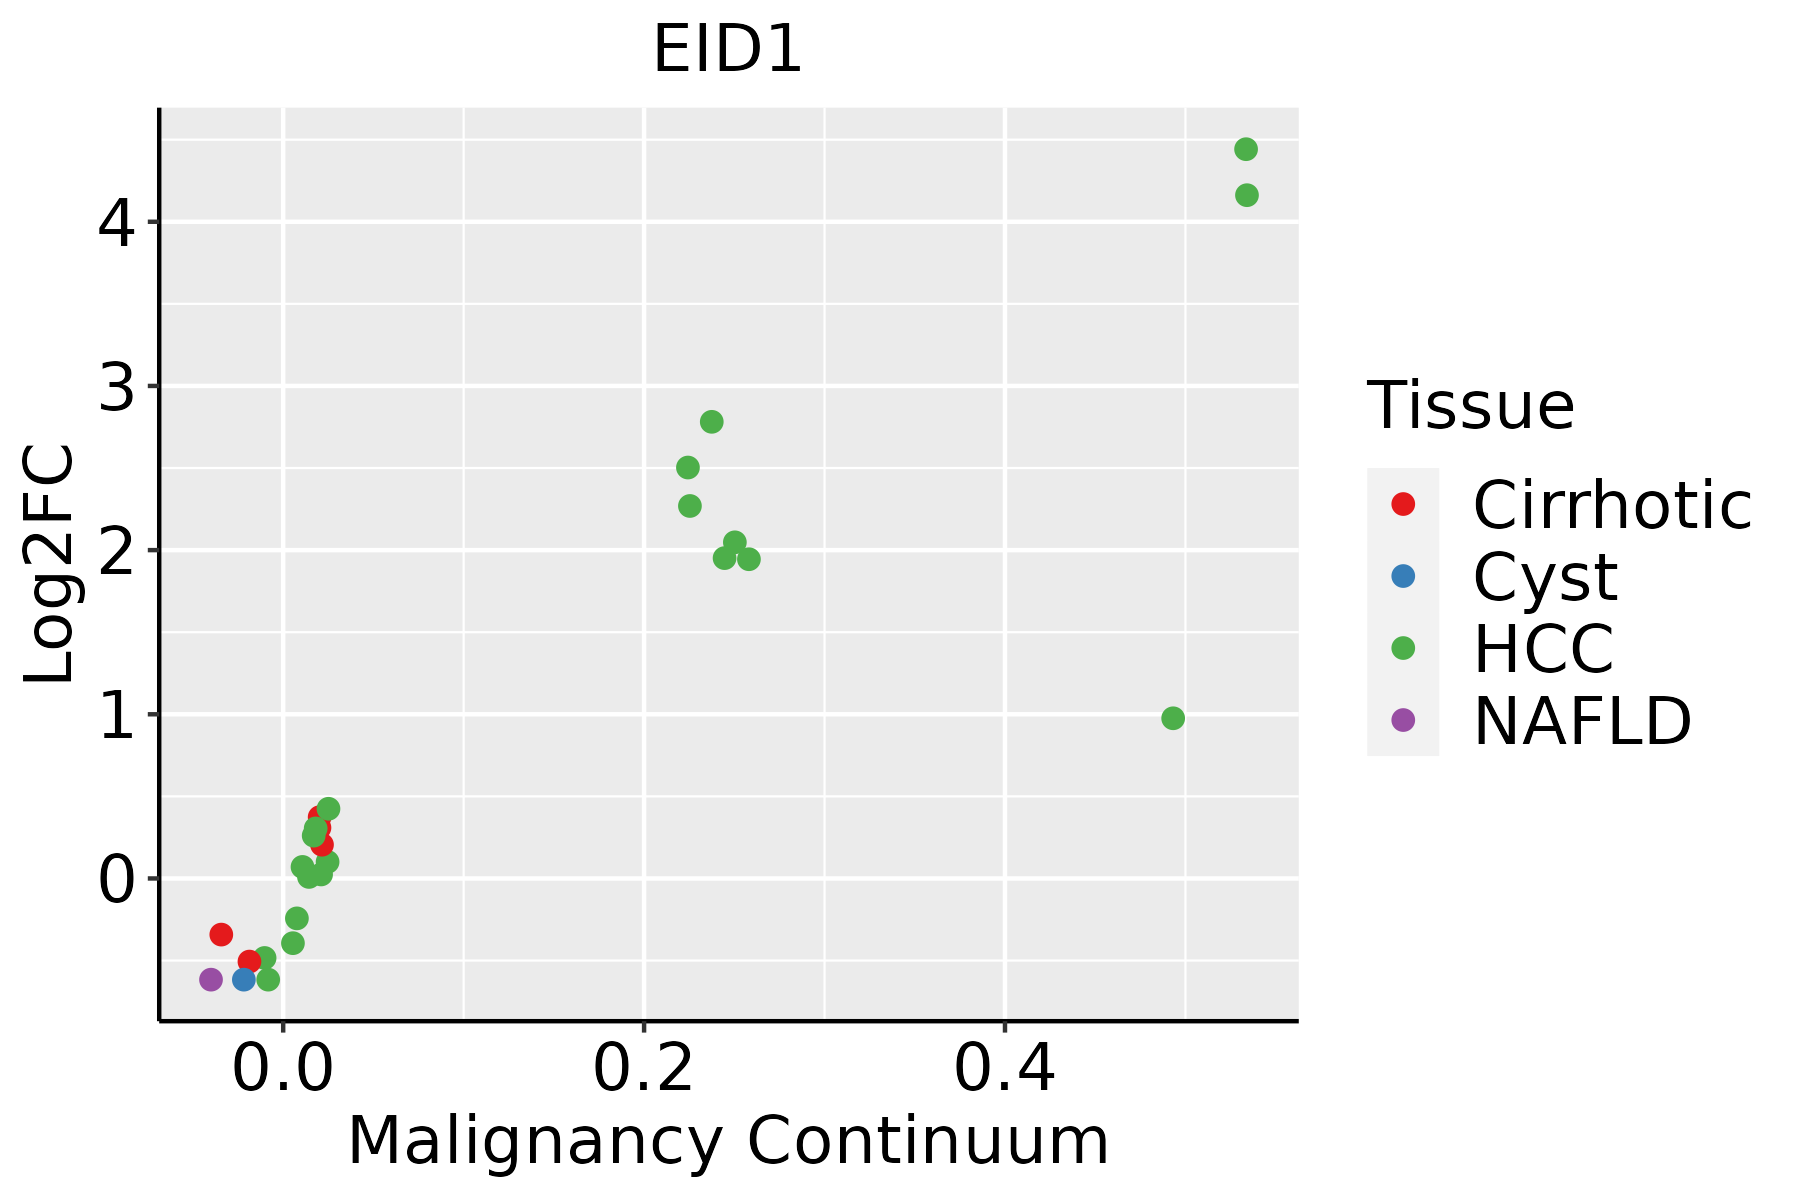 | HCC: Hepatocellular carcinoma |
| NAFLD: Non-alcoholic fatty liver disease | ||
| Oral Cavity | 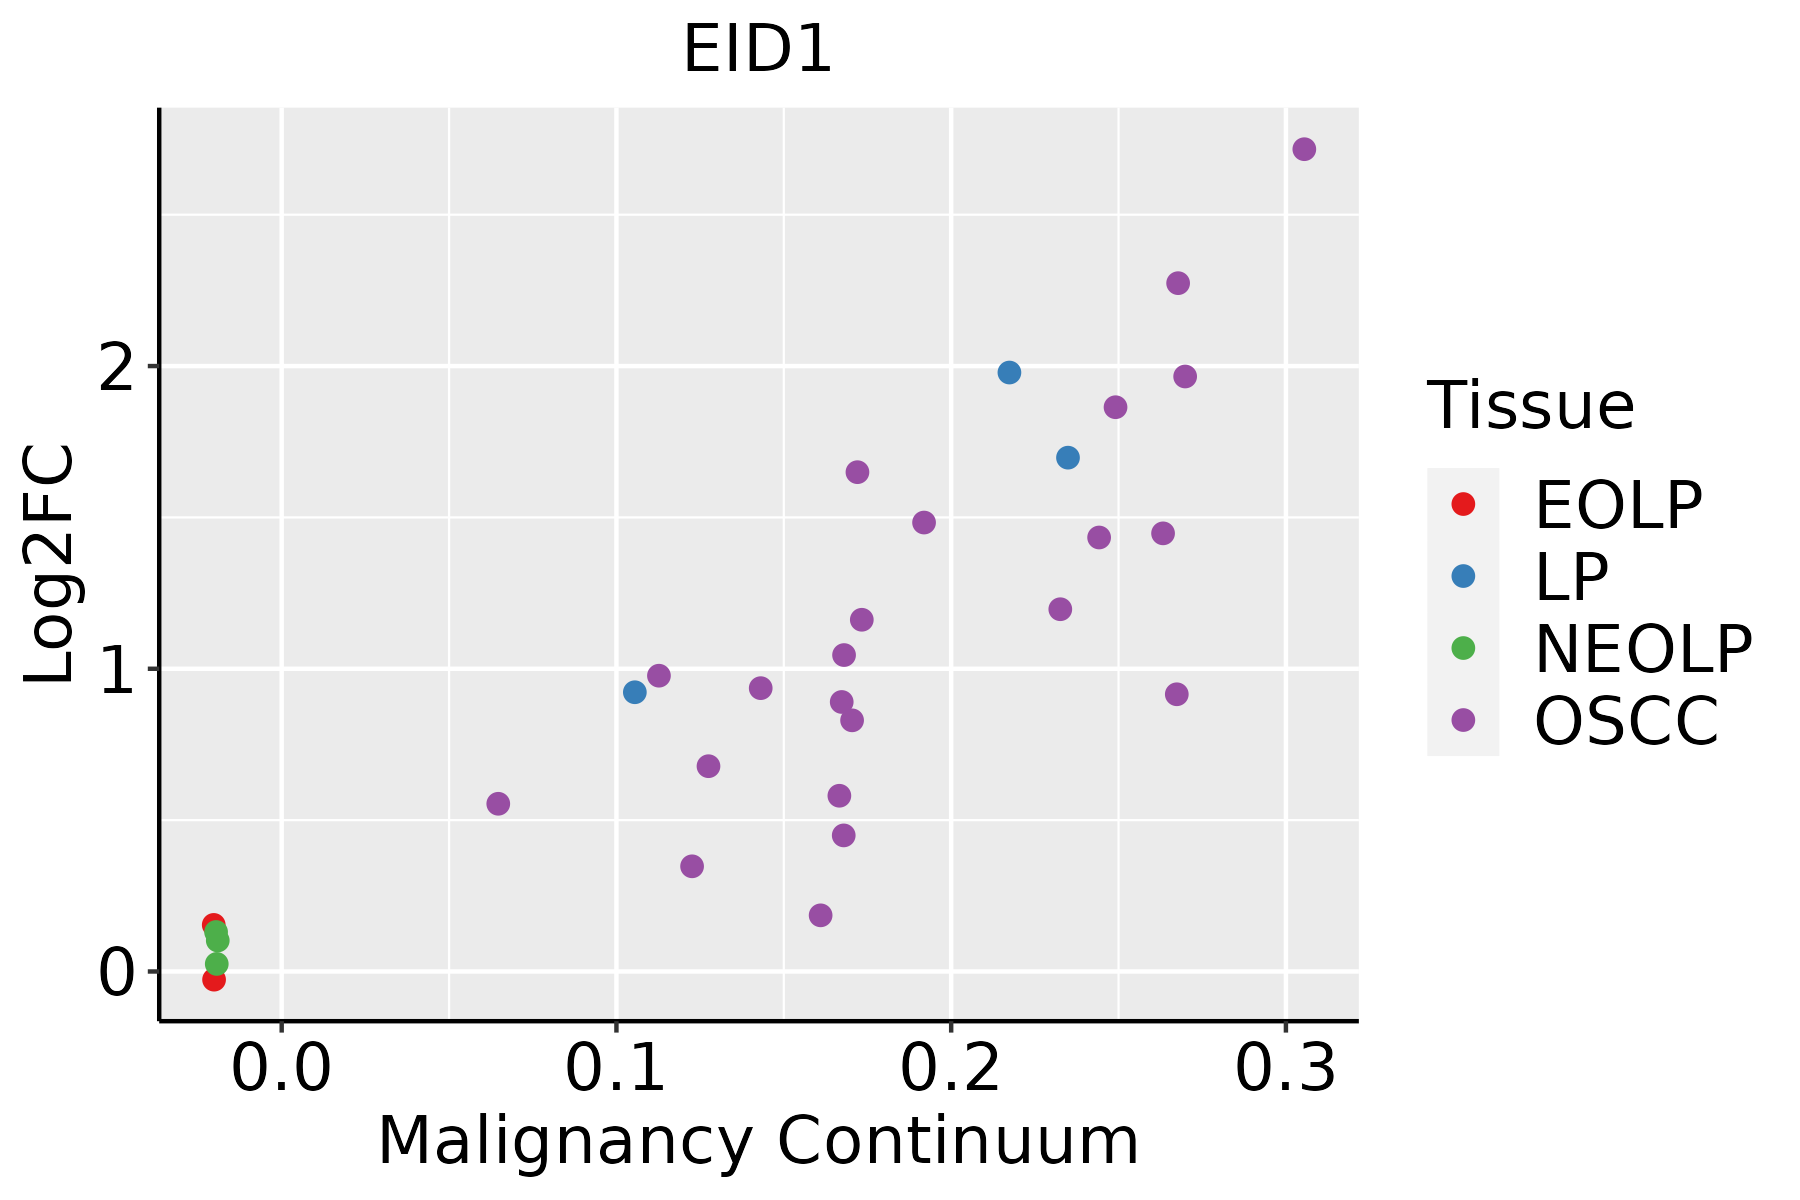 | EOLP: Erosive Oral lichen planus |
| LP: leukoplakia | ||
| NEOLP: Non-erosive oral lichen planus | ||
| OSCC: Oral squamous cell carcinoma | ||
| Prostate | 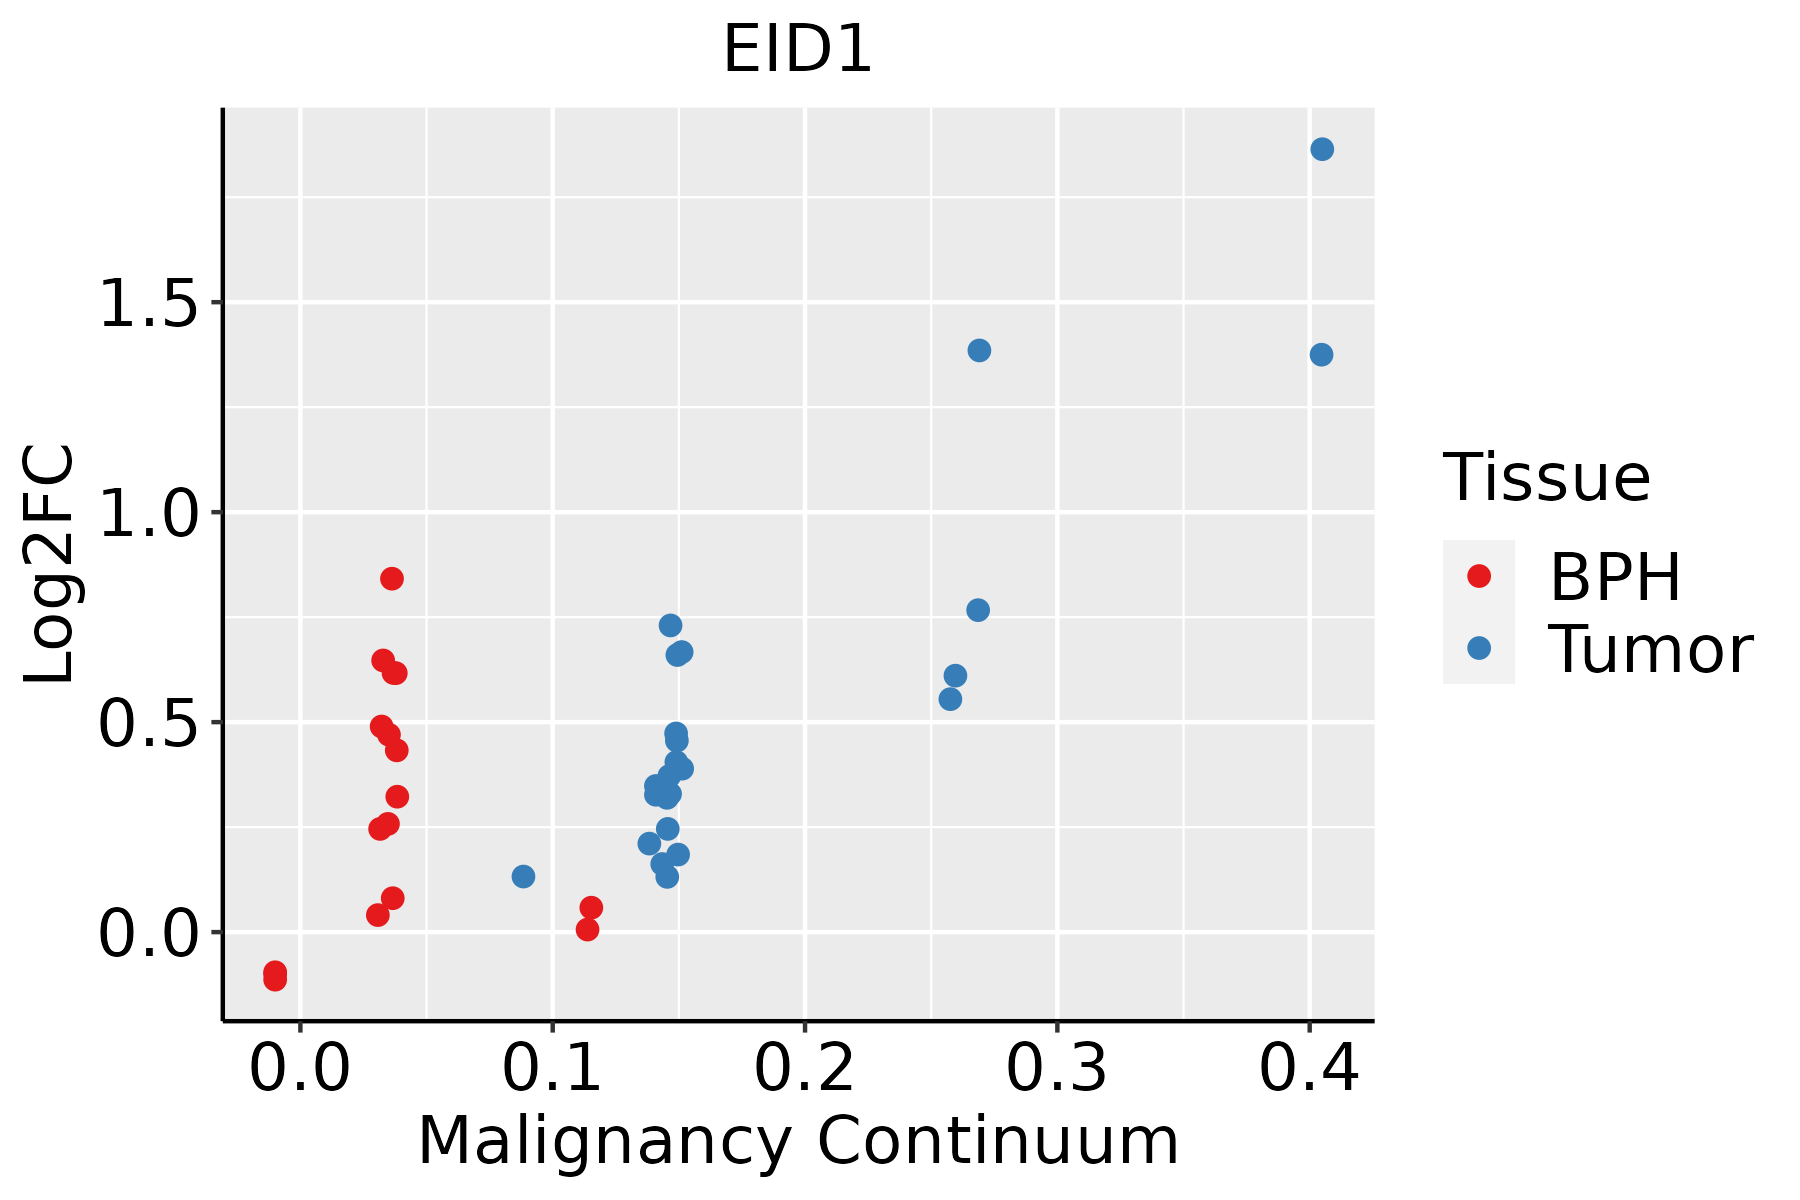 | BPH: Benign Prostatic Hyperplasia |
| Skin |  | AK: Actinic keratosis |
| cSCC: Cutaneous squamous cell carcinoma | ||
| SCCIS:squamous cell carcinoma in situ | ||
| Thyroid |  | ATC: Anaplastic thyroid cancer |
| HT: Hashimoto's thyroiditis | ||
| PTC: Papillary thyroid cancer |
| ∗log2FC in expression of this searched gene in stem-like cells from each diseased tissue sample relative to stem-like cells in normal samples in each tissue plotted against the malignancy continuum. Samples are colored based on if they are from different disease stage. |
Top |
Malignant transformation related pathway analysis |
| Find out the enriched GO biological processes and KEGG pathways involved in transition from healthy to precancer to cancer |
| Tissue | Disease Stage | Enriched GO biological Processes |
| Colorectum | AD |  |
| Colorectum | SER |  |
| Colorectum | MSS |  |
| Colorectum | MSI-H |  |
| Colorectum | FAP |  |
| ∗Top 15 enriched GO BP terms are showed in the bar plot of each disease state in each tissue. Each row represents a significant GO biological process which is colored according to the -log10(p.adjust). |
| Page: 1 2 3 4 5 6 7 8 9 |
| GO ID | Tissue | Disease Stage | Description | Gene Ratio | Bg Ratio | pvalue | p.adjust | Count |
| GO:00165705 | Cervix | CC | histone modification | 84/2311 | 463/18723 | 1.70e-04 | 2.01e-03 | 84 |
| GO:00310565 | Cervix | CC | regulation of histone modification | 33/2311 | 152/18723 | 7.97e-04 | 7.00e-03 | 33 |
| GO:00182054 | Cervix | CC | peptidyl-lysine modification | 62/2311 | 376/18723 | 1.04e-02 | 4.97e-02 | 62 |
| GO:0031056 | Colorectum | AD | regulation of histone modification | 45/3918 | 152/18723 | 7.05e-03 | 4.31e-02 | 45 |
| GO:00310561 | Colorectum | SER | regulation of histone modification | 37/2897 | 152/18723 | 2.80e-03 | 2.50e-02 | 37 |
| GO:0016570 | Colorectum | MSS | histone modification | 113/3467 | 463/18723 | 8.37e-04 | 8.68e-03 | 113 |
| GO:00310562 | Colorectum | MSS | regulation of histone modification | 41/3467 | 152/18723 | 6.41e-03 | 4.27e-02 | 41 |
| GO:00165701 | Colorectum | FAP | histone modification | 94/2622 | 463/18723 | 1.06e-04 | 1.76e-03 | 94 |
| GO:001657015 | Esophagus | ESCC | histone modification | 323/8552 | 463/18723 | 2.61e-26 | 7.88e-24 | 323 |
| GO:001820514 | Esophagus | ESCC | peptidyl-lysine modification | 259/8552 | 376/18723 | 3.90e-20 | 5.26e-18 | 259 |
| GO:001839413 | Esophagus | ESCC | peptidyl-lysine acetylation | 123/8552 | 169/18723 | 6.58e-13 | 2.94e-11 | 123 |
| GO:004354313 | Esophagus | ESCC | protein acylation | 165/8552 | 243/18723 | 1.69e-12 | 7.14e-11 | 165 |
| GO:000647313 | Esophagus | ESCC | protein acetylation | 140/8552 | 201/18723 | 4.37e-12 | 1.69e-10 | 140 |
| GO:001839313 | Esophagus | ESCC | internal peptidyl-lysine acetylation | 114/8552 | 158/18723 | 1.16e-11 | 4.24e-10 | 114 |
| GO:000647513 | Esophagus | ESCC | internal protein amino acid acetylation | 115/8552 | 160/18723 | 1.43e-11 | 5.08e-10 | 115 |
| GO:00165735 | Esophagus | ESCC | histone acetylation | 110/8552 | 152/18723 | 1.95e-11 | 6.81e-10 | 110 |
| GO:003105614 | Esophagus | ESCC | regulation of histone modification | 106/8552 | 152/18723 | 1.52e-09 | 3.55e-08 | 106 |
| GO:20007564 | Esophagus | ESCC | regulation of peptidyl-lysine acetylation | 43/8552 | 63/18723 | 2.43e-04 | 1.50e-03 | 43 |
| GO:19019835 | Esophagus | ESCC | regulation of protein acetylation | 49/8552 | 77/18723 | 1.12e-03 | 5.60e-03 | 49 |
| GO:00350653 | Esophagus | ESCC | regulation of histone acetylation | 36/8552 | 54/18723 | 1.49e-03 | 7.06e-03 | 36 |
| Page: 1 2 3 4 5 6 7 |
| Pathway ID | Tissue | Disease Stage | Description | Gene Ratio | Bg Ratio | pvalue | p.adjust | qvalue | Count |
| Page: 1 |
Top |
Cell-cell communication analysis |
| Identification of potential cell-cell interactions between two cell types and their ligand-receptor pairs for different disease states |
| Ligand | Receptor | LRpair | Pathway | Tissue | Disease Stage |
| Page: 1 |
Top |
Single-cell gene regulatory network inference analysis |
| Find out the significant the regulons (TFs) and the target genes of each regulon across cell types for different disease states |
| TF | Cell Type | Tissue | Disease Stage | Target Gene | RSS | Regulon Activity |
| ∗The dot plots of a searched regulon are shown for all cell subpopulations in each disease state of each tissue based on the regulon specific score inferred using pySCENIC and by calculating the average expression. |
| Page: 1 |
Top |
Somatic mutation of malignant transformation related genes |
| Annotation of somatic variants for genes involved in malignant transformation |
| Hugo Symbol | Variant Class | Variant Classification | dbSNP RS | HGVSc | HGVSp | HGVSp Short | SWISSPROT | BIOTYPE | SIFT | PolyPhen | Tumor Sample Barcode | Tissue | Histology | Sex | Age | Stage | Therapy Types | Drugs | Outcome |
| EID1 | SNV | Missense_Mutation | novel | c.313T>A | p.Trp105Arg | p.W105R | Q9Y6B2 | protein_coding | deleterious(0) | probably_damaging(0.997) | TCGA-AN-A0FX-01 | Breast | breast invasive carcinoma | Female | <65 | I/II | Unknown | Unknown | SD |
| EID1 | insertion | Frame_Shift_Ins | novel | c.382_383insATATGTA | p.Leu128HisfsTer4 | p.L128Hfs*4 | Q9Y6B2 | protein_coding | TCGA-A8-A09D-01 | Breast | breast invasive carcinoma | Female | <65 | I/II | Chemotherapy | doxorubicin | CR | ||
| EID1 | SNV | Missense_Mutation | novel | c.41N>A | p.Ser14Asn | p.S14N | Q9Y6B2 | protein_coding | tolerated(0.06) | benign(0.181) | TCGA-AZ-4315-01 | Colorectum | colon adenocarcinoma | Male | <65 | I/II | Unknown | Unknown | SD |
| EID1 | SNV | Missense_Mutation | c.143G>A | p.Gly48Glu | p.G48E | Q9Y6B2 | protein_coding | tolerated(0.41) | benign(0.056) | TCGA-G4-6628-01 | Colorectum | colon adenocarcinoma | Male | >=65 | I/II | Unknown | Unknown | SD | |
| EID1 | SNV | Missense_Mutation | c.300G>T | p.Glu100Asp | p.E100D | Q9Y6B2 | protein_coding | tolerated(0.16) | benign(0.019) | TCGA-AP-A051-01 | Endometrium | uterine corpus endometrioid carcinoma | Female | >=65 | I/II | Unknown | Unknown | SD | |
| EID1 | SNV | Missense_Mutation | novel | c.101N>A | p.Gly34Asp | p.G34D | Q9Y6B2 | protein_coding | deleterious(0.01) | possibly_damaging(0.708) | TCGA-AX-A06F-01 | Endometrium | uterine corpus endometrioid carcinoma | Female | <65 | III/IV | Chemotherapy | carboplatin | SD |
| EID1 | SNV | Missense_Mutation | novel | c.459N>T | p.Lys153Asn | p.K153N | Q9Y6B2 | protein_coding | tolerated(0.15) | probably_damaging(0.998) | TCGA-BS-A0UV-01 | Endometrium | uterine corpus endometrioid carcinoma | Female | <65 | III/IV | Unknown | Unknown | SD |
| EID1 | SNV | Missense_Mutation | c.157G>A | p.Glu53Lys | p.E53K | Q9Y6B2 | protein_coding | tolerated(0.76) | possibly_damaging(0.776) | TCGA-D1-A16F-01 | Endometrium | uterine corpus endometrioid carcinoma | Female | <65 | I/II | Unknown | Unknown | SD | |
| EID1 | SNV | Missense_Mutation | rs374971624 | c.217C>T | p.Arg73Trp | p.R73W | Q9Y6B2 | protein_coding | tolerated(0.09) | benign(0.335) | TCGA-DF-A2KU-01 | Endometrium | uterine corpus endometrioid carcinoma | Female | Unknown | I/II | Unknown | Unknown | SD |
| EID1 | SNV | Missense_Mutation | c.464N>T | p.Pro155Leu | p.P155L | Q9Y6B2 | protein_coding | tolerated(0.46) | probably_damaging(0.998) | TCGA-EO-A22U-01 | Endometrium | uterine corpus endometrioid carcinoma | Female | >=65 | I/II | Unknown | Unknown | SD |
| Page: 1 2 |
Top |
Related drugs of malignant transformation related genes |
| Identification of chemicals and drugs interact with genes involved in malignant transfromation |
| (DGIdb 4.0) |
| Entrez ID | Symbol | Category | Interaction Types | Drug Claim Name | Drug Name | PMIDs |
| Page: 1 |

Copyright 2023-Present -The University of Texas Health Science Center at Houston |