
|
|||||
|
 | |
| |
| |
| |
| |
| |
|
Gene: EI24 |
Gene summary for EI24 |
| Gene information | Species | Human | Gene symbol | EI24 | Gene ID | 9538 |
| Gene name | EI24 autophagy associated transmembrane protein | |
| Gene Alias | EPG4 | |
| Cytomap | 11q24.2 | |
| Gene Type | protein-coding | GO ID | GO:0001558 | UniProtAcc | O14681 |
Top |
Malignant transformation analysis |
| Identification of the aberrant gene expression in precancerous and cancerous lesions by comparing the gene expression of stem-like cells in diseased tissues with normal stem cells |
| Entrez ID | Symbol | Replicates | Species | Organ | Tissue | Adj P-value | Log2FC | Malignancy |
| 9538 | EI24 | HTA11_3410_2000001011 | Human | Colorectum | AD | 1.29e-08 | 2.79e-01 | 0.0155 |
| 9538 | EI24 | HTA11_2487_2000001011 | Human | Colorectum | SER | 2.89e-10 | 4.93e-01 | -0.1808 |
| 9538 | EI24 | HTA11_1938_2000001011 | Human | Colorectum | AD | 3.00e-14 | 7.90e-01 | -0.0811 |
| 9538 | EI24 | HTA11_78_2000001011 | Human | Colorectum | AD | 1.68e-17 | 8.11e-01 | -0.1088 |
| 9538 | EI24 | HTA11_347_2000001011 | Human | Colorectum | AD | 1.25e-37 | 8.38e-01 | -0.1954 |
| 9538 | EI24 | HTA11_411_2000001011 | Human | Colorectum | SER | 1.94e-07 | 8.00e-01 | -0.2602 |
| 9538 | EI24 | HTA11_83_2000001011 | Human | Colorectum | SER | 2.07e-05 | 4.98e-01 | -0.1526 |
| 9538 | EI24 | HTA11_696_2000001011 | Human | Colorectum | AD | 6.12e-09 | 3.52e-01 | -0.1464 |
| 9538 | EI24 | HTA11_866_2000001011 | Human | Colorectum | AD | 7.12e-04 | 2.49e-01 | -0.1001 |
| 9538 | EI24 | HTA11_1391_2000001011 | Human | Colorectum | AD | 7.78e-20 | 7.37e-01 | -0.059 |
| 9538 | EI24 | HTA11_2992_2000001011 | Human | Colorectum | SER | 1.96e-03 | 5.50e-01 | -0.1706 |
| 9538 | EI24 | HTA11_5212_2000001011 | Human | Colorectum | AD | 6.60e-06 | 5.24e-01 | -0.2061 |
| 9538 | EI24 | HTA11_5216_2000001011 | Human | Colorectum | SER | 2.94e-02 | 4.10e-01 | -0.1462 |
| 9538 | EI24 | HTA11_546_2000001011 | Human | Colorectum | AD | 7.96e-04 | 4.51e-01 | -0.0842 |
| 9538 | EI24 | HTA11_7862_2000001011 | Human | Colorectum | AD | 4.76e-12 | 6.79e-01 | -0.0179 |
| 9538 | EI24 | HTA11_866_3004761011 | Human | Colorectum | AD | 9.70e-14 | 4.61e-01 | 0.096 |
| 9538 | EI24 | HTA11_4255_2000001011 | Human | Colorectum | SER | 1.36e-04 | 5.67e-01 | 0.0446 |
| 9538 | EI24 | HTA11_8622_2000001021 | Human | Colorectum | SER | 4.81e-02 | 3.99e-01 | 0.0528 |
| 9538 | EI24 | HTA11_7663_2000001011 | Human | Colorectum | SER | 2.28e-08 | 7.58e-01 | 0.0131 |
| 9538 | EI24 | HTA11_10623_2000001011 | Human | Colorectum | AD | 4.10e-06 | 5.77e-01 | -0.0177 |
| Page: 1 2 3 4 5 6 7 8 9 |
| Tissue | Expression Dynamics | Abbreviation |
| Colorectum (GSE201348) |  | FAP: Familial adenomatous polyposis |
| CRC: Colorectal cancer | ||
| Colorectum (HTA11) |  | AD: Adenomas |
| SER: Sessile serrated lesions | ||
| MSI-H: Microsatellite-high colorectal cancer | ||
| MSS: Microsatellite stable colorectal cancer | ||
| Endometrium |  | AEH: Atypical endometrial hyperplasia |
| EEC: Endometrioid Cancer | ||
| Esophagus | 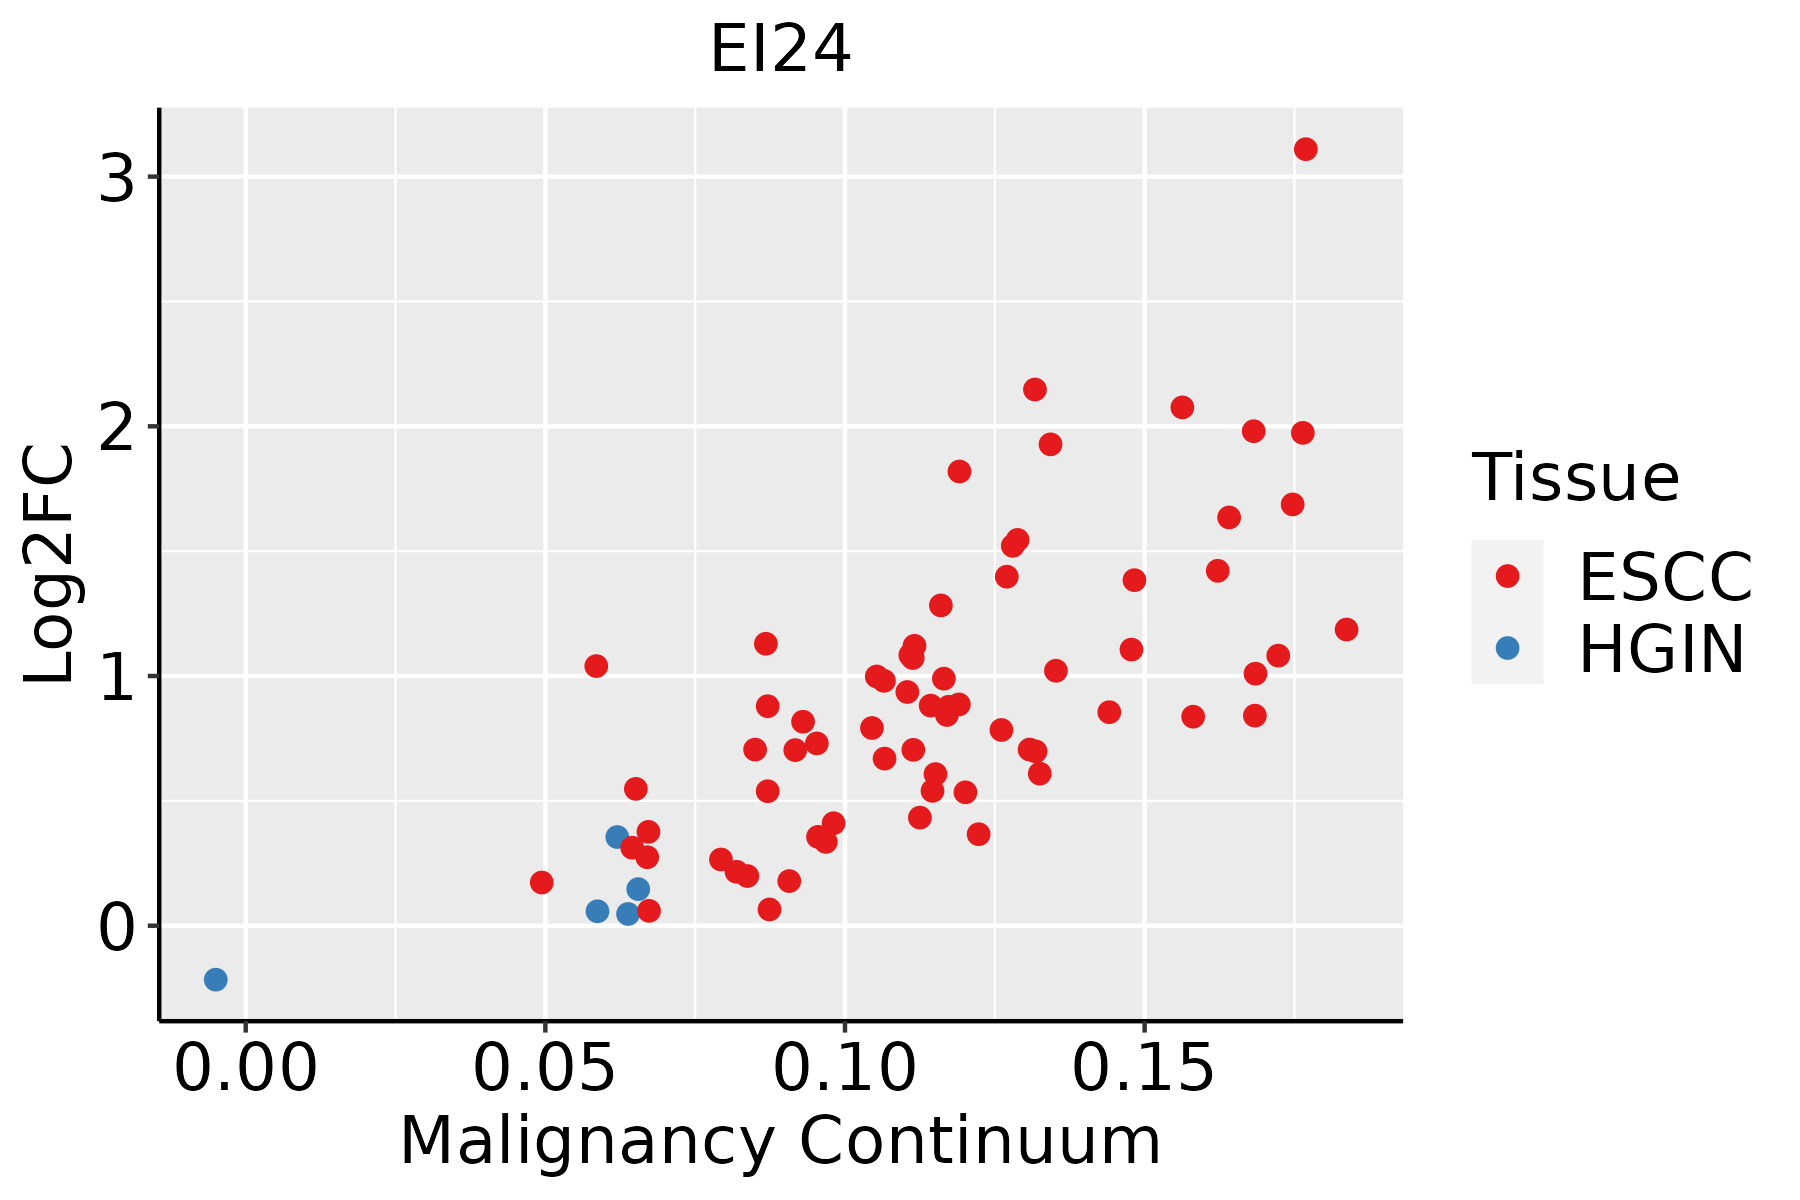 | ESCC: Esophageal squamous cell carcinoma |
| HGIN: High-grade intraepithelial neoplasias | ||
| LGIN: Low-grade intraepithelial neoplasias | ||
| Liver |  | HCC: Hepatocellular carcinoma |
| NAFLD: Non-alcoholic fatty liver disease | ||
| Oral Cavity |  | EOLP: Erosive Oral lichen planus |
| LP: leukoplakia | ||
| NEOLP: Non-erosive oral lichen planus | ||
| OSCC: Oral squamous cell carcinoma | ||
| Prostate | 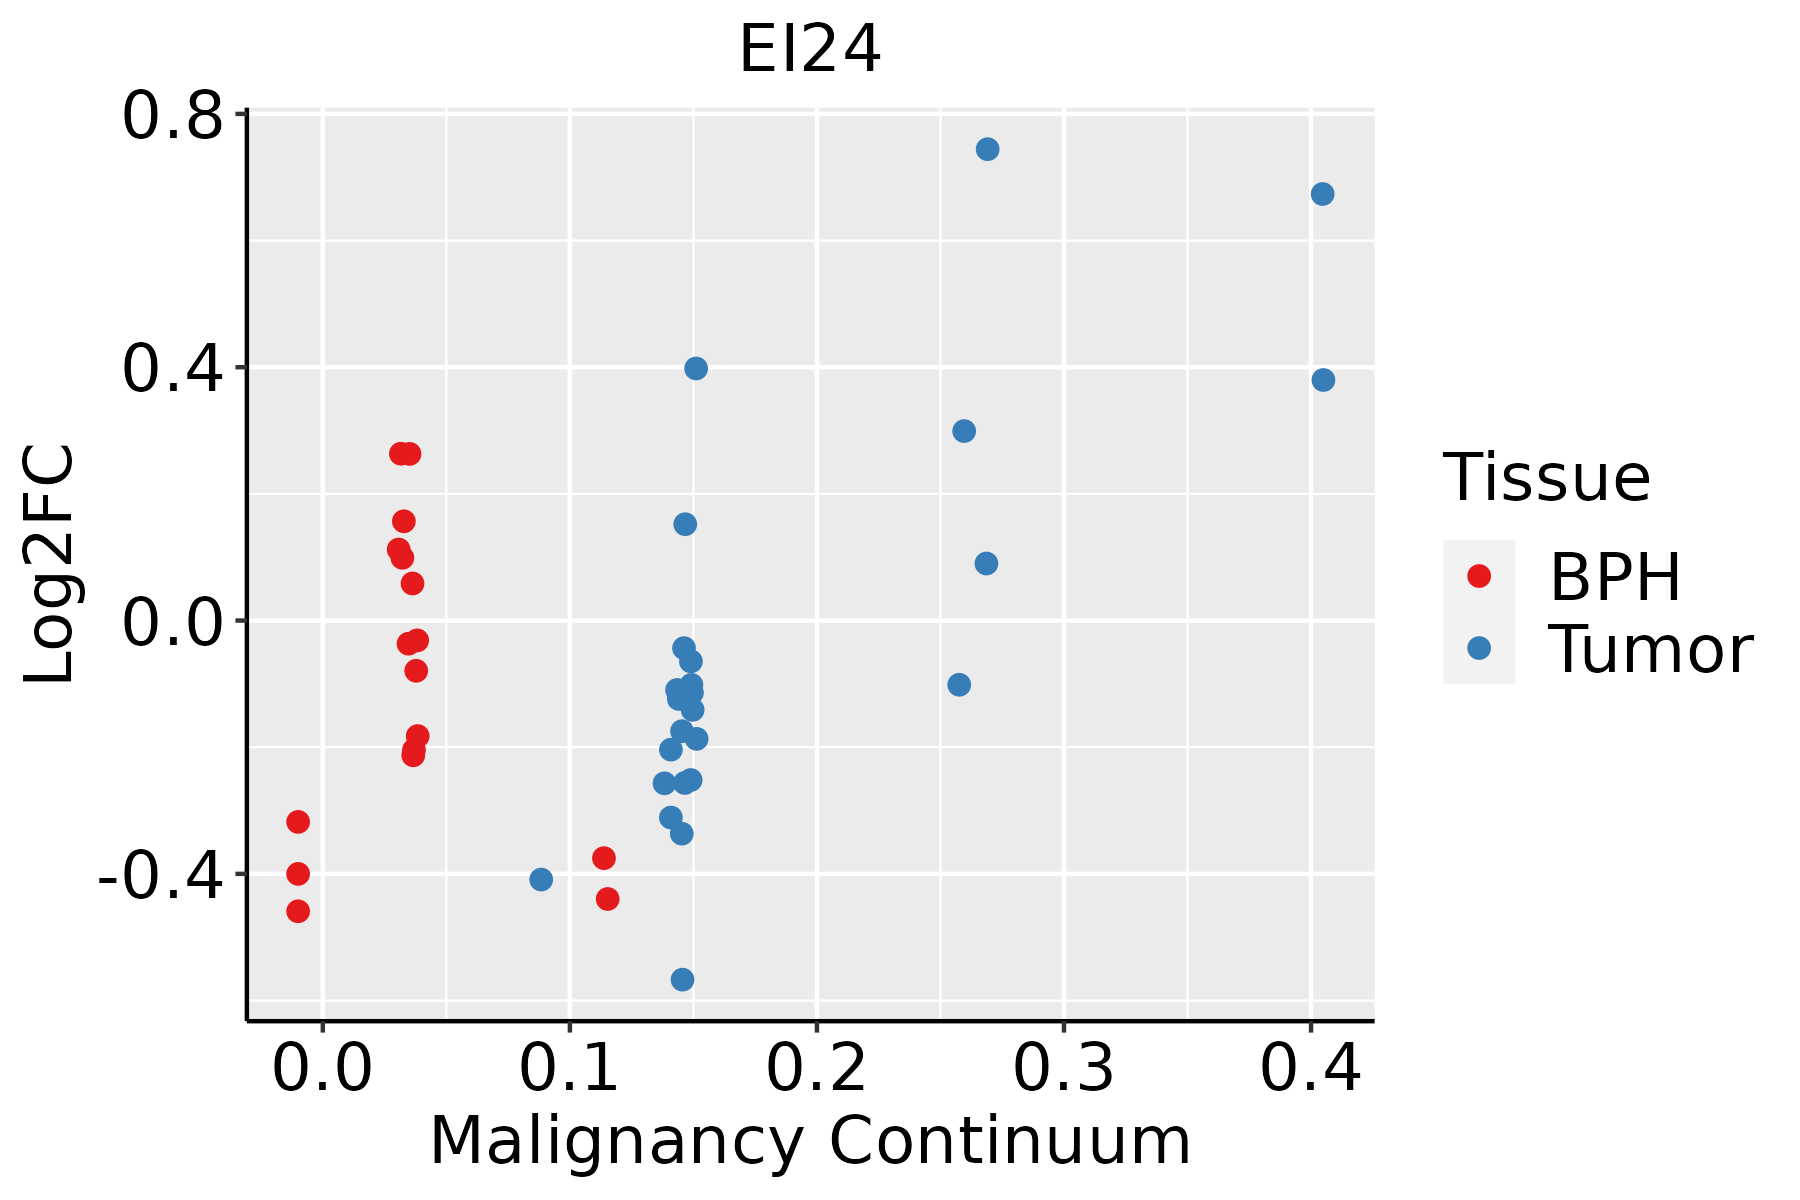 | BPH: Benign Prostatic Hyperplasia |
| Skin | 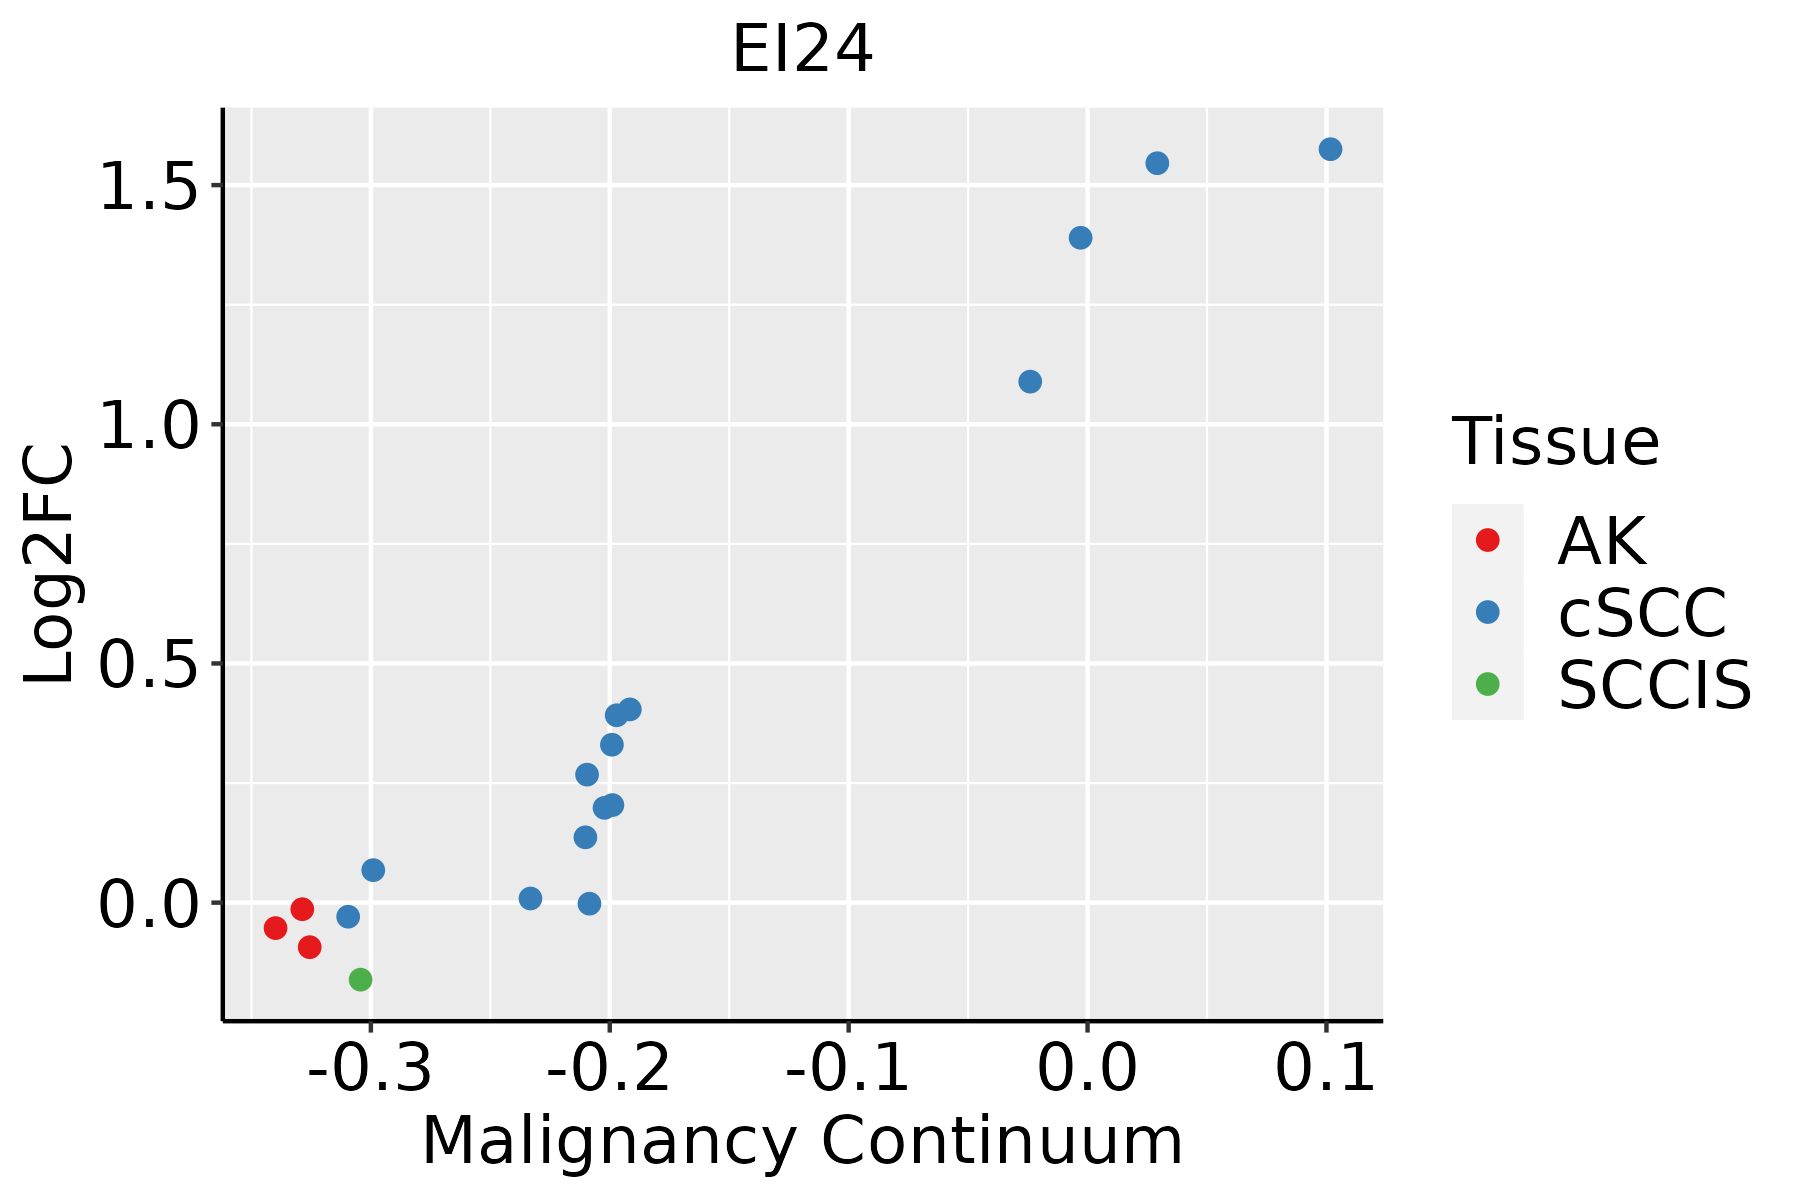 | AK: Actinic keratosis |
| cSCC: Cutaneous squamous cell carcinoma | ||
| SCCIS:squamous cell carcinoma in situ | ||
| Thyroid |  | ATC: Anaplastic thyroid cancer |
| HT: Hashimoto's thyroiditis | ||
| PTC: Papillary thyroid cancer |
| ∗log2FC in expression of this searched gene in stem-like cells from each diseased tissue sample relative to stem-like cells in normal samples in each tissue plotted against the malignancy continuum. Samples are colored based on if they are from different disease stage. |
Top |
Malignant transformation related pathway analysis |
| Find out the enriched GO biological processes and KEGG pathways involved in transition from healthy to precancer to cancer |
| Tissue | Disease Stage | Enriched GO biological Processes |
| Colorectum | AD |  |
| Colorectum | SER |  |
| Colorectum | MSS |  |
| Colorectum | MSI-H |  |
| Colorectum | FAP |  |
| ∗Top 15 enriched GO BP terms are showed in the bar plot of each disease state in each tissue. Each row represents a significant GO biological process which is colored according to the -log10(p.adjust). |
| Page: 1 2 3 4 5 6 7 8 9 |
| GO ID | Tissue | Disease Stage | Description | Gene Ratio | Bg Ratio | pvalue | p.adjust | Count |
| GO:0016236 | Colorectum | AD | macroautophagy | 103/3918 | 291/18723 | 6.76e-09 | 4.15e-07 | 103 |
| GO:0016049 | Colorectum | AD | cell growth | 143/3918 | 482/18723 | 2.83e-06 | 8.09e-05 | 143 |
| GO:0001558 | Colorectum | AD | regulation of cell growth | 124/3918 | 414/18723 | 7.67e-06 | 1.86e-04 | 124 |
| GO:0045926 | Colorectum | AD | negative regulation of growth | 70/3918 | 249/18723 | 4.07e-03 | 2.83e-02 | 70 |
| GO:00162361 | Colorectum | SER | macroautophagy | 79/2897 | 291/18723 | 1.97e-07 | 1.10e-05 | 79 |
| GO:00015581 | Colorectum | SER | regulation of cell growth | 90/2897 | 414/18723 | 4.00e-04 | 6.02e-03 | 90 |
| GO:00160491 | Colorectum | SER | cell growth | 100/2897 | 482/18723 | 1.07e-03 | 1.24e-02 | 100 |
| GO:00459261 | Colorectum | SER | negative regulation of growth | 55/2897 | 249/18723 | 3.44e-03 | 2.92e-02 | 55 |
| GO:00162362 | Colorectum | MSS | macroautophagy | 93/3467 | 291/18723 | 2.08e-08 | 1.17e-06 | 93 |
| GO:00160492 | Colorectum | MSS | cell growth | 123/3467 | 482/18723 | 7.15e-05 | 1.21e-03 | 123 |
| GO:00015582 | Colorectum | MSS | regulation of cell growth | 105/3467 | 414/18723 | 2.97e-04 | 3.90e-03 | 105 |
| GO:00160499 | Endometrium | AEH | cell growth | 93/2100 | 482/18723 | 1.00e-07 | 4.99e-06 | 93 |
| GO:00015589 | Endometrium | AEH | regulation of cell growth | 75/2100 | 414/18723 | 1.79e-05 | 3.65e-04 | 75 |
| GO:00459264 | Endometrium | AEH | negative regulation of growth | 47/2100 | 249/18723 | 2.36e-04 | 2.84e-03 | 47 |
| GO:00162368 | Endometrium | AEH | macroautophagy | 52/2100 | 291/18723 | 4.56e-04 | 4.80e-03 | 52 |
| GO:00303082 | Endometrium | AEH | negative regulation of cell growth | 36/2100 | 188/18723 | 9.15e-04 | 8.37e-03 | 36 |
| GO:001604915 | Endometrium | EEC | cell growth | 95/2168 | 482/18723 | 1.16e-07 | 5.54e-06 | 95 |
| GO:000155814 | Endometrium | EEC | regulation of cell growth | 77/2168 | 414/18723 | 1.64e-05 | 3.16e-04 | 77 |
| GO:004592611 | Endometrium | EEC | negative regulation of growth | 48/2168 | 249/18723 | 2.58e-04 | 2.98e-03 | 48 |
| GO:001623613 | Endometrium | EEC | macroautophagy | 53/2168 | 291/18723 | 5.40e-04 | 5.42e-03 | 53 |
| Page: 1 2 3 4 |
| Pathway ID | Tissue | Disease Stage | Description | Gene Ratio | Bg Ratio | pvalue | p.adjust | qvalue | Count |
| hsa0411524 | Esophagus | ESCC | p53 signaling pathway | 65/4205 | 74/8465 | 3.88e-12 | 6.50e-11 | 3.33e-11 | 65 |
| hsa0411534 | Esophagus | ESCC | p53 signaling pathway | 65/4205 | 74/8465 | 3.88e-12 | 6.50e-11 | 3.33e-11 | 65 |
| hsa041156 | Liver | HCC | p53 signaling pathway | 46/4020 | 74/8465 | 7.64e-03 | 2.08e-02 | 1.16e-02 | 46 |
| hsa0411511 | Liver | HCC | p53 signaling pathway | 46/4020 | 74/8465 | 7.64e-03 | 2.08e-02 | 1.16e-02 | 46 |
| hsa041159 | Oral cavity | OSCC | p53 signaling pathway | 57/3704 | 74/8465 | 4.99e-09 | 5.07e-08 | 2.58e-08 | 57 |
| hsa0411514 | Oral cavity | OSCC | p53 signaling pathway | 57/3704 | 74/8465 | 4.99e-09 | 5.07e-08 | 2.58e-08 | 57 |
| hsa0411523 | Oral cavity | LP | p53 signaling pathway | 38/2418 | 74/8465 | 2.82e-05 | 1.92e-04 | 1.24e-04 | 38 |
| hsa0411533 | Oral cavity | LP | p53 signaling pathway | 38/2418 | 74/8465 | 2.82e-05 | 1.92e-04 | 1.24e-04 | 38 |
| hsa041158 | Prostate | BPH | p53 signaling pathway | 30/1718 | 74/8465 | 5.15e-05 | 3.40e-04 | 2.10e-04 | 30 |
| hsa0411513 | Prostate | BPH | p53 signaling pathway | 30/1718 | 74/8465 | 5.15e-05 | 3.40e-04 | 2.10e-04 | 30 |
| hsa0411522 | Prostate | Tumor | p53 signaling pathway | 29/1791 | 74/8465 | 2.99e-04 | 1.65e-03 | 1.02e-03 | 29 |
| hsa0411532 | Prostate | Tumor | p53 signaling pathway | 29/1791 | 74/8465 | 2.99e-04 | 1.65e-03 | 1.02e-03 | 29 |
| Page: 1 |
Top |
Cell-cell communication analysis |
| Identification of potential cell-cell interactions between two cell types and their ligand-receptor pairs for different disease states |
| Ligand | Receptor | LRpair | Pathway | Tissue | Disease Stage |
| Page: 1 |
Top |
Single-cell gene regulatory network inference analysis |
| Find out the significant the regulons (TFs) and the target genes of each regulon across cell types for different disease states |
| TF | Cell Type | Tissue | Disease Stage | Target Gene | RSS | Regulon Activity |
| ∗The dot plots of a searched regulon are shown for all cell subpopulations in each disease state of each tissue based on the regulon specific score inferred using pySCENIC and by calculating the average expression. |
| Page: 1 |
Top |
Somatic mutation of malignant transformation related genes |
| Annotation of somatic variants for genes involved in malignant transformation |
| Hugo Symbol | Variant Class | Variant Classification | dbSNP RS | HGVSc | HGVSp | HGVSp Short | SWISSPROT | BIOTYPE | SIFT | PolyPhen | Tumor Sample Barcode | Tissue | Histology | Sex | Age | Stage | Therapy Types | Drugs | Outcome |
| EI24 | SNV | Missense_Mutation | c.299N>C | p.Val100Ala | p.V100A | O14681 | protein_coding | tolerated(0.09) | benign(0) | TCGA-E2-A1LH-01 | Breast | breast invasive carcinoma | Female | <65 | I/II | Chemotherapy | adriamycin | SD | |
| EI24 | insertion | Frame_Shift_Ins | novel | c.1015_1016insTC | p.Gly339ValfsTer51 | p.G339Vfs*51 | O14681 | protein_coding | TCGA-A2-A0CU-01 | Breast | breast invasive carcinoma | Female | >=65 | I/II | Hormone Therapy | tamoxiphen | SD | ||
| EI24 | insertion | Nonsense_Mutation | novel | c.1016_1017insGCCCTGAGCAGCTCTACTTCTGCAGAGAAGTTCCCT | p.Gly339_His340insProTerAlaAlaLeuLeuLeuGlnArgSerSerLeu | p.G339_H340insP*AALLLQRSSL | O14681 | protein_coding | TCGA-A2-A0CU-01 | Breast | breast invasive carcinoma | Female | >=65 | I/II | Hormone Therapy | tamoxiphen | SD | ||
| EI24 | SNV | Missense_Mutation | c.296N>T | p.Ser99Leu | p.S99L | O14681 | protein_coding | tolerated(0.65) | benign(0.01) | TCGA-FU-A3HZ-01 | Cervix | cervical & endocervical cancer | Female | <65 | I/II | Chemotherapy | cisplatin | CR | |
| EI24 | SNV | Missense_Mutation | c.360N>A | p.Phe120Leu | p.F120L | O14681 | protein_coding | tolerated(0.97) | probably_damaging(0.966) | TCGA-AG-A002-01 | Colorectum | rectum adenocarcinoma | Male | <65 | I/II | Unknown | Unknown | SD | |
| EI24 | SNV | Missense_Mutation | rs534625909 | c.347C>T | p.Ser116Leu | p.S116L | O14681 | protein_coding | tolerated(0.1) | benign(0.012) | TCGA-F5-6814-01 | Colorectum | rectum adenocarcinoma | Male | <65 | I/II | Unknown | Unknown | SD |
| EI24 | SNV | Missense_Mutation | c.272G>A | p.Arg91Gln | p.R91Q | O14681 | protein_coding | tolerated(0.31) | benign(0.005) | TCGA-A5-A0G1-01 | Endometrium | uterine corpus endometrioid carcinoma | Female | >=65 | I/II | Unknown | Unknown | SD | |
| EI24 | SNV | Missense_Mutation | c.394N>A | p.Leu132Ile | p.L132I | O14681 | protein_coding | tolerated(0.06) | probably_damaging(0.982) | TCGA-A5-A0G2-01 | Endometrium | uterine corpus endometrioid carcinoma | Female | <65 | III/IV | Unknown | Unknown | SD | |
| EI24 | SNV | Missense_Mutation | novel | c.241G>T | p.Val81Leu | p.V81L | O14681 | protein_coding | tolerated(0.07) | probably_damaging(0.987) | TCGA-AX-A06F-01 | Endometrium | uterine corpus endometrioid carcinoma | Female | <65 | III/IV | Chemotherapy | carboplatin | SD |
| EI24 | SNV | Missense_Mutation | novel | c.851G>A | p.Gly284Asp | p.G284D | O14681 | protein_coding | tolerated(0.29) | benign(0.035) | TCGA-AX-A06F-01 | Endometrium | uterine corpus endometrioid carcinoma | Female | <65 | III/IV | Chemotherapy | carboplatin | SD |
| Page: 1 2 3 |
Top |
Related drugs of malignant transformation related genes |
| Identification of chemicals and drugs interact with genes involved in malignant transfromation |
| (DGIdb 4.0) |
| Entrez ID | Symbol | Category | Interaction Types | Drug Claim Name | Drug Name | PMIDs |
| Page: 1 |

Copyright 2023-Present -The University of Texas Health Science Center at Houston |