| Tissue | Expression Dynamics | Abbreviation |
| Colorectum (GSE201348) |  | FAP: Familial adenomatous polyposis |
| CRC: Colorectal cancer |
| Colorectum (HTA11) |  | AD: Adenomas |
| SER: Sessile serrated lesions |
| MSI-H: Microsatellite-high colorectal cancer |
| MSS: Microsatellite stable colorectal cancer |
| Esophagus | 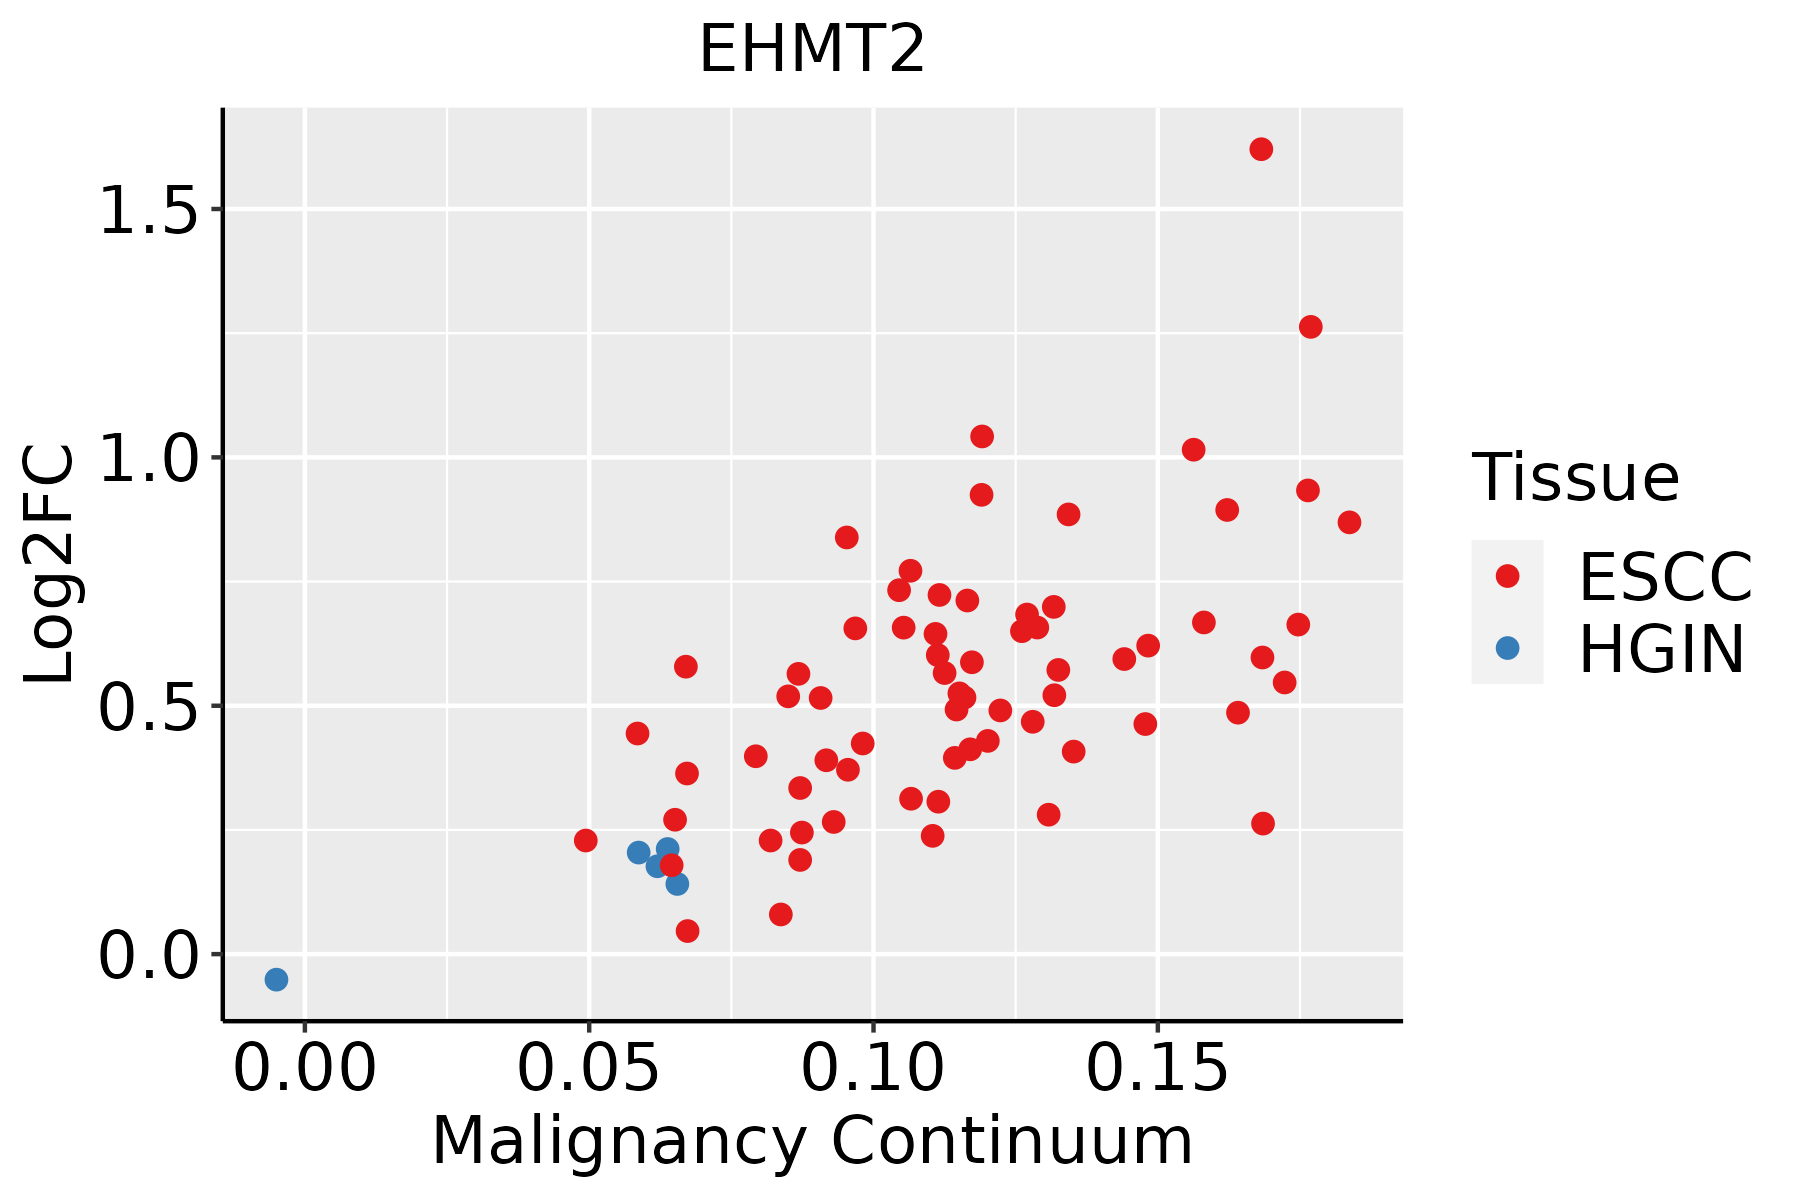 | ESCC: Esophageal squamous cell carcinoma |
| HGIN: High-grade intraepithelial neoplasias |
| LGIN: Low-grade intraepithelial neoplasias |
| Liver | 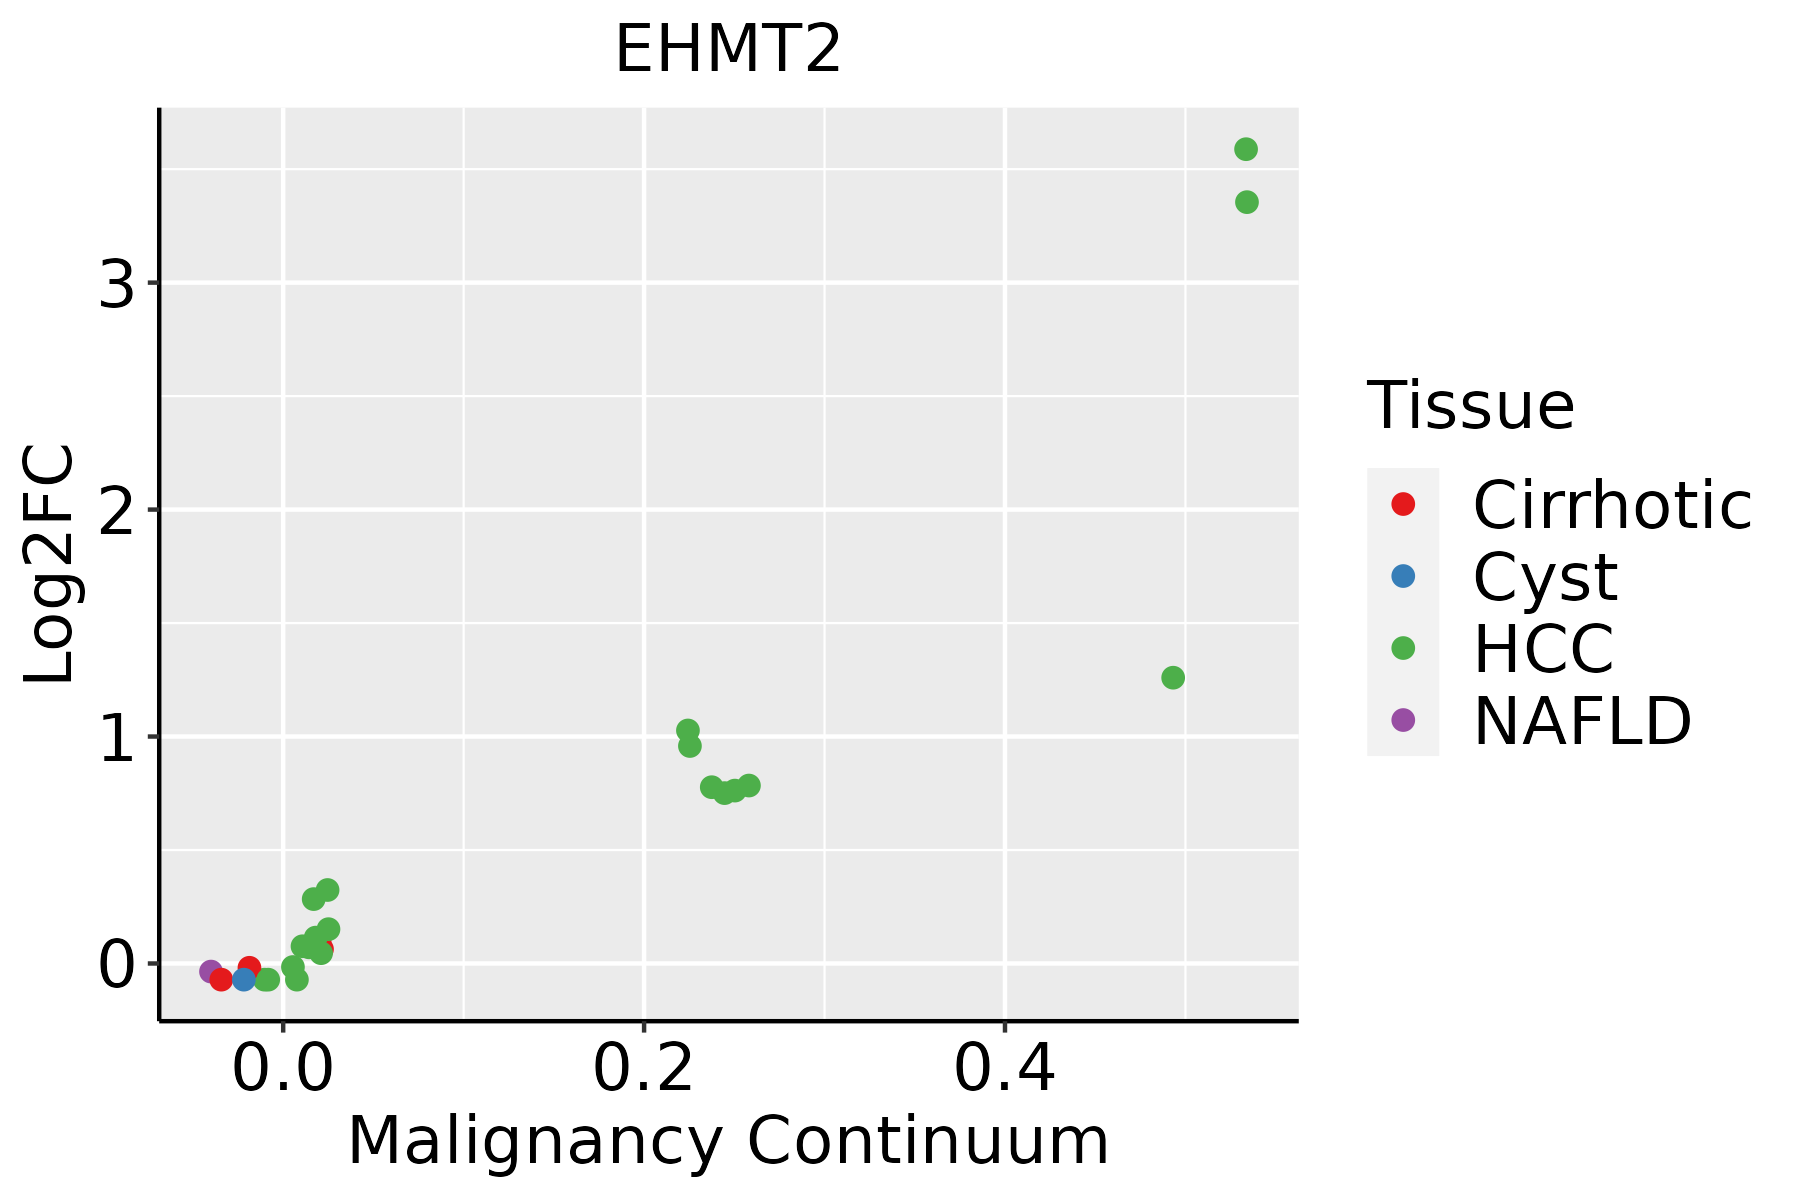 | HCC: Hepatocellular carcinoma |
| NAFLD: Non-alcoholic fatty liver disease |
| Oral Cavity | 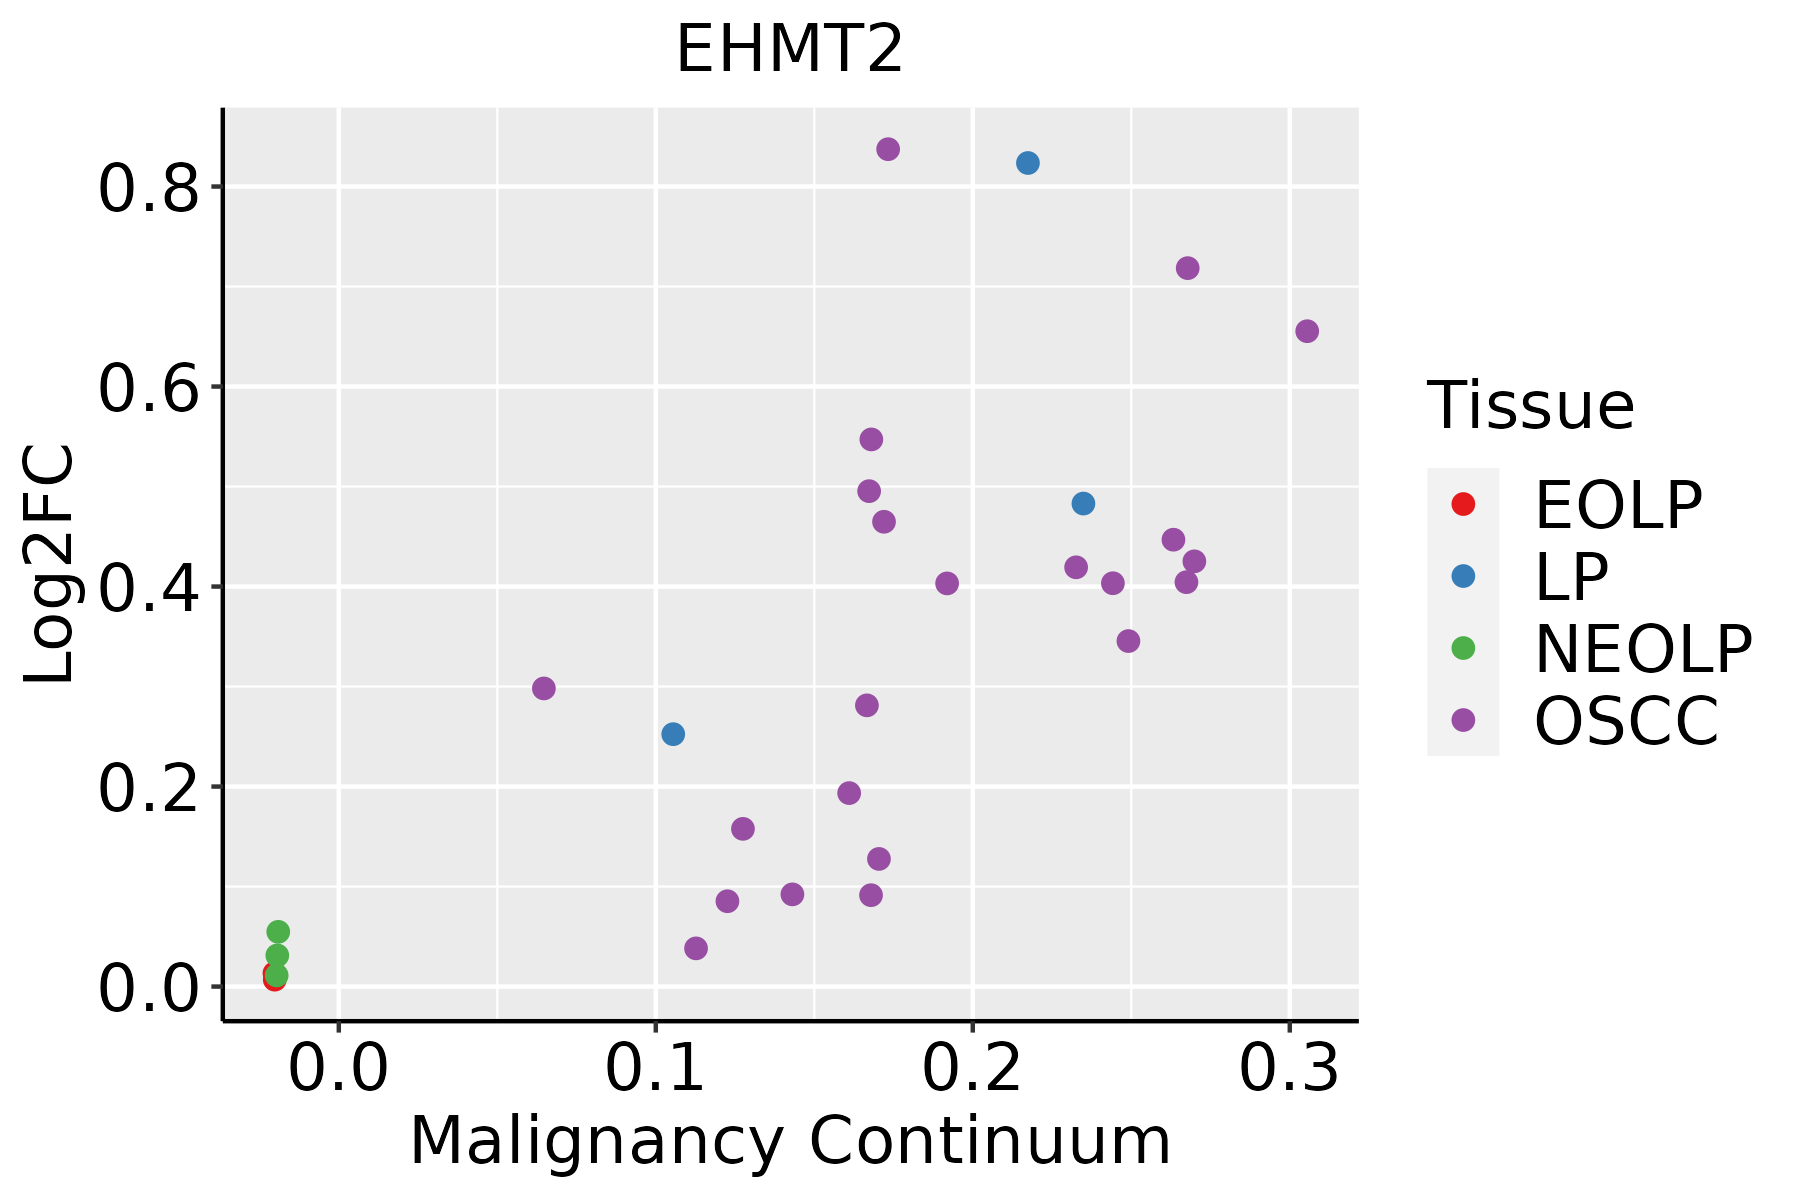 | EOLP: Erosive Oral lichen planus |
| LP: leukoplakia |
| NEOLP: Non-erosive oral lichen planus |
| OSCC: Oral squamous cell carcinoma |
| GO ID | Tissue | Disease Stage | Description | Gene Ratio | Bg Ratio | pvalue | p.adjust | Count |
| GO:0009895 | Colorectum | AD | negative regulation of catabolic process | 124/3918 | 320/18723 | 1.66e-13 | 3.35e-11 | 124 |
| GO:0031330 | Colorectum | AD | negative regulation of cellular catabolic process | 104/3918 | 262/18723 | 2.66e-12 | 3.96e-10 | 104 |
| GO:0010506 | Colorectum | AD | regulation of autophagy | 111/3918 | 317/18723 | 3.57e-09 | 2.35e-07 | 111 |
| GO:0016236 | Colorectum | AD | macroautophagy | 103/3918 | 291/18723 | 6.76e-09 | 4.15e-07 | 103 |
| GO:0010639 | Colorectum | AD | negative regulation of organelle organization | 114/3918 | 348/18723 | 1.41e-07 | 6.49e-06 | 114 |
| GO:0051052 | Colorectum | AD | regulation of DNA metabolic process | 116/3918 | 359/18723 | 2.47e-07 | 1.00e-05 | 116 |
| GO:0009636 | Colorectum | AD | response to toxic substance | 88/3918 | 262/18723 | 1.12e-06 | 3.72e-05 | 88 |
| GO:0031667 | Colorectum | AD | response to nutrient levels | 138/3918 | 474/18723 | 1.22e-05 | 2.68e-04 | 138 |
| GO:0016241 | Colorectum | AD | regulation of macroautophagy | 50/3918 | 141/18723 | 4.55e-05 | 7.92e-04 | 50 |
| GO:0042594 | Colorectum | AD | response to starvation | 63/3918 | 197/18723 | 1.77e-04 | 2.38e-03 | 63 |
| GO:0071496 | Colorectum | AD | cellular response to external stimulus | 94/3918 | 320/18723 | 1.98e-04 | 2.64e-03 | 94 |
| GO:0009410 | Colorectum | AD | response to xenobiotic stimulus | 128/3918 | 462/18723 | 2.69e-04 | 3.31e-03 | 128 |
| GO:0009267 | Colorectum | AD | cellular response to starvation | 51/3918 | 156/18723 | 3.90e-04 | 4.44e-03 | 51 |
| GO:0010507 | Colorectum | AD | negative regulation of autophagy | 31/3918 | 85/18723 | 6.91e-04 | 7.05e-03 | 31 |
| GO:0031668 | Colorectum | AD | cellular response to extracellular stimulus | 71/3918 | 246/18723 | 1.86e-03 | 1.52e-02 | 71 |
| GO:0031669 | Colorectum | AD | cellular response to nutrient levels | 63/3918 | 215/18723 | 2.19e-03 | 1.73e-02 | 63 |
| GO:0097305 | Colorectum | AD | response to alcohol | 71/3918 | 253/18723 | 4.01e-03 | 2.80e-02 | 71 |
| GO:0007033 | Colorectum | AD | vacuole organization | 53/3918 | 180/18723 | 4.18e-03 | 2.89e-02 | 53 |
| GO:0031056 | Colorectum | AD | regulation of histone modification | 45/3918 | 152/18723 | 7.05e-03 | 4.31e-02 | 45 |
| GO:00162361 | Colorectum | SER | macroautophagy | 79/2897 | 291/18723 | 1.97e-07 | 1.10e-05 | 79 |
| Pathway ID | Tissue | Disease Stage | Description | Gene Ratio | Bg Ratio | pvalue | p.adjust | qvalue | Count |
| hsa04211 | Colorectum | AD | Longevity regulating pathway | 33/2092 | 89/8465 | 6.15e-03 | 2.68e-02 | 1.71e-02 | 33 |
| hsa042111 | Colorectum | AD | Longevity regulating pathway | 33/2092 | 89/8465 | 6.15e-03 | 2.68e-02 | 1.71e-02 | 33 |
| hsa042112 | Colorectum | MSS | Longevity regulating pathway | 33/1875 | 89/8465 | 9.33e-04 | 5.58e-03 | 3.42e-03 | 33 |
| hsa003102 | Colorectum | MSS | Lysine degradation | 24/1875 | 63/8465 | 2.94e-03 | 1.39e-02 | 8.50e-03 | 24 |
| hsa042113 | Colorectum | MSS | Longevity regulating pathway | 33/1875 | 89/8465 | 9.33e-04 | 5.58e-03 | 3.42e-03 | 33 |
| hsa003103 | Colorectum | MSS | Lysine degradation | 24/1875 | 63/8465 | 2.94e-03 | 1.39e-02 | 8.50e-03 | 24 |
| hsa042114 | Colorectum | FAP | Longevity regulating pathway | 27/1404 | 89/8465 | 8.82e-04 | 5.20e-03 | 3.16e-03 | 27 |
| hsa042115 | Colorectum | FAP | Longevity regulating pathway | 27/1404 | 89/8465 | 8.82e-04 | 5.20e-03 | 3.16e-03 | 27 |
| hsa0421114 | Esophagus | ESCC | Longevity regulating pathway | 58/4205 | 89/8465 | 2.19e-03 | 6.16e-03 | 3.16e-03 | 58 |
| hsa0031010 | Esophagus | ESCC | Lysine degradation | 41/4205 | 63/8465 | 9.63e-03 | 2.27e-02 | 1.16e-02 | 41 |
| hsa0421115 | Esophagus | ESCC | Longevity regulating pathway | 58/4205 | 89/8465 | 2.19e-03 | 6.16e-03 | 3.16e-03 | 58 |
| hsa0031013 | Esophagus | ESCC | Lysine degradation | 41/4205 | 63/8465 | 9.63e-03 | 2.27e-02 | 1.16e-02 | 41 |
| hsa0031021 | Liver | Cirrhotic | Lysine degradation | 29/2530 | 63/8465 | 4.81e-03 | 1.74e-02 | 1.07e-02 | 29 |
| hsa042118 | Liver | Cirrhotic | Longevity regulating pathway | 37/2530 | 89/8465 | 1.22e-02 | 3.89e-02 | 2.40e-02 | 37 |
| hsa0031031 | Liver | Cirrhotic | Lysine degradation | 29/2530 | 63/8465 | 4.81e-03 | 1.74e-02 | 1.07e-02 | 29 |
| hsa0421111 | Liver | Cirrhotic | Longevity regulating pathway | 37/2530 | 89/8465 | 1.22e-02 | 3.89e-02 | 2.40e-02 | 37 |
| hsa0031041 | Liver | HCC | Lysine degradation | 47/4020 | 63/8465 | 1.02e-05 | 7.58e-05 | 4.22e-05 | 47 |
| hsa0421121 | Liver | HCC | Longevity regulating pathway | 61/4020 | 89/8465 | 4.46e-05 | 2.37e-04 | 1.32e-04 | 61 |
| hsa0031051 | Liver | HCC | Lysine degradation | 47/4020 | 63/8465 | 1.02e-05 | 7.58e-05 | 4.22e-05 | 47 |
| hsa0421131 | Liver | HCC | Longevity regulating pathway | 61/4020 | 89/8465 | 4.46e-05 | 2.37e-04 | 1.32e-04 | 61 |
| Hugo Symbol | Variant Class | Variant Classification | dbSNP RS | HGVSc | HGVSp | HGVSp Short | SWISSPROT | BIOTYPE | SIFT | PolyPhen | Tumor Sample Barcode | Tissue | Histology | Sex | Age | Stage | Therapy Types | Drugs | Outcome |
| EHMT2 | SNV | Missense_Mutation | | c.2509N>G | p.Thr837Ala | p.T837A | | protein_coding | tolerated(0.35) | benign(0.055) | TCGA-A8-A09Z-01 | Breast | breast invasive carcinoma | Female | >=65 | I/II | Unknown | Unknown | SD |
| EHMT2 | SNV | Missense_Mutation | | c.1972G>A | p.Ala658Thr | p.A658T | | protein_coding | deleterious(0.03) | possibly_damaging(0.621) | TCGA-EW-A3U0-01 | Breast | breast invasive carcinoma | Female | <65 | III/IV | Chemotherapy | cisplatin | CR |
| EHMT2 | SNV | Missense_Mutation | novel | c.1651A>T | p.Asn551Tyr | p.N551Y | | protein_coding | deleterious(0) | possibly_damaging(0.76) | TCGA-PE-A5DC-01 | Breast | breast invasive carcinoma | Female | >=65 | III/IV | Unknown | Unknown | SD |
| EHMT2 | insertion | Frame_Shift_Ins | novel | c.2932_2933insTAACA | p.Glu978ValfsTer10 | p.E978Vfs*10 | | protein_coding | | | TCGA-A2-A0EQ-01 | Breast | breast invasive carcinoma | Female | <65 | I/II | Chemotherapy | adriamycin | SD |
| EHMT2 | insertion | In_Frame_Ins | novel | c.2931_2932insCCCACTGTT | p.Ser977_Glu978insProThrVal | p.S977_E978insPTV | | protein_coding | | | TCGA-A2-A0EQ-01 | Breast | breast invasive carcinoma | Female | <65 | I/II | Chemotherapy | adriamycin | SD |
| EHMT2 | insertion | Frame_Shift_Ins | novel | c.659_660insTGTTGTA | p.Gly221ValfsTer5 | p.G221Vfs*5 | | protein_coding | | | TCGA-BH-A0HK-01 | Breast | breast invasive carcinoma | Female | >=65 | I/II | Hormone Therapy | arimidex | SD |
| EHMT2 | SNV | Missense_Mutation | | c.3496N>C | p.Asp1166His | p.D1166H | | protein_coding | tolerated(0.08) | benign(0.075) | TCGA-C5-A1MH-01 | Cervix | cervical & endocervical cancer | Female | >=65 | III/IV | Chemotherapy | cisplatin | PD |
| EHMT2 | SNV | Missense_Mutation | novel | c.2734N>A | p.Asp912Asn | p.D912N | | protein_coding | tolerated(0.06) | benign(0.186) | TCGA-EK-A2RC-01 | Cervix | cervical & endocervical cancer | Female | <65 | I/II | Unknown | Unknown | SD |
| EHMT2 | SNV | Missense_Mutation | | c.3141N>C | p.Trp1047Cys | p.W1047C | | protein_coding | tolerated(0.05) | possibly_damaging(0.732) | TCGA-IR-A3LH-01 | Cervix | cervical & endocervical cancer | Female | <65 | I/II | Chemotherapy | cisplatin | CR |
| EHMT2 | SNV | Missense_Mutation | | c.2911N>A | p.Glu971Lys | p.E971K | | protein_coding | tolerated(0.33) | benign(0.106) | TCGA-JW-A5VL-01 | Cervix | cervical & endocervical cancer | Female | <65 | I/II | Unknown | Unknown | SD |
| Entrez ID | Symbol | Category | Interaction Types | Drug Claim Name | Drug Name | PMIDs |
| 10919 | EHMT2 | METHYL TRANSFERASE, ENZYME, DRUGGABLE GENOME | | LISINOPRIL HYDRATE | LISINOPRIL HYDRATE | |
| 10919 | EHMT2 | METHYL TRANSFERASE, ENZYME, DRUGGABLE GENOME | | DYCLONINE | DYCLONINE | |
| 10919 | EHMT2 | METHYL TRANSFERASE, ENZYME, DRUGGABLE GENOME | | SJ000114950 | CHEMBL606456 | |
| 10919 | EHMT2 | METHYL TRANSFERASE, ENZYME, DRUGGABLE GENOME | | WIN-552122 | WIN-552122 | |
| 10919 | EHMT2 | METHYL TRANSFERASE, ENZYME, DRUGGABLE GENOME | | HISTAMINE | HISTAMINE | |
| 10919 | EHMT2 | METHYL TRANSFERASE, ENZYME, DRUGGABLE GENOME | | N-(3-METHOXYPHENYL)ANTHRANILIC ACID | CHEMBL1328677 | |
| 10919 | EHMT2 | METHYL TRANSFERASE, ENZYME, DRUGGABLE GENOME | | MEDRONIC ACID | MEDRONIC ACID | |
| 10919 | EHMT2 | METHYL TRANSFERASE, ENZYME, DRUGGABLE GENOME | | SJ000014858 | CHEMBL591628 | |
| 10919 | EHMT2 | METHYL TRANSFERASE, ENZYME, DRUGGABLE GENOME | | TELMISARTAN | TELMISARTAN | |
| 10919 | EHMT2 | METHYL TRANSFERASE, ENZYME, DRUGGABLE GENOME | | GNF-PF-989 | CHEMBL583150 | |


