| Tissue | Expression Dynamics | Abbreviation |
| Cervix |  | CC: Cervix cancer |
| HSIL_HPV: HPV-infected high-grade squamous intraepithelial lesions |
| N_HPV: HPV-infected normal cervix |
| Colorectum (GSE201348) |  | FAP: Familial adenomatous polyposis |
| CRC: Colorectal cancer |
| Colorectum (HTA11) |  | AD: Adenomas |
| SER: Sessile serrated lesions |
| MSI-H: Microsatellite-high colorectal cancer |
| MSS: Microsatellite stable colorectal cancer |
| Endometrium |  | AEH: Atypical endometrial hyperplasia |
| EEC: Endometrioid Cancer |
| Esophagus | 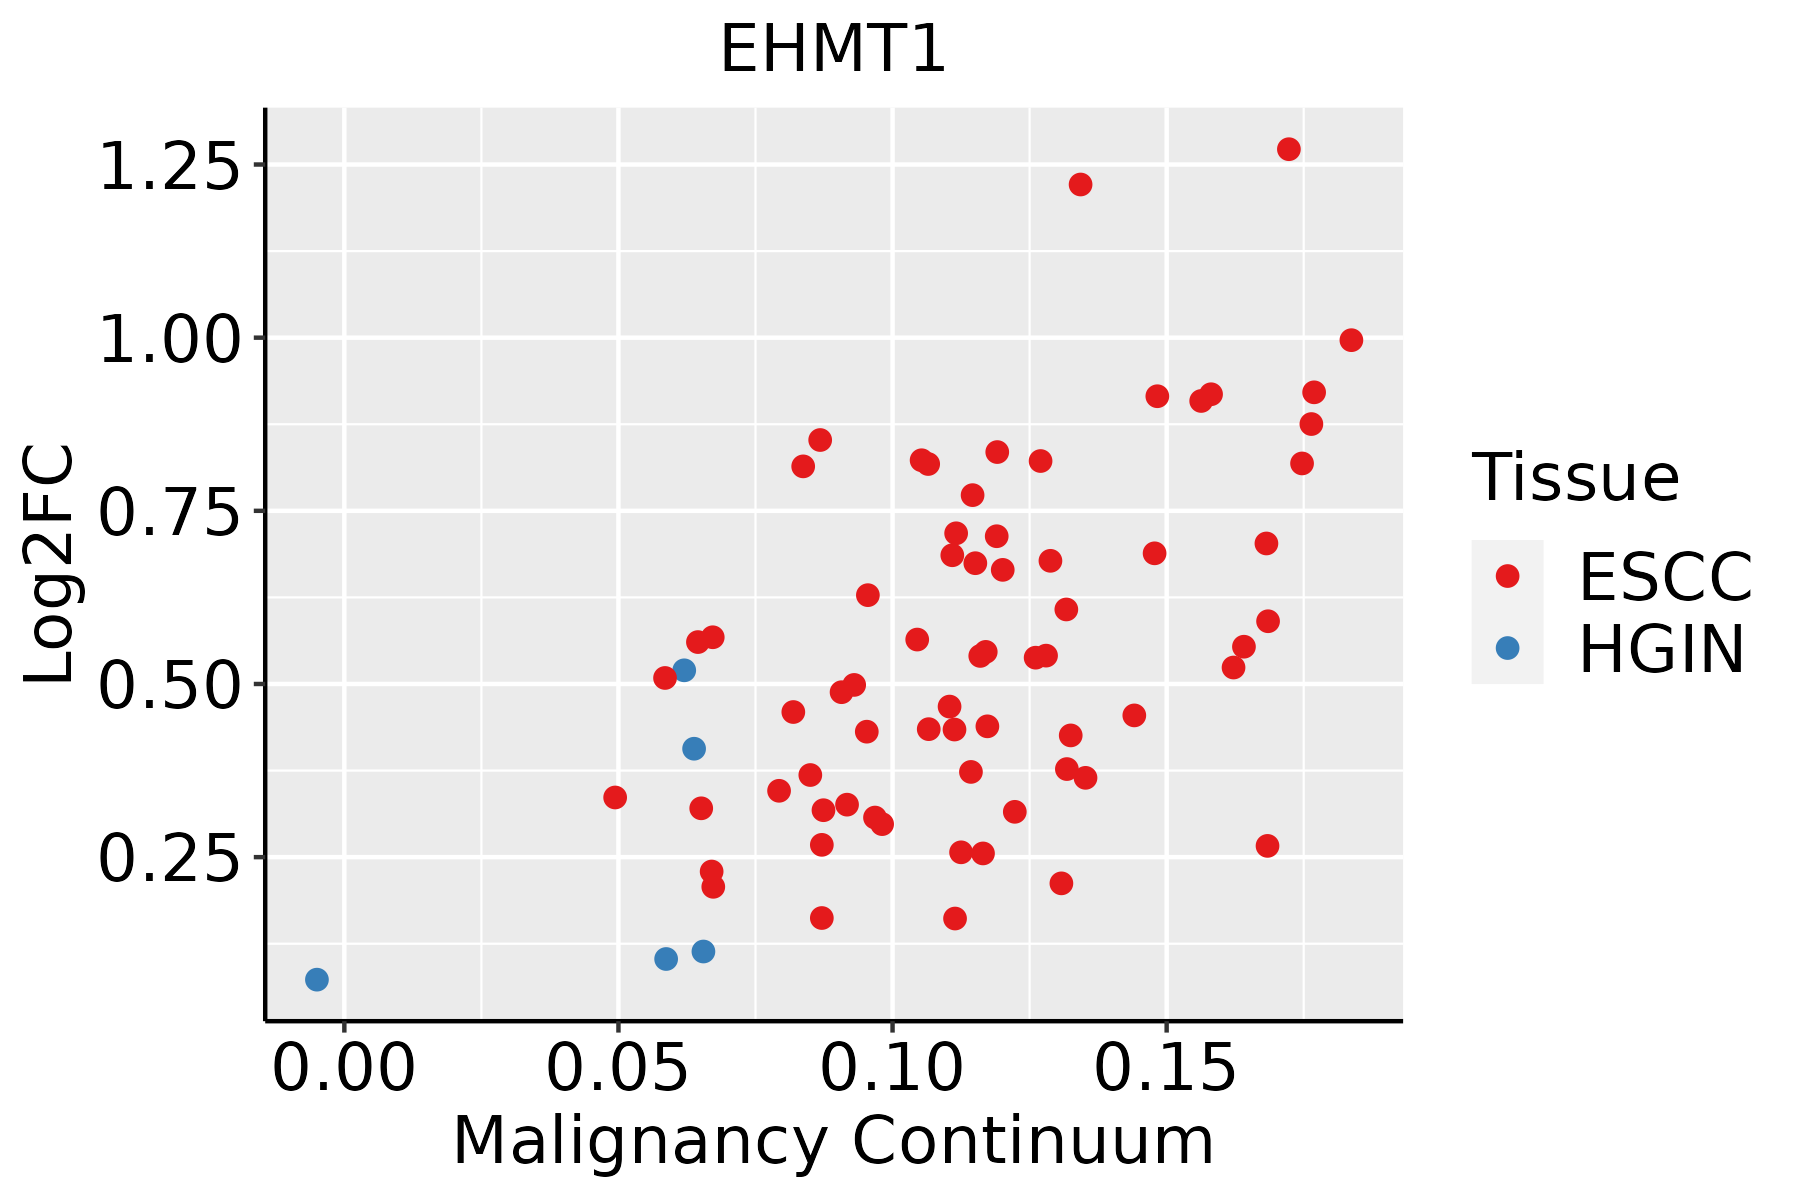 | ESCC: Esophageal squamous cell carcinoma |
| HGIN: High-grade intraepithelial neoplasias |
| LGIN: Low-grade intraepithelial neoplasias |
| Liver | 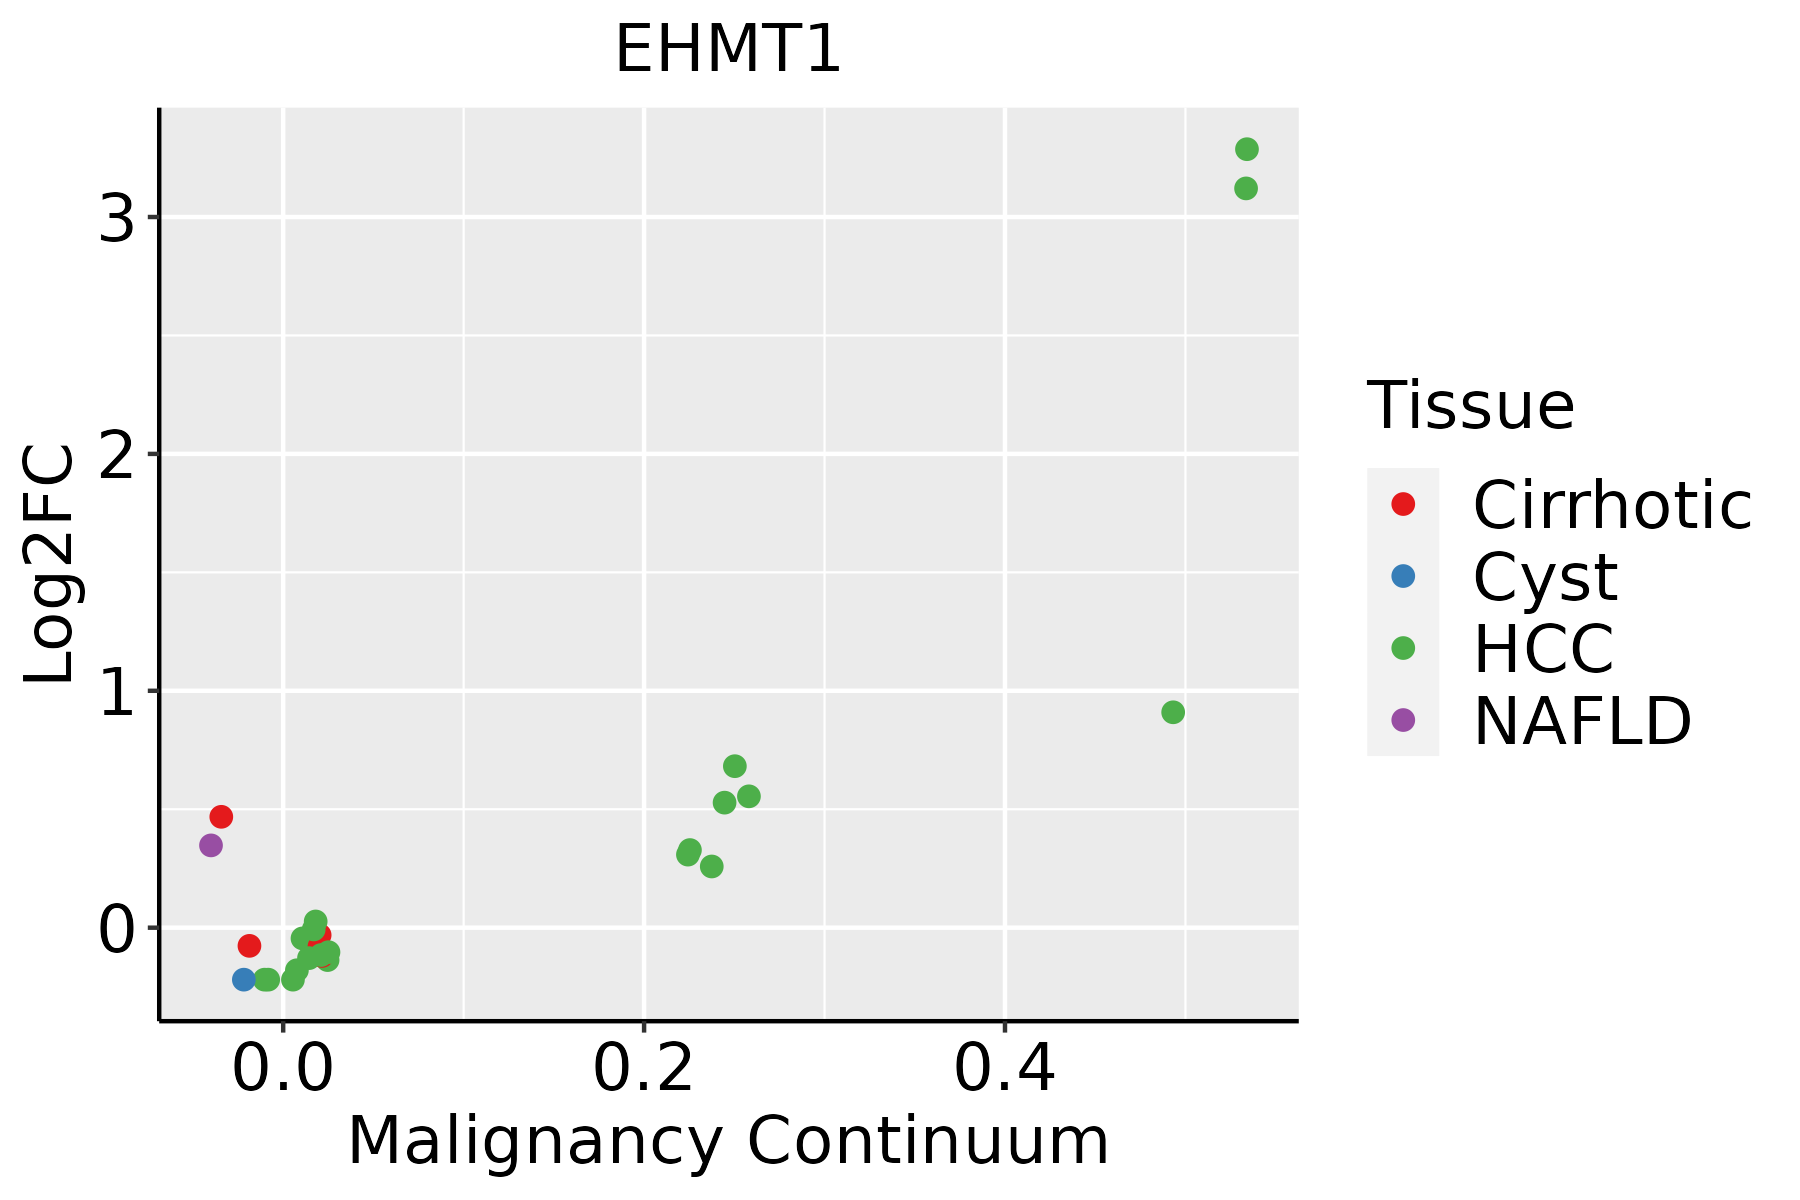 | HCC: Hepatocellular carcinoma |
| NAFLD: Non-alcoholic fatty liver disease |
| Oral Cavity |  | EOLP: Erosive Oral lichen planus |
| LP: leukoplakia |
| NEOLP: Non-erosive oral lichen planus |
| OSCC: Oral squamous cell carcinoma |
| Prostate | 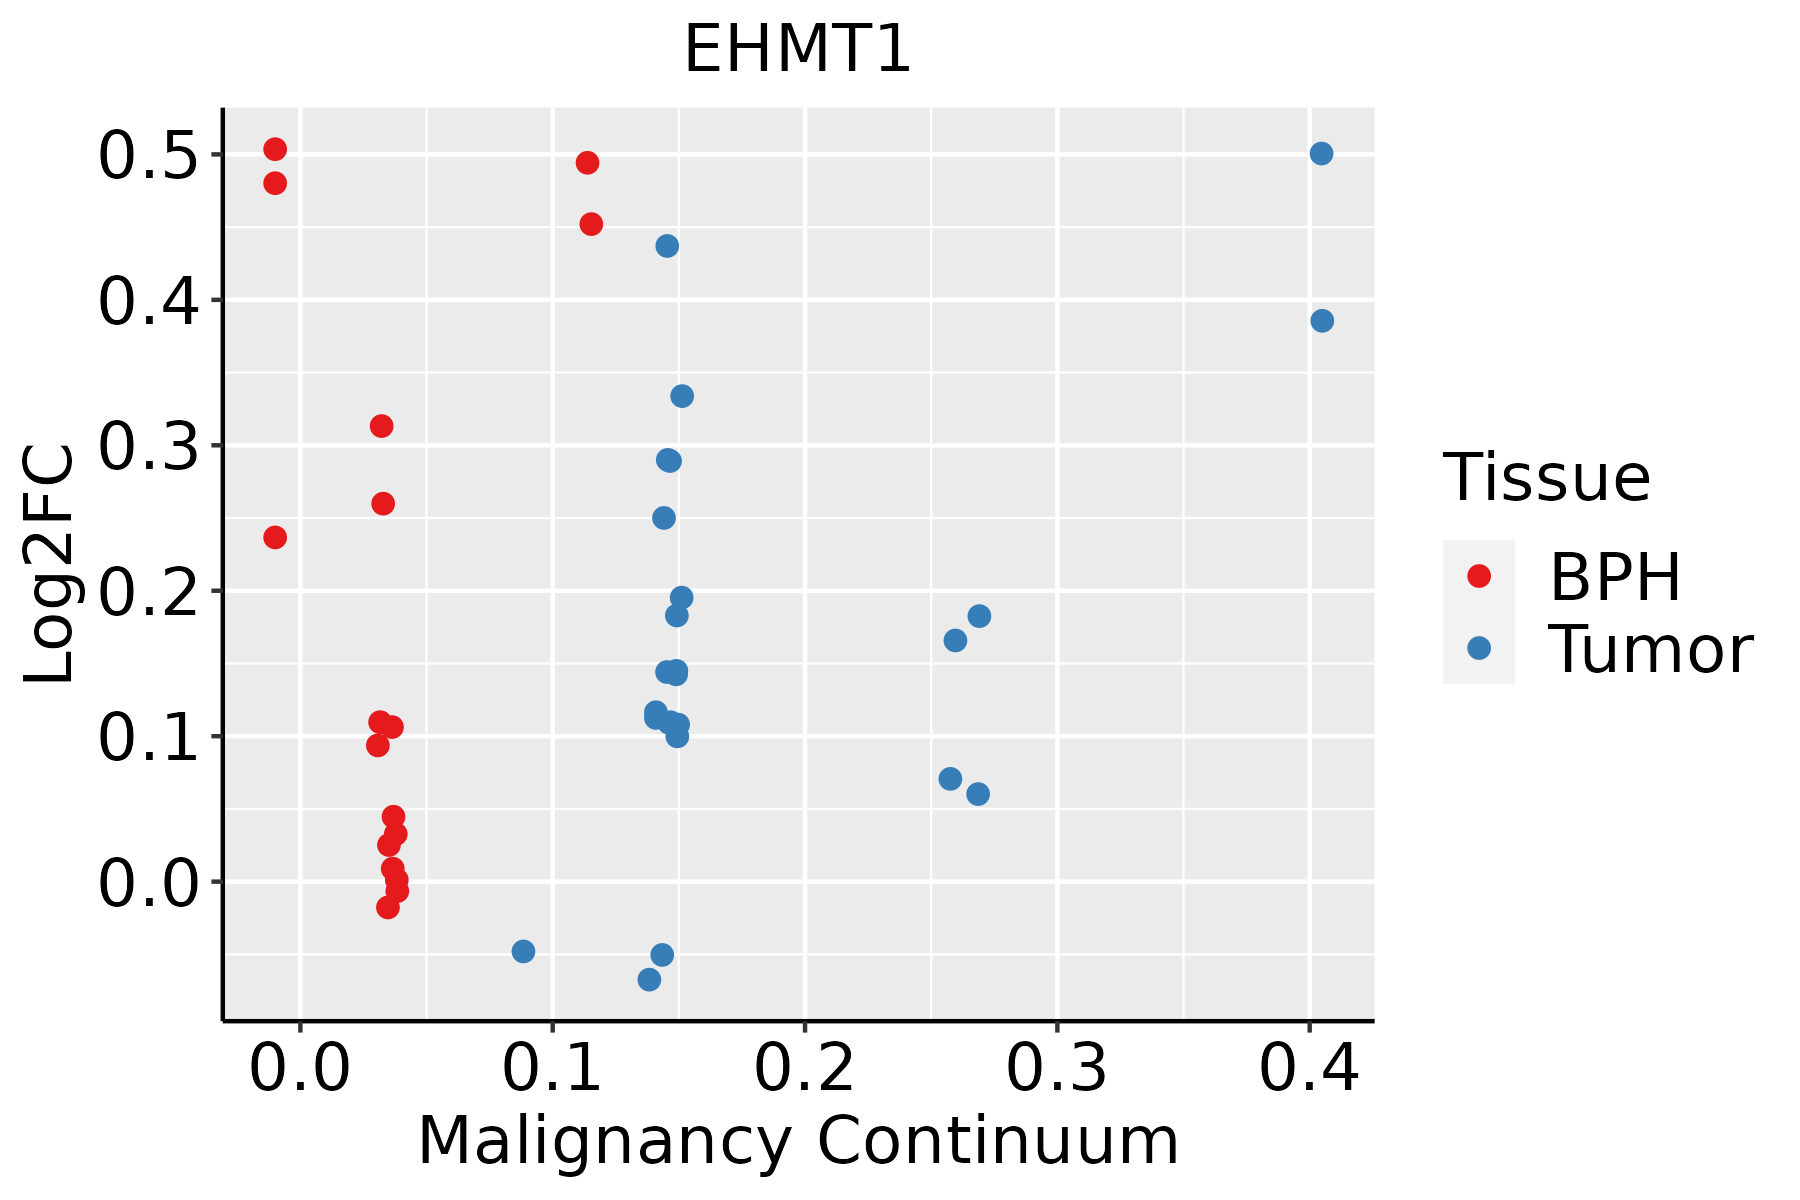 | BPH: Benign Prostatic Hyperplasia |
| Skin |  | AK: Actinic keratosis |
| cSCC: Cutaneous squamous cell carcinoma |
| SCCIS:squamous cell carcinoma in situ |
| Thyroid |  | ATC: Anaplastic thyroid cancer |
| HT: Hashimoto's thyroiditis |
| PTC: Papillary thyroid cancer |
| GO ID | Tissue | Disease Stage | Description | Gene Ratio | Bg Ratio | pvalue | p.adjust | Count |
| GO:00063257 | Cervix | CC | chromatin organization | 78/2311 | 409/18723 | 5.40e-05 | 8.02e-04 | 78 |
| GO:00165705 | Cervix | CC | histone modification | 84/2311 | 463/18723 | 1.70e-04 | 2.01e-03 | 84 |
| GO:00459955 | Cervix | CC | regulation of embryonic development | 19/2311 | 64/18723 | 1.78e-04 | 2.09e-03 | 19 |
| GO:00096369 | Cervix | CC | response to toxic substance | 52/2311 | 262/18723 | 3.34e-04 | 3.52e-03 | 52 |
| GO:00349685 | Cervix | CC | histone lysine methylation | 27/2311 | 115/18723 | 6.61e-04 | 6.09e-03 | 27 |
| GO:00165715 | Cervix | CC | histone methylation | 30/2311 | 141/18723 | 1.88e-03 | 1.39e-02 | 30 |
| GO:00180224 | Cervix | CC | peptidyl-lysine methylation | 28/2311 | 131/18723 | 2.43e-03 | 1.71e-02 | 28 |
| GO:00064795 | Cervix | CC | protein methylation | 36/2311 | 181/18723 | 2.46e-03 | 1.71e-02 | 36 |
| GO:00082135 | Cervix | CC | protein alkylation | 36/2311 | 181/18723 | 2.46e-03 | 1.71e-02 | 36 |
| GO:00182054 | Cervix | CC | peptidyl-lysine modification | 62/2311 | 376/18723 | 1.04e-02 | 4.97e-02 | 62 |
| GO:0009636 | Colorectum | AD | response to toxic substance | 88/3918 | 262/18723 | 1.12e-06 | 3.72e-05 | 88 |
| GO:0006325 | Colorectum | AD | chromatin organization | 119/3918 | 409/18723 | 4.85e-05 | 8.33e-04 | 119 |
| GO:0045995 | Colorectum | AD | regulation of embryonic development | 24/3918 | 64/18723 | 1.72e-03 | 1.43e-02 | 24 |
| GO:0120162 | Colorectum | AD | positive regulation of cold-induced thermogenesis | 32/3918 | 97/18723 | 3.74e-03 | 2.63e-02 | 32 |
| GO:0106106 | Colorectum | AD | cold-induced thermogenesis | 43/3918 | 144/18723 | 7.05e-03 | 4.31e-02 | 43 |
| GO:0120161 | Colorectum | AD | regulation of cold-induced thermogenesis | 43/3918 | 144/18723 | 7.05e-03 | 4.31e-02 | 43 |
| GO:1990845 | Colorectum | AD | adaptive thermogenesis | 46/3918 | 157/18723 | 7.97e-03 | 4.73e-02 | 46 |
| GO:00096361 | Colorectum | SER | response to toxic substance | 71/2897 | 262/18723 | 8.63e-07 | 4.07e-05 | 71 |
| GO:00063251 | Colorectum | SER | chromatin organization | 89/2897 | 409/18723 | 4.15e-04 | 6.17e-03 | 89 |
| GO:0051567 | Colorectum | SER | histone H3-K9 methylation | 13/2897 | 37/18723 | 2.60e-03 | 2.40e-02 | 13 |
| Pathway ID | Tissue | Disease Stage | Description | Gene Ratio | Bg Ratio | pvalue | p.adjust | qvalue | Count |
| hsa00310 | Colorectum | AD | Lysine degradation | 27/2092 | 63/8465 | 1.17e-03 | 7.75e-03 | 4.94e-03 | 27 |
| hsa04211 | Colorectum | AD | Longevity regulating pathway | 33/2092 | 89/8465 | 6.15e-03 | 2.68e-02 | 1.71e-02 | 33 |
| hsa003101 | Colorectum | AD | Lysine degradation | 27/2092 | 63/8465 | 1.17e-03 | 7.75e-03 | 4.94e-03 | 27 |
| hsa042111 | Colorectum | AD | Longevity regulating pathway | 33/2092 | 89/8465 | 6.15e-03 | 2.68e-02 | 1.71e-02 | 33 |
| hsa042112 | Colorectum | MSS | Longevity regulating pathway | 33/1875 | 89/8465 | 9.33e-04 | 5.58e-03 | 3.42e-03 | 33 |
| hsa003102 | Colorectum | MSS | Lysine degradation | 24/1875 | 63/8465 | 2.94e-03 | 1.39e-02 | 8.50e-03 | 24 |
| hsa042113 | Colorectum | MSS | Longevity regulating pathway | 33/1875 | 89/8465 | 9.33e-04 | 5.58e-03 | 3.42e-03 | 33 |
| hsa003103 | Colorectum | MSS | Lysine degradation | 24/1875 | 63/8465 | 2.94e-03 | 1.39e-02 | 8.50e-03 | 24 |
| hsa003104 | Colorectum | FAP | Lysine degradation | 23/1404 | 63/8465 | 1.04e-04 | 9.46e-04 | 5.76e-04 | 23 |
| hsa042114 | Colorectum | FAP | Longevity regulating pathway | 27/1404 | 89/8465 | 8.82e-04 | 5.20e-03 | 3.16e-03 | 27 |
| hsa003105 | Colorectum | FAP | Lysine degradation | 23/1404 | 63/8465 | 1.04e-04 | 9.46e-04 | 5.76e-04 | 23 |
| hsa042115 | Colorectum | FAP | Longevity regulating pathway | 27/1404 | 89/8465 | 8.82e-04 | 5.20e-03 | 3.16e-03 | 27 |
| hsa003106 | Colorectum | CRC | Lysine degradation | 18/1091 | 63/8465 | 7.21e-04 | 6.34e-03 | 4.30e-03 | 18 |
| hsa042116 | Colorectum | CRC | Longevity regulating pathway | 20/1091 | 89/8465 | 8.36e-03 | 3.93e-02 | 2.66e-02 | 20 |
| hsa003107 | Colorectum | CRC | Lysine degradation | 18/1091 | 63/8465 | 7.21e-04 | 6.34e-03 | 4.30e-03 | 18 |
| hsa042117 | Colorectum | CRC | Longevity regulating pathway | 20/1091 | 89/8465 | 8.36e-03 | 3.93e-02 | 2.66e-02 | 20 |
| hsa0421114 | Esophagus | ESCC | Longevity regulating pathway | 58/4205 | 89/8465 | 2.19e-03 | 6.16e-03 | 3.16e-03 | 58 |
| hsa0031010 | Esophagus | ESCC | Lysine degradation | 41/4205 | 63/8465 | 9.63e-03 | 2.27e-02 | 1.16e-02 | 41 |
| hsa0421115 | Esophagus | ESCC | Longevity regulating pathway | 58/4205 | 89/8465 | 2.19e-03 | 6.16e-03 | 3.16e-03 | 58 |
| hsa0031013 | Esophagus | ESCC | Lysine degradation | 41/4205 | 63/8465 | 9.63e-03 | 2.27e-02 | 1.16e-02 | 41 |
| Hugo Symbol | Variant Class | Variant Classification | dbSNP RS | HGVSc | HGVSp | HGVSp Short | SWISSPROT | BIOTYPE | SIFT | PolyPhen | Tumor Sample Barcode | Tissue | Histology | Sex | Age | Stage | Therapy Types | Drugs | Outcome |
| EHMT1 | SNV | Missense_Mutation | | c.2330N>G | p.Leu777Arg | p.L777R | Q9H9B1 | protein_coding | deleterious(0) | probably_damaging(1) | TCGA-A2-A04U-01 | Breast | breast invasive carcinoma | Female | <65 | I/II | Chemotherapy | adriamycin | SD |
| EHMT1 | SNV | Missense_Mutation | novel | c.3146N>T | p.Pro1049Leu | p.P1049L | Q9H9B1 | protein_coding | deleterious(0.03) | possibly_damaging(0.868) | TCGA-A8-A06X-01 | Breast | breast invasive carcinoma | Female | >=65 | I/II | Unknown | Unknown | SD |
| EHMT1 | SNV | Missense_Mutation | novel | c.848C>T | p.Ala283Val | p.A283V | Q9H9B1 | protein_coding | deleterious_low_confidence(0.05) | probably_damaging(0.99) | TCGA-A8-A09M-01 | Breast | breast invasive carcinoma | Female | >=65 | III/IV | Chemotherapy | paclitaxel | CR |
| EHMT1 | SNV | Missense_Mutation | | c.3092G>T | p.Ser1031Ile | p.S1031I | Q9H9B1 | protein_coding | deleterious(0.01) | possibly_damaging(0.799) | TCGA-A8-A09Z-01 | Breast | breast invasive carcinoma | Female | >=65 | I/II | Unknown | Unknown | SD |
| EHMT1 | SNV | Missense_Mutation | novel | c.877N>G | p.Met293Val | p.M293V | Q9H9B1 | protein_coding | deleterious_low_confidence(0) | possibly_damaging(0.867) | TCGA-AC-A23H-01 | Breast | breast invasive carcinoma | Female | >=65 | I/II | Unknown | Unknown | PD |
| EHMT1 | SNV | Missense_Mutation | novel | c.769C>A | p.His257Asn | p.H257N | Q9H9B1 | protein_coding | deleterious_low_confidence(0.04) | possibly_damaging(0.476) | TCGA-AC-A5XS-01 | Breast | breast invasive carcinoma | Female | >=65 | I/II | Hormone Therapy | femara | SD |
| EHMT1 | SNV | Missense_Mutation | novel | c.3704G>C | p.Gly1235Ala | p.G1235A | Q9H9B1 | protein_coding | deleterious(0) | possibly_damaging(0.889) | TCGA-AR-A5QQ-01 | Breast | breast invasive carcinoma | Female | >=65 | III/IV | Chemotherapy | carboplatin | PD |
| EHMT1 | SNV | Missense_Mutation | rs761131393 | c.838N>T | p.Val280Phe | p.V280F | Q9H9B1 | protein_coding | tolerated_low_confidence(0.09) | possibly_damaging(0.564) | TCGA-BH-A0BM-01 | Breast | breast invasive carcinoma | Female | <65 | I/II | Chemotherapy | adriamycin | SD |
| EHMT1 | SNV | Missense_Mutation | | c.1037N>C | p.Met346Thr | p.M346T | Q9H9B1 | protein_coding | tolerated_low_confidence(0.11) | benign(0.022) | TCGA-BH-A18G-01 | Breast | breast invasive carcinoma | Female | >=65 | I/II | Unknown | Unknown | SD |
| EHMT1 | SNV | Missense_Mutation | rs761131393 | c.838G>T | p.Val280Phe | p.V280F | Q9H9B1 | protein_coding | tolerated_low_confidence(0.09) | possibly_damaging(0.564) | TCGA-C8-A137-01 | Breast | breast invasive carcinoma | Female | <65 | I/II | Unknown | Unknown | PD |


