
|
|||||
|
 | |
| |
| |
| |
| |
| |
|
Gene: EHHADH |
Gene summary for EHHADH |
| Gene information | Species | Human | Gene symbol | EHHADH | Gene ID | 1962 |
| Gene name | enoyl-CoA hydratase and 3-hydroxyacyl CoA dehydrogenase | |
| Gene Alias | ECHD | |
| Cytomap | 3q27.2 | |
| Gene Type | protein-coding | GO ID | GO:0006082 | UniProtAcc | Q08426 |
Top |
Malignant transformation analysis |
| Identification of the aberrant gene expression in precancerous and cancerous lesions by comparing the gene expression of stem-like cells in diseased tissues with normal stem cells |
| Entrez ID | Symbol | Replicates | Species | Organ | Tissue | Adj P-value | Log2FC | Malignancy |
| 1962 | EHHADH | NAFLD1 | Human | Liver | NAFLD | 4.44e-15 | 1.12e+00 | -0.04 |
| 1962 | EHHADH | S43 | Human | Liver | Cirrhotic | 7.61e-06 | -1.21e-01 | -0.0187 |
| 1962 | EHHADH | HCC1_Meng | Human | Liver | HCC | 2.66e-86 | 1.19e-01 | 0.0246 |
| 1962 | EHHADH | HCC2_Meng | Human | Liver | HCC | 2.27e-12 | -1.59e-01 | 0.0107 |
| 1962 | EHHADH | cirrhotic1 | Human | Liver | Cirrhotic | 6.61e-05 | -2.16e-01 | 0.0202 |
| 1962 | EHHADH | cirrhotic2 | Human | Liver | Cirrhotic | 2.23e-03 | -1.89e-01 | 0.0201 |
| 1962 | EHHADH | HCC1 | Human | Liver | HCC | 4.33e-19 | 4.65e+00 | 0.5336 |
| 1962 | EHHADH | HCC2 | Human | Liver | HCC | 1.04e-26 | 4.07e+00 | 0.5341 |
| Page: 1 |
| Tissue | Expression Dynamics | Abbreviation |
| Liver | 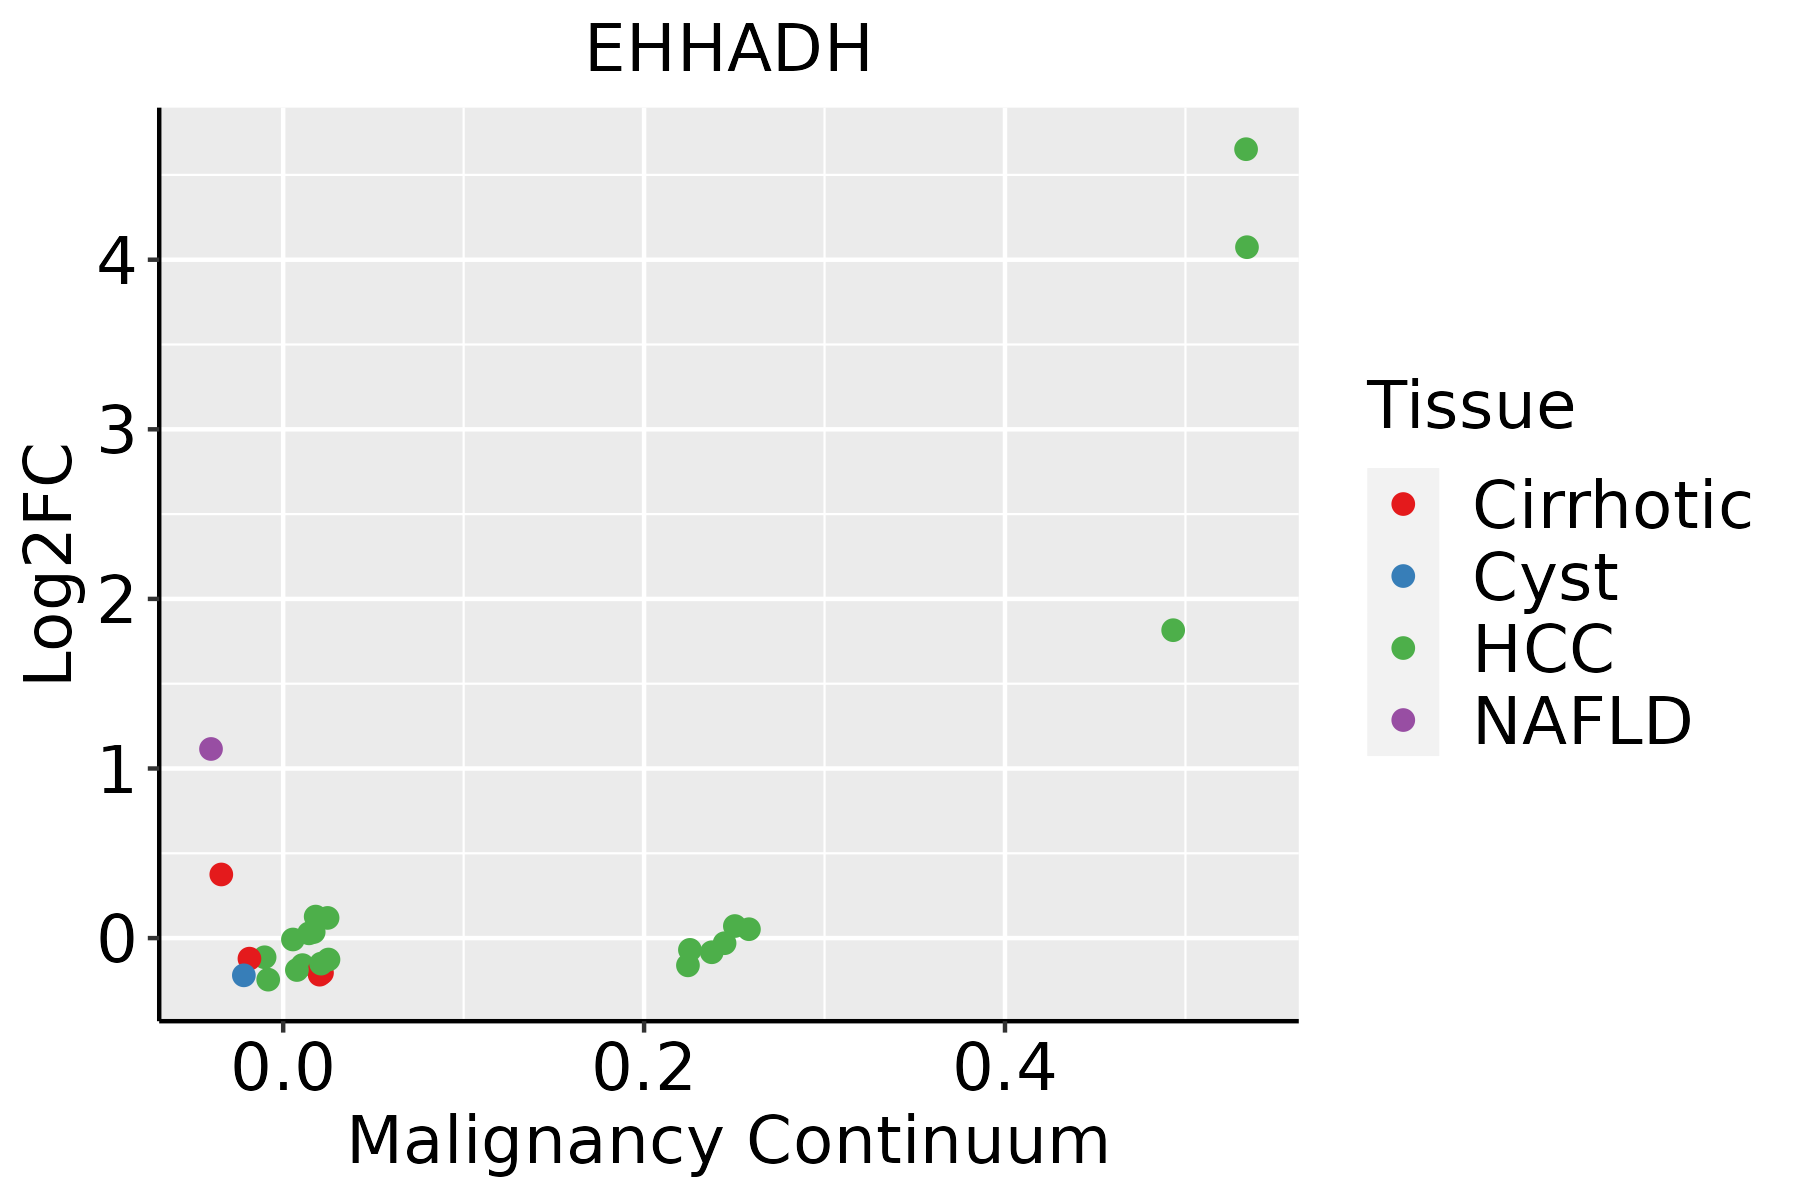 | HCC: Hepatocellular carcinoma |
| NAFLD: Non-alcoholic fatty liver disease |
| ∗log2FC in expression of this searched gene in stem-like cells from each diseased tissue sample relative to stem-like cells in normal samples in each tissue plotted against the malignancy continuum. Samples are colored based on if they are from different disease stage. |
Top |
Malignant transformation related pathway analysis |
| Find out the enriched GO biological processes and KEGG pathways involved in transition from healthy to precancer to cancer |
| Tissue | Disease Stage | Enriched GO biological Processes |
| Colorectum | AD |  |
| Colorectum | SER |  |
| Colorectum | MSS |  |
| Colorectum | MSI-H |  |
| Colorectum | FAP |  |
| ∗Top 15 enriched GO BP terms are showed in the bar plot of each disease state in each tissue. Each row represents a significant GO biological process which is colored according to the -log10(p.adjust). |
| Page: 1 2 3 4 5 6 7 8 9 |
| GO ID | Tissue | Disease Stage | Description | Gene Ratio | Bg Ratio | pvalue | p.adjust | Count |
| GO:00463953 | Liver | NAFLD | carboxylic acid catabolic process | 73/1882 | 236/18723 | 4.16e-19 | 1.22e-15 | 73 |
| GO:00160544 | Liver | NAFLD | organic acid catabolic process | 73/1882 | 240/18723 | 1.20e-18 | 2.34e-15 | 73 |
| GO:00442825 | Liver | NAFLD | small molecule catabolic process | 91/1882 | 376/18723 | 8.96e-16 | 1.31e-12 | 91 |
| GO:00066316 | Liver | NAFLD | fatty acid metabolic process | 92/1882 | 390/18723 | 3.38e-15 | 3.29e-12 | 92 |
| GO:00723295 | Liver | NAFLD | monocarboxylic acid catabolic process | 39/1882 | 122/18723 | 2.40e-11 | 8.77e-09 | 39 |
| GO:00090626 | Liver | NAFLD | fatty acid catabolic process | 34/1882 | 100/18723 | 6.81e-11 | 1.99e-08 | 34 |
| GO:00193956 | Liver | NAFLD | fatty acid oxidation | 33/1882 | 103/18723 | 7.58e-10 | 1.53e-07 | 33 |
| GO:00442425 | Liver | NAFLD | cellular lipid catabolic process | 52/1882 | 214/18723 | 1.15e-09 | 2.17e-07 | 52 |
| GO:00344405 | Liver | NAFLD | lipid oxidation | 33/1882 | 108/18723 | 2.96e-09 | 4.56e-07 | 33 |
| GO:00302585 | Liver | NAFLD | lipid modification | 49/1882 | 212/18723 | 1.97e-08 | 2.17e-06 | 49 |
| GO:00160426 | Liver | NAFLD | lipid catabolic process | 63/1882 | 320/18723 | 1.35e-07 | 1.02e-05 | 63 |
| GO:00066356 | Liver | NAFLD | fatty acid beta-oxidation | 23/1882 | 74/18723 | 5.09e-07 | 3.07e-05 | 23 |
| GO:0033540 | Liver | NAFLD | fatty acid beta-oxidation using acyl-CoA oxidase | 5/1882 | 12/18723 | 4.41e-03 | 3.57e-02 | 5 |
| GO:000663112 | Liver | Cirrhotic | fatty acid metabolic process | 165/4634 | 390/18723 | 1.29e-14 | 1.26e-12 | 165 |
| GO:004428211 | Liver | Cirrhotic | small molecule catabolic process | 151/4634 | 376/18723 | 2.20e-11 | 1.34e-09 | 151 |
| GO:001605411 | Liver | Cirrhotic | organic acid catabolic process | 104/4634 | 240/18723 | 1.91e-10 | 9.53e-09 | 104 |
| GO:004639511 | Liver | Cirrhotic | carboxylic acid catabolic process | 102/4634 | 236/18723 | 3.41e-10 | 1.63e-08 | 102 |
| GO:001939512 | Liver | Cirrhotic | fatty acid oxidation | 53/4634 | 103/18723 | 4.73e-09 | 1.88e-07 | 53 |
| GO:003444011 | Liver | Cirrhotic | lipid oxidation | 53/4634 | 108/18723 | 3.85e-08 | 1.27e-06 | 53 |
| GO:007232911 | Liver | Cirrhotic | monocarboxylic acid catabolic process | 56/4634 | 122/18723 | 2.87e-07 | 7.01e-06 | 56 |
| Page: 1 2 |
| Pathway ID | Tissue | Disease Stage | Description | Gene Ratio | Bg Ratio | pvalue | p.adjust | qvalue | Count |
| hsa002806 | Liver | NAFLD | Valine, leucine and isoleucine degradation | 20/1043 | 48/8465 | 3.03e-07 | 1.65e-05 | 1.33e-05 | 20 |
| hsa033206 | Liver | NAFLD | PPAR signaling pathway | 25/1043 | 75/8465 | 1.61e-06 | 6.62e-05 | 5.33e-05 | 25 |
| hsa003108 | Liver | NAFLD | Lysine degradation | 21/1043 | 63/8465 | 1.09e-05 | 3.58e-04 | 2.89e-04 | 21 |
| hsa00650 | Liver | NAFLD | Butanoate metabolism | 11/1043 | 27/8465 | 1.88e-04 | 3.62e-03 | 2.92e-03 | 11 |
| hsa0064010 | Liver | NAFLD | Propanoate metabolism | 12/1043 | 32/8465 | 2.44e-04 | 4.45e-03 | 3.58e-03 | 12 |
| hsa012126 | Liver | NAFLD | Fatty acid metabolism | 17/1043 | 57/8465 | 3.43e-04 | 5.93e-03 | 4.78e-03 | 17 |
| hsa000718 | Liver | NAFLD | Fatty acid degradation | 13/1043 | 43/8465 | 1.46e-03 | 1.71e-02 | 1.38e-02 | 13 |
| hsa04146 | Liver | NAFLD | Peroxisome | 19/1043 | 82/8465 | 4.37e-03 | 4.10e-02 | 3.30e-02 | 19 |
| hsa0028011 | Liver | NAFLD | Valine, leucine and isoleucine degradation | 20/1043 | 48/8465 | 3.03e-07 | 1.65e-05 | 1.33e-05 | 20 |
| hsa0332011 | Liver | NAFLD | PPAR signaling pathway | 25/1043 | 75/8465 | 1.61e-06 | 6.62e-05 | 5.33e-05 | 25 |
| hsa0031011 | Liver | NAFLD | Lysine degradation | 21/1043 | 63/8465 | 1.09e-05 | 3.58e-04 | 2.89e-04 | 21 |
| hsa006501 | Liver | NAFLD | Butanoate metabolism | 11/1043 | 27/8465 | 1.88e-04 | 3.62e-03 | 2.92e-03 | 11 |
| hsa0064011 | Liver | NAFLD | Propanoate metabolism | 12/1043 | 32/8465 | 2.44e-04 | 4.45e-03 | 3.58e-03 | 12 |
| hsa0121211 | Liver | NAFLD | Fatty acid metabolism | 17/1043 | 57/8465 | 3.43e-04 | 5.93e-03 | 4.78e-03 | 17 |
| hsa0007111 | Liver | NAFLD | Fatty acid degradation | 13/1043 | 43/8465 | 1.46e-03 | 1.71e-02 | 1.38e-02 | 13 |
| hsa041461 | Liver | NAFLD | Peroxisome | 19/1043 | 82/8465 | 4.37e-03 | 4.10e-02 | 3.30e-02 | 19 |
| hsa0028021 | Liver | Cirrhotic | Valine, leucine and isoleucine degradation | 32/2530 | 48/8465 | 1.45e-07 | 2.02e-06 | 1.24e-06 | 32 |
| hsa0007121 | Liver | Cirrhotic | Fatty acid degradation | 29/2530 | 43/8465 | 3.87e-07 | 4.95e-06 | 3.05e-06 | 29 |
| hsa012122 | Liver | Cirrhotic | Fatty acid metabolism | 32/2530 | 57/8465 | 3.12e-05 | 2.47e-04 | 1.52e-04 | 32 |
| hsa00410 | Liver | Cirrhotic | beta-Alanine metabolism | 18/2530 | 31/8465 | 1.00e-03 | 5.57e-03 | 3.43e-03 | 18 |
| Page: 1 2 3 |
Top |
Cell-cell communication analysis |
| Identification of potential cell-cell interactions between two cell types and their ligand-receptor pairs for different disease states |
| Ligand | Receptor | LRpair | Pathway | Tissue | Disease Stage |
| Page: 1 |
Top |
Single-cell gene regulatory network inference analysis |
| Find out the significant the regulons (TFs) and the target genes of each regulon across cell types for different disease states |
| TF | Cell Type | Tissue | Disease Stage | Target Gene | RSS | Regulon Activity |
| ∗The dot plots of a searched regulon are shown for all cell subpopulations in each disease state of each tissue based on the regulon specific score inferred using pySCENIC and by calculating the average expression. |
| Page: 1 |
Top |
Somatic mutation of malignant transformation related genes |
| Annotation of somatic variants for genes involved in malignant transformation |
| Hugo Symbol | Variant Class | Variant Classification | dbSNP RS | HGVSc | HGVSp | HGVSp Short | SWISSPROT | BIOTYPE | SIFT | PolyPhen | Tumor Sample Barcode | Tissue | Histology | Sex | Age | Stage | Therapy Types | Drugs | Outcome |
| EHHADH | SNV | Missense_Mutation | c.1132N>C | p.Val378Leu | p.V378L | Q08426 | protein_coding | deleterious(0) | probably_damaging(0.935) | TCGA-A7-A13D-01 | Breast | breast invasive carcinoma | Female | <65 | I/II | Chemotherapy | cytoxan | SD | |
| EHHADH | SNV | Missense_Mutation | c.2024N>C | p.Val675Ala | p.V675A | Q08426 | protein_coding | deleterious(0.03) | benign(0.386) | TCGA-AR-A0U0-01 | Breast | breast invasive carcinoma | Female | >=65 | I/II | Unknown | Unknown | SD | |
| EHHADH | SNV | Missense_Mutation | c.1768N>T | p.His590Tyr | p.H590Y | Q08426 | protein_coding | tolerated(0.11) | benign(0) | TCGA-C8-A275-01 | Breast | breast invasive carcinoma | Female | <65 | I/II | Unknown | Unknown | SD | |
| EHHADH | SNV | Missense_Mutation | c.2018C>G | p.Pro673Arg | p.P673R | Q08426 | protein_coding | tolerated(0.09) | benign(0.415) | TCGA-E2-A1LA-01 | Breast | breast invasive carcinoma | Female | <65 | I/II | Hormone Therapy | arimidex | SD | |
| EHHADH | SNV | Missense_Mutation | c.1013A>C | p.Lys338Thr | p.K338T | Q08426 | protein_coding | tolerated(0.14) | benign(0.225) | TCGA-E9-A1N3-01 | Breast | breast invasive carcinoma | Female | >=65 | III/IV | Chemotherapy | 5-fluorouracil | CR | |
| EHHADH | SNV | Missense_Mutation | novel | c.1232N>T | p.Ser411Leu | p.S411L | Q08426 | protein_coding | deleterious(0) | probably_damaging(1) | TCGA-S3-AA17-01 | Breast | breast invasive carcinoma | Female | <65 | I/II | Hormone Therapy | anastrozole | SD |
| EHHADH | SNV | Missense_Mutation | novel | c.2107N>C | p.Ser703Pro | p.S703P | Q08426 | protein_coding | deleterious(0.01) | possibly_damaging(0.653) | TCGA-EK-A2PG-01 | Cervix | cervical & endocervical cancer | Female | >=65 | I/II | Unknown | Unknown | SD |
| EHHADH | SNV | Missense_Mutation | rs751289858 | c.661N>T | p.Arg221Trp | p.R221W | Q08426 | protein_coding | deleterious(0) | possibly_damaging(0.732) | TCGA-A6-4107-01 | Colorectum | colon adenocarcinoma | Female | <65 | III/IV | Chemotherapy | 5 | SD |
| EHHADH | SNV | Missense_Mutation | c.867N>T | p.Trp289Cys | p.W289C | Q08426 | protein_coding | deleterious(0) | probably_damaging(0.941) | TCGA-AD-6895-01 | Colorectum | colon adenocarcinoma | Male | >=65 | III/IV | Unknown | Unknown | SD | |
| EHHADH | SNV | Missense_Mutation | c.719N>T | p.Ala240Val | p.A240V | Q08426 | protein_coding | deleterious(0) | possibly_damaging(0.886) | TCGA-AM-5821-01 | Colorectum | colon adenocarcinoma | Female | >=65 | I/II | Unknown | Unknown | SD |
| Page: 1 2 3 4 5 6 7 8 9 |
Top |
Related drugs of malignant transformation related genes |
| Identification of chemicals and drugs interact with genes involved in malignant transfromation |
| (DGIdb 4.0) |
| Entrez ID | Symbol | Category | Interaction Types | Drug Claim Name | Drug Name | PMIDs |
| Page: 1 |

Copyright 2023-Present -The University of Texas Health Science Center at Houston |