
|
|||||
|
 | |
| |
| |
| |
| |
| |
|
Gene: EHD4 |
Gene summary for EHD4 |
| Gene information | Species | Human | Gene symbol | EHD4 | Gene ID | 30844 |
| Gene name | EH domain containing 4 | |
| Gene Alias | PAST4 | |
| Cytomap | 15q15.1 | |
| Gene Type | protein-coding | GO ID | GO:0001932 | UniProtAcc | A0A024R9N6 |
Top |
Malignant transformation analysis |
| Identification of the aberrant gene expression in precancerous and cancerous lesions by comparing the gene expression of stem-like cells in diseased tissues with normal stem cells |
| Entrez ID | Symbol | Replicates | Species | Organ | Tissue | Adj P-value | Log2FC | Malignancy |
| 30844 | EHD4 | LZE4T | Human | Esophagus | ESCC | 4.92e-16 | -3.69e-01 | 0.0811 |
| 30844 | EHD4 | LZE7T | Human | Esophagus | ESCC | 3.82e-05 | -4.27e-01 | 0.0667 |
| 30844 | EHD4 | LZE8T | Human | Esophagus | ESCC | 2.15e-17 | -5.72e-01 | 0.067 |
| 30844 | EHD4 | LZE20T | Human | Esophagus | ESCC | 8.25e-20 | -5.86e-01 | 0.0662 |
| 30844 | EHD4 | LZE21D1 | Human | Esophagus | HGIN | 2.75e-03 | -5.63e-01 | 0.0632 |
| 30844 | EHD4 | LZE22D1 | Human | Esophagus | HGIN | 1.06e-07 | -7.22e-01 | 0.0595 |
| 30844 | EHD4 | LZE24T | Human | Esophagus | ESCC | 1.58e-24 | -3.42e-01 | 0.0596 |
| 30844 | EHD4 | LZE22D3 | Human | Esophagus | HGIN | 2.01e-02 | -5.46e-01 | 0.0653 |
| 30844 | EHD4 | LZE6T | Human | Esophagus | ESCC | 1.38e-13 | -7.04e-01 | 0.0845 |
| 30844 | EHD4 | P1T-E | Human | Esophagus | ESCC | 4.98e-04 | -1.56e-01 | 0.0875 |
| 30844 | EHD4 | P2T-E | Human | Esophagus | ESCC | 1.59e-33 | -5.26e-01 | 0.1177 |
| 30844 | EHD4 | P4T-E | Human | Esophagus | ESCC | 4.82e-19 | -1.54e-01 | 0.1323 |
| 30844 | EHD4 | P5T-E | Human | Esophagus | ESCC | 1.40e-31 | -2.64e-01 | 0.1327 |
| 30844 | EHD4 | P8T-E | Human | Esophagus | ESCC | 1.56e-09 | -1.12e-01 | 0.0889 |
| 30844 | EHD4 | P9T-E | Human | Esophagus | ESCC | 4.63e-21 | -2.14e-01 | 0.1131 |
| 30844 | EHD4 | P10T-E | Human | Esophagus | ESCC | 1.98e-47 | -5.49e-01 | 0.116 |
| 30844 | EHD4 | P11T-E | Human | Esophagus | ESCC | 1.39e-12 | -8.92e-02 | 0.1426 |
| 30844 | EHD4 | P12T-E | Human | Esophagus | ESCC | 4.61e-27 | -2.48e-01 | 0.1122 |
| 30844 | EHD4 | P15T-E | Human | Esophagus | ESCC | 5.93e-13 | -1.20e-01 | 0.1149 |
| 30844 | EHD4 | P16T-E | Human | Esophagus | ESCC | 8.41e-37 | -5.75e-01 | 0.1153 |
| Page: 1 2 3 4 5 6 |
| Tissue | Expression Dynamics | Abbreviation |
| Esophagus | 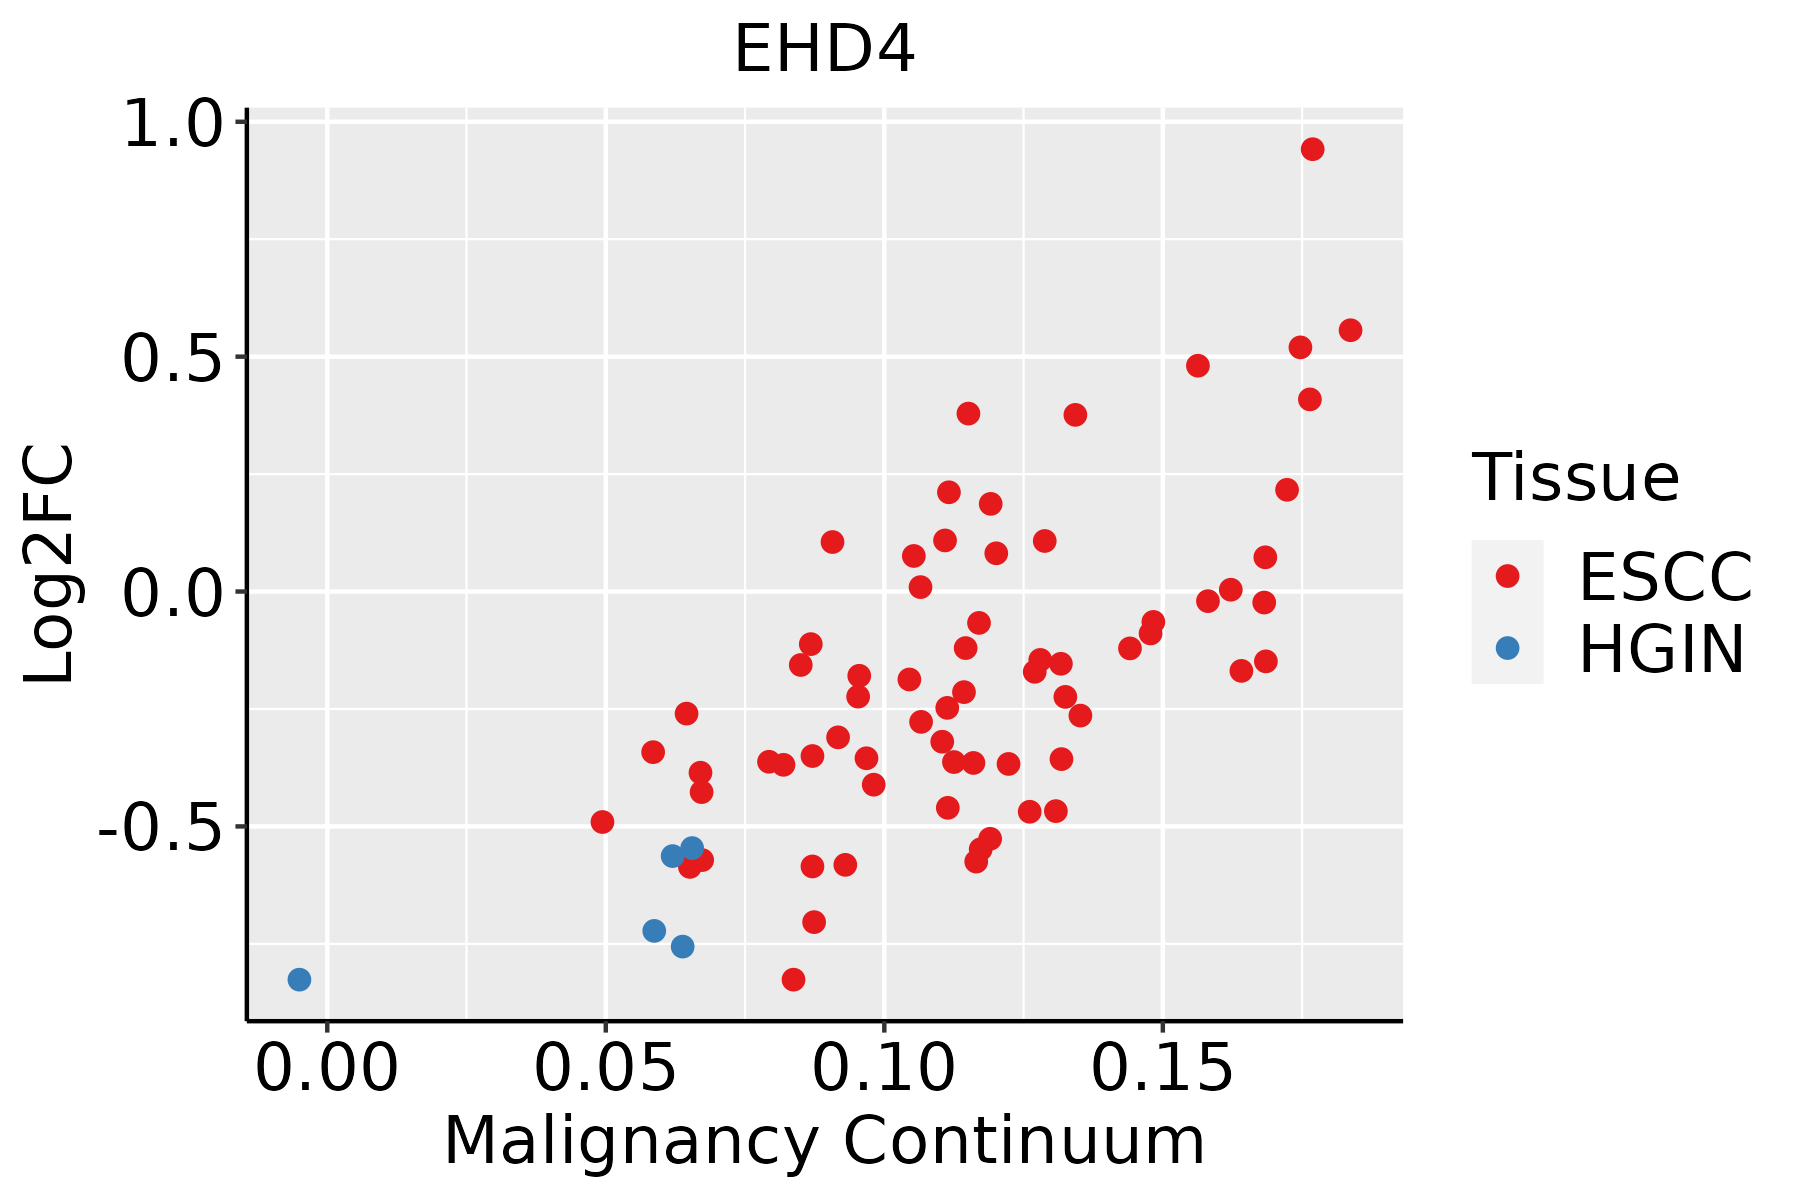 | ESCC: Esophageal squamous cell carcinoma |
| HGIN: High-grade intraepithelial neoplasias | ||
| LGIN: Low-grade intraepithelial neoplasias | ||
| Liver |  | HCC: Hepatocellular carcinoma |
| NAFLD: Non-alcoholic fatty liver disease | ||
| Oral Cavity |  | EOLP: Erosive Oral lichen planus |
| LP: leukoplakia | ||
| NEOLP: Non-erosive oral lichen planus | ||
| OSCC: Oral squamous cell carcinoma | ||
| Prostate | 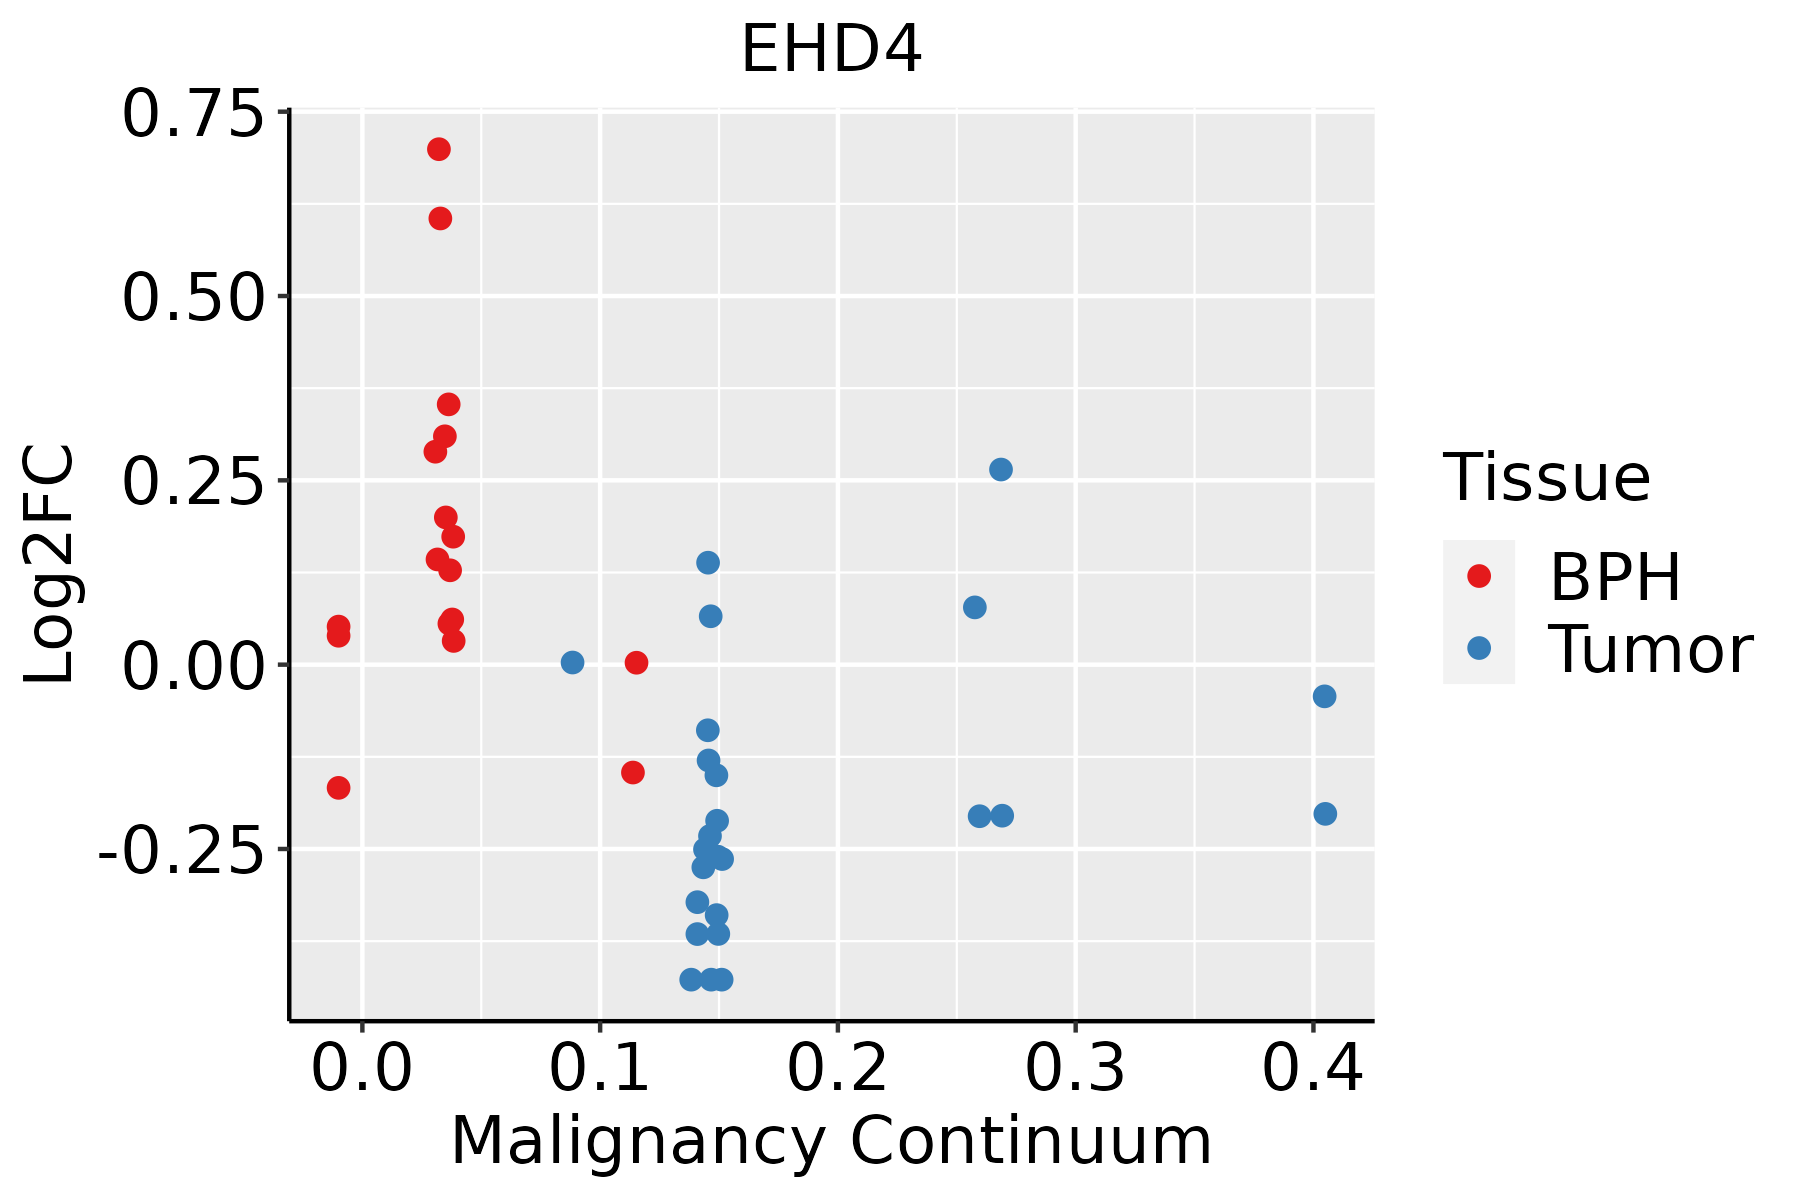 | BPH: Benign Prostatic Hyperplasia |
| Thyroid | 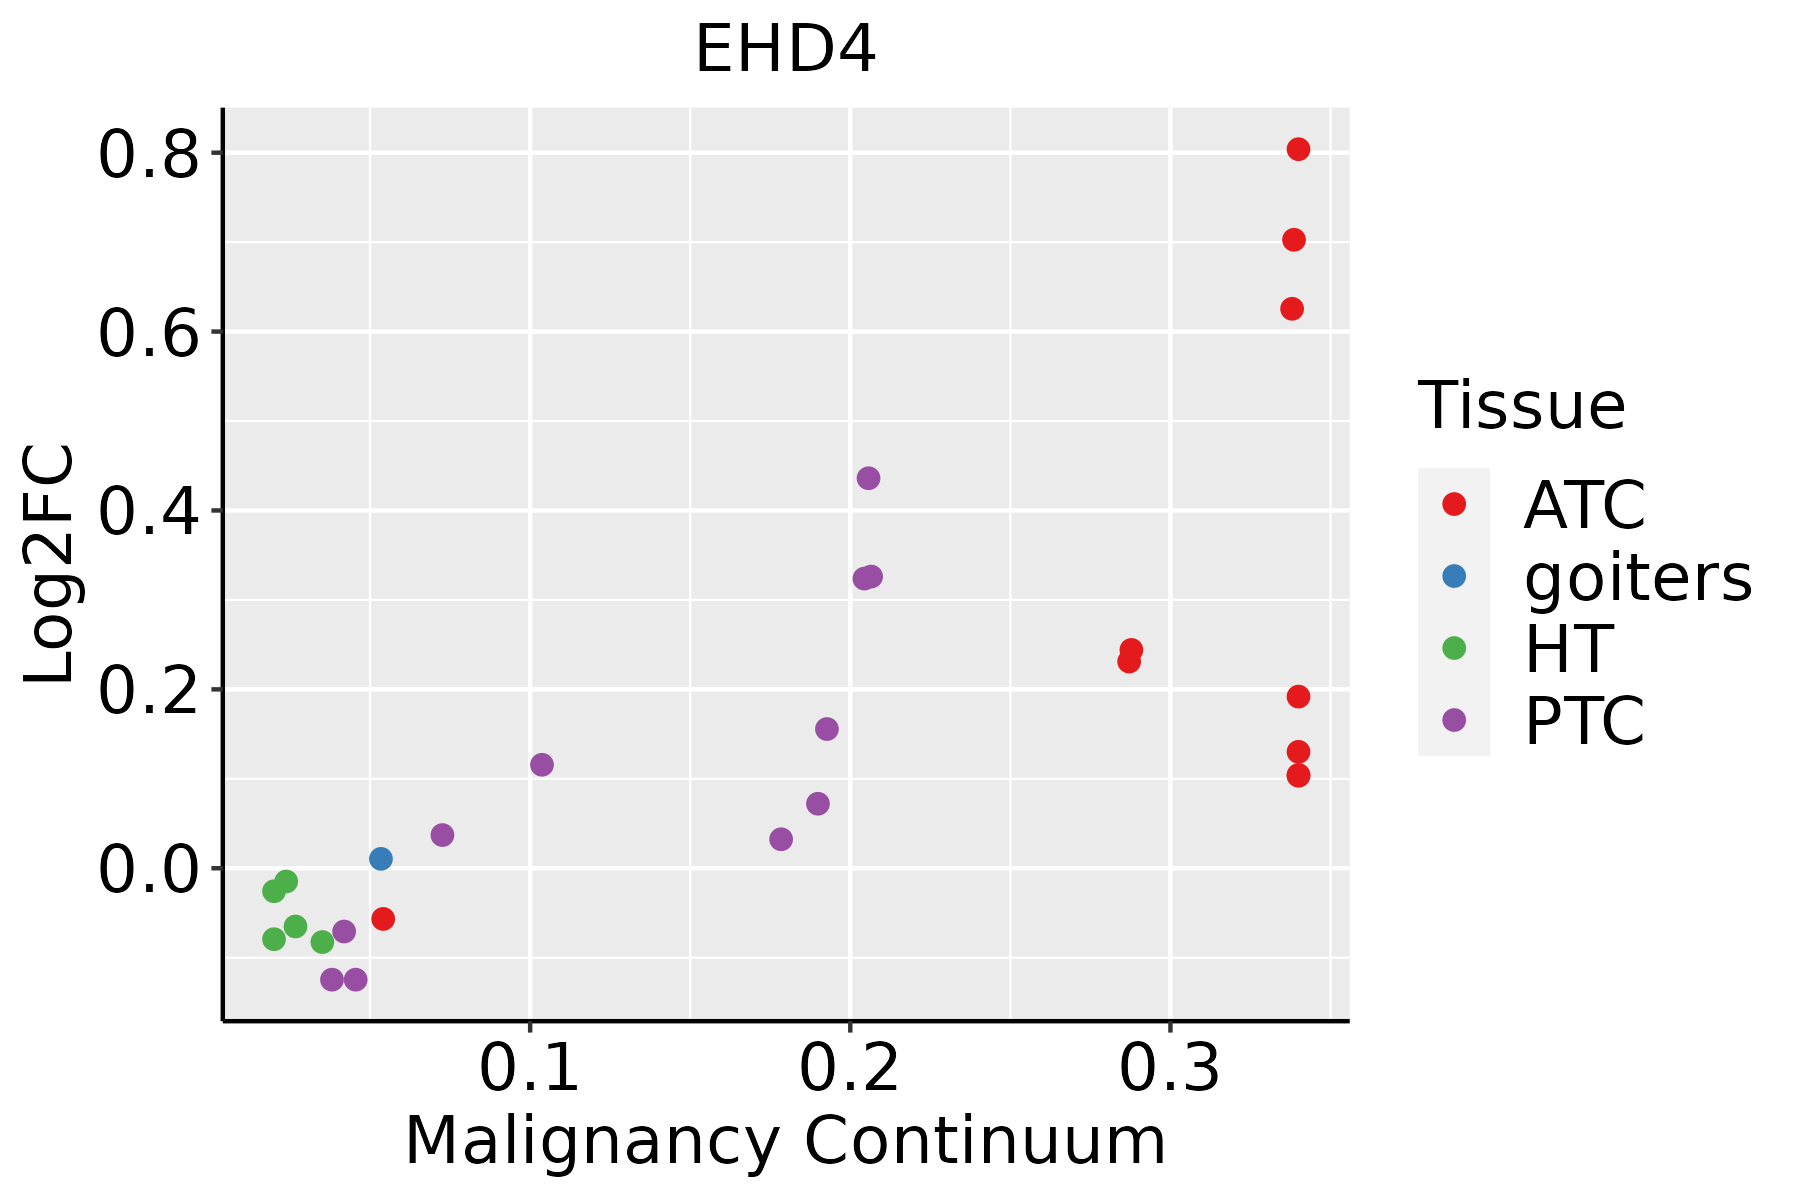 | ATC: Anaplastic thyroid cancer |
| HT: Hashimoto's thyroiditis | ||
| PTC: Papillary thyroid cancer |
| ∗log2FC in expression of this searched gene in stem-like cells from each diseased tissue sample relative to stem-like cells in normal samples in each tissue plotted against the malignancy continuum. Samples are colored based on if they are from different disease stage. |
Top |
Malignant transformation related pathway analysis |
| Find out the enriched GO biological processes and KEGG pathways involved in transition from healthy to precancer to cancer |
| Tissue | Disease Stage | Enriched GO biological Processes |
| Colorectum | AD |  |
| Colorectum | SER |  |
| Colorectum | MSS |  |
| Colorectum | MSI-H |  |
| Colorectum | FAP |  |
| ∗Top 15 enriched GO BP terms are showed in the bar plot of each disease state in each tissue. Each row represents a significant GO biological process which is colored according to the -log10(p.adjust). |
| Page: 1 2 3 4 5 6 7 8 9 |
| GO ID | Tissue | Disease Stage | Description | Gene Ratio | Bg Ratio | pvalue | p.adjust | Count |
| GO:001619710 | Esophagus | HGIN | endosomal transport | 57/2587 | 230/18723 | 5.74e-06 | 1.81e-04 | 57 |
| GO:007265920 | Esophagus | HGIN | protein localization to plasma membrane | 66/2587 | 284/18723 | 1.11e-05 | 3.18e-04 | 66 |
| GO:009887610 | Esophagus | HGIN | vesicle-mediated transport to the plasma membrane | 36/2587 | 136/18723 | 6.76e-05 | 1.55e-03 | 36 |
| GO:199077818 | Esophagus | HGIN | protein localization to cell periphery | 71/2587 | 333/18723 | 1.05e-04 | 2.24e-03 | 71 |
| GO:001619715 | Esophagus | ESCC | endosomal transport | 168/8552 | 230/18723 | 2.28e-17 | 1.93e-15 | 168 |
| GO:0072659110 | Esophagus | ESCC | protein localization to plasma membrane | 193/8552 | 284/18723 | 1.95e-14 | 1.03e-12 | 193 |
| GO:199077819 | Esophagus | ESCC | protein localization to cell periphery | 217/8552 | 333/18723 | 4.08e-13 | 1.88e-11 | 217 |
| GO:009887615 | Esophagus | ESCC | vesicle-mediated transport to the plasma membrane | 99/8552 | 136/18723 | 1.13e-10 | 3.39e-09 | 99 |
| GO:003010018 | Esophagus | ESCC | regulation of endocytosis | 135/8552 | 211/18723 | 5.75e-08 | 1.02e-06 | 135 |
| GO:00324565 | Esophagus | ESCC | endocytic recycling | 51/8552 | 73/18723 | 2.47e-05 | 2.10e-04 | 51 |
| GO:00182124 | Esophagus | ESCC | peptidyl-tyrosine modification | 202/8552 | 378/18723 | 1.34e-03 | 6.39e-03 | 202 |
| GO:00181084 | Esophagus | ESCC | peptidyl-tyrosine phosphorylation | 200/8552 | 375/18723 | 1.60e-03 | 7.45e-03 | 200 |
| GO:00507303 | Esophagus | ESCC | regulation of peptidyl-tyrosine phosphorylation | 144/8552 | 264/18723 | 2.22e-03 | 9.78e-03 | 144 |
| GO:00512592 | Esophagus | ESCC | protein complex oligomerization | 130/8552 | 238/18723 | 3.29e-03 | 1.36e-02 | 130 |
| GO:00069073 | Esophagus | ESCC | pinocytosis | 16/8552 | 22/18723 | 9.46e-03 | 3.28e-02 | 16 |
| GO:199077811 | Liver | Cirrhotic | protein localization to cell periphery | 135/4634 | 333/18723 | 1.18e-10 | 6.21e-09 | 135 |
| GO:007265911 | Liver | Cirrhotic | protein localization to plasma membrane | 119/4634 | 284/18723 | 1.30e-10 | 6.80e-09 | 119 |
| GO:001619711 | Liver | Cirrhotic | endosomal transport | 93/4634 | 230/18723 | 1.01e-07 | 2.93e-06 | 93 |
| GO:009887611 | Liver | Cirrhotic | vesicle-mediated transport to the plasma membrane | 59/4634 | 136/18723 | 1.46e-06 | 2.88e-05 | 59 |
| GO:003010011 | Liver | Cirrhotic | regulation of endocytosis | 74/4634 | 211/18723 | 4.86e-04 | 3.90e-03 | 74 |
| Page: 1 2 3 4 |
| Pathway ID | Tissue | Disease Stage | Description | Gene Ratio | Bg Ratio | pvalue | p.adjust | qvalue | Count |
| hsa0414429 | Esophagus | HGIN | Endocytosis | 76/1383 | 251/8465 | 1.74e-08 | 3.34e-07 | 2.65e-07 | 76 |
| hsa04144113 | Esophagus | HGIN | Endocytosis | 76/1383 | 251/8465 | 1.74e-08 | 3.34e-07 | 2.65e-07 | 76 |
| hsa04144210 | Esophagus | ESCC | Endocytosis | 186/4205 | 251/8465 | 9.74e-16 | 4.66e-14 | 2.39e-14 | 186 |
| hsa0414437 | Esophagus | ESCC | Endocytosis | 186/4205 | 251/8465 | 9.74e-16 | 4.66e-14 | 2.39e-14 | 186 |
| hsa0414412 | Liver | Cirrhotic | Endocytosis | 119/2530 | 251/8465 | 2.33e-09 | 4.56e-08 | 2.81e-08 | 119 |
| hsa0414413 | Liver | Cirrhotic | Endocytosis | 119/2530 | 251/8465 | 2.33e-09 | 4.56e-08 | 2.81e-08 | 119 |
| hsa0414422 | Liver | HCC | Endocytosis | 178/4020 | 251/8465 | 2.03e-14 | 5.22e-13 | 2.91e-13 | 178 |
| hsa0414432 | Liver | HCC | Endocytosis | 178/4020 | 251/8465 | 2.03e-14 | 5.22e-13 | 2.91e-13 | 178 |
| hsa0414427 | Oral cavity | OSCC | Endocytosis | 174/3704 | 251/8465 | 9.42e-17 | 4.51e-15 | 2.29e-15 | 174 |
| hsa04144112 | Oral cavity | OSCC | Endocytosis | 174/3704 | 251/8465 | 9.42e-17 | 4.51e-15 | 2.29e-15 | 174 |
| hsa0414428 | Oral cavity | LP | Endocytosis | 121/2418 | 251/8465 | 1.89e-11 | 3.70e-10 | 2.38e-10 | 121 |
| hsa0414436 | Oral cavity | LP | Endocytosis | 121/2418 | 251/8465 | 1.89e-11 | 3.70e-10 | 2.38e-10 | 121 |
| hsa0414425 | Prostate | BPH | Endocytosis | 89/1718 | 251/8465 | 1.06e-08 | 1.29e-07 | 7.99e-08 | 89 |
| hsa04144111 | Prostate | BPH | Endocytosis | 89/1718 | 251/8465 | 1.06e-08 | 1.29e-07 | 7.99e-08 | 89 |
| hsa0414426 | Prostate | Tumor | Endocytosis | 92/1791 | 251/8465 | 7.83e-09 | 1.04e-07 | 6.43e-08 | 92 |
| hsa0414435 | Prostate | Tumor | Endocytosis | 92/1791 | 251/8465 | 7.83e-09 | 1.04e-07 | 6.43e-08 | 92 |
| Page: 1 |
Top |
Cell-cell communication analysis |
| Identification of potential cell-cell interactions between two cell types and their ligand-receptor pairs for different disease states |
| Ligand | Receptor | LRpair | Pathway | Tissue | Disease Stage |
| Page: 1 |
Top |
Single-cell gene regulatory network inference analysis |
| Find out the significant the regulons (TFs) and the target genes of each regulon across cell types for different disease states |
| TF | Cell Type | Tissue | Disease Stage | Target Gene | RSS | Regulon Activity |
| ∗The dot plots of a searched regulon are shown for all cell subpopulations in each disease state of each tissue based on the regulon specific score inferred using pySCENIC and by calculating the average expression. |
| Page: 1 |
Top |
Somatic mutation of malignant transformation related genes |
| Annotation of somatic variants for genes involved in malignant transformation |
| Hugo Symbol | Variant Class | Variant Classification | dbSNP RS | HGVSc | HGVSp | HGVSp Short | SWISSPROT | BIOTYPE | SIFT | PolyPhen | Tumor Sample Barcode | Tissue | Histology | Sex | Age | Stage | Therapy Types | Drugs | Outcome |
| EHD4 | SNV | Missense_Mutation | novel | c.739N>T | p.Ile247Phe | p.I247F | Q9H223 | protein_coding | tolerated(0.39) | benign(0.115) | TCGA-OL-A66N-01 | Breast | breast invasive carcinoma | Female | <65 | III/IV | Unknown | Unknown | SD |
| EHD4 | SNV | Missense_Mutation | novel | c.422N>A | p.Cys141Tyr | p.C141Y | Q9H223 | protein_coding | deleterious(0) | probably_damaging(0.934) | TCGA-2W-A8YY-01 | Cervix | cervical & endocervical cancer | Female | <65 | I/II | Chemotherapy | cisplatin | CR |
| EHD4 | SNV | Missense_Mutation | rs779954148 | c.1354G>A | p.Asp452Asn | p.D452N | Q9H223 | protein_coding | tolerated(0.06) | benign(0.354) | TCGA-C5-A3HE-01 | Cervix | cervical & endocervical cancer | Female | <65 | I/II | Unknown | Unknown | PD |
| EHD4 | SNV | Missense_Mutation | c.908N>A | p.Arg303Gln | p.R303Q | Q9H223 | protein_coding | deleterious(0) | probably_damaging(0.996) | TCGA-JX-A5QV-01 | Cervix | cervical & endocervical cancer | Female | <65 | I/II | Unknown | Unknown | SD | |
| EHD4 | SNV | Missense_Mutation | rs747383299 | c.1555G>A | p.Glu519Lys | p.E519K | Q9H223 | protein_coding | tolerated(0.14) | possibly_damaging(0.896) | TCGA-LP-A7HU-01 | Cervix | cervical & endocervical cancer | Female | <65 | I/II | Unknown | Unknown | SD |
| EHD4 | SNV | Missense_Mutation | rs770079590 | c.389N>A | p.Arg130His | p.R130H | Q9H223 | protein_coding | tolerated(0.12) | possibly_damaging(0.738) | TCGA-AA-3492-01 | Colorectum | colon adenocarcinoma | Female | >=65 | I/II | Unknown | Unknown | SD |
| EHD4 | SNV | Missense_Mutation | novel | c.1053N>G | p.Ile351Met | p.I351M | Q9H223 | protein_coding | deleterious(0) | possibly_damaging(0.49) | TCGA-AA-3984-01 | Colorectum | colon adenocarcinoma | Female | <65 | I/II | Unknown | Unknown | SD |
| EHD4 | SNV | Missense_Mutation | c.1127C>T | p.Ser376Leu | p.S376L | Q9H223 | protein_coding | tolerated(0.08) | benign(0.012) | TCGA-AA-A010-01 | Colorectum | colon adenocarcinoma | Female | <65 | I/II | Chemotherapy | folinic | CR | |
| EHD4 | SNV | Missense_Mutation | c.1234N>C | p.Val412Leu | p.V412L | Q9H223 | protein_coding | tolerated(0.11) | benign(0.001) | TCGA-AA-A02K-01 | Colorectum | colon adenocarcinoma | Male | <65 | III/IV | Chemotherapy | folinic | PD | |
| EHD4 | SNV | Missense_Mutation | c.1034N>C | p.Leu345Pro | p.L345P | Q9H223 | protein_coding | deleterious(0) | possibly_damaging(0.781) | TCGA-AD-6889-01 | Colorectum | colon adenocarcinoma | Male | >=65 | I/II | Chemotherapy | xeloda | PD |
| Page: 1 2 3 4 5 |
Top |
Related drugs of malignant transformation related genes |
| Identification of chemicals and drugs interact with genes involved in malignant transfromation |
| (DGIdb 4.0) |
| Entrez ID | Symbol | Category | Interaction Types | Drug Claim Name | Drug Name | PMIDs |
| Page: 1 |

Copyright 2023-Present -The University of Texas Health Science Center at Houston |