
|
|||||
|
 | |
| |
| |
| |
| |
| |
|
Gene: EGR4 |
Gene summary for EGR4 |
| Gene information | Species | Human | Gene symbol | EGR4 | Gene ID | 1961 |
| Gene name | early growth response 4 | |
| Gene Alias | AT133 | |
| Cytomap | 2p13.2 | |
| Gene Type | protein-coding | GO ID | GO:0006139 | UniProtAcc | B7ZKU3 |
Top |
Malignant transformation analysis |
| Identification of the aberrant gene expression in precancerous and cancerous lesions by comparing the gene expression of stem-like cells in diseased tissues with normal stem cells |
| Entrez ID | Symbol | Replicates | Species | Organ | Tissue | Adj P-value | Log2FC | Malignancy |
| 1961 | EGR4 | P4T-E | Human | Esophagus | ESCC | 1.94e-08 | 6.55e-01 | 0.1323 |
| 1961 | EGR4 | P5T-E | Human | Esophagus | ESCC | 1.75e-25 | 1.17e+00 | 0.1327 |
| 1961 | EGR4 | P10T-E | Human | Esophagus | ESCC | 2.06e-08 | 3.23e-01 | 0.116 |
| 1961 | EGR4 | P12T-E | Human | Esophagus | ESCC | 7.98e-13 | 3.44e-01 | 0.1122 |
| 1961 | EGR4 | P16T-E | Human | Esophagus | ESCC | 1.76e-12 | 5.92e-01 | 0.1153 |
| 1961 | EGR4 | P20T-E | Human | Esophagus | ESCC | 2.67e-29 | 1.86e+00 | 0.1124 |
| 1961 | EGR4 | P22T-E | Human | Esophagus | ESCC | 4.40e-09 | 4.73e-01 | 0.1236 |
| 1961 | EGR4 | P23T-E | Human | Esophagus | ESCC | 9.75e-13 | 1.07e+00 | 0.108 |
| 1961 | EGR4 | P26T-E | Human | Esophagus | ESCC | 8.56e-12 | 4.38e-01 | 0.1276 |
| 1961 | EGR4 | P27T-E | Human | Esophagus | ESCC | 8.40e-04 | 2.54e-01 | 0.1055 |
| 1961 | EGR4 | P31T-E | Human | Esophagus | ESCC | 2.03e-09 | 1.95e-01 | 0.1251 |
| 1961 | EGR4 | P36T-E | Human | Esophagus | ESCC | 1.10e-05 | 5.51e-01 | 0.1187 |
| 1961 | EGR4 | P39T-E | Human | Esophagus | ESCC | 9.53e-09 | 2.84e-01 | 0.0894 |
| 1961 | EGR4 | P40T-E | Human | Esophagus | ESCC | 9.65e-05 | 7.29e-01 | 0.109 |
| 1961 | EGR4 | P47T-E | Human | Esophagus | ESCC | 7.52e-23 | 8.98e-01 | 0.1067 |
| 1961 | EGR4 | P49T-E | Human | Esophagus | ESCC | 2.95e-07 | 1.76e+00 | 0.1768 |
| 1961 | EGR4 | P52T-E | Human | Esophagus | ESCC | 4.44e-08 | 3.64e-01 | 0.1555 |
| 1961 | EGR4 | P56T-E | Human | Esophagus | ESCC | 1.41e-02 | 2.37e-01 | 0.1613 |
| 1961 | EGR4 | P61T-E | Human | Esophagus | ESCC | 3.96e-03 | 3.29e-01 | 0.099 |
| 1961 | EGR4 | P62T-E | Human | Esophagus | ESCC | 4.14e-47 | 2.00e+00 | 0.1302 |
| Page: 1 2 |
| Tissue | Expression Dynamics | Abbreviation |
| Esophagus |  | ESCC: Esophageal squamous cell carcinoma |
| HGIN: High-grade intraepithelial neoplasias | ||
| LGIN: Low-grade intraepithelial neoplasias | ||
| Oral Cavity | 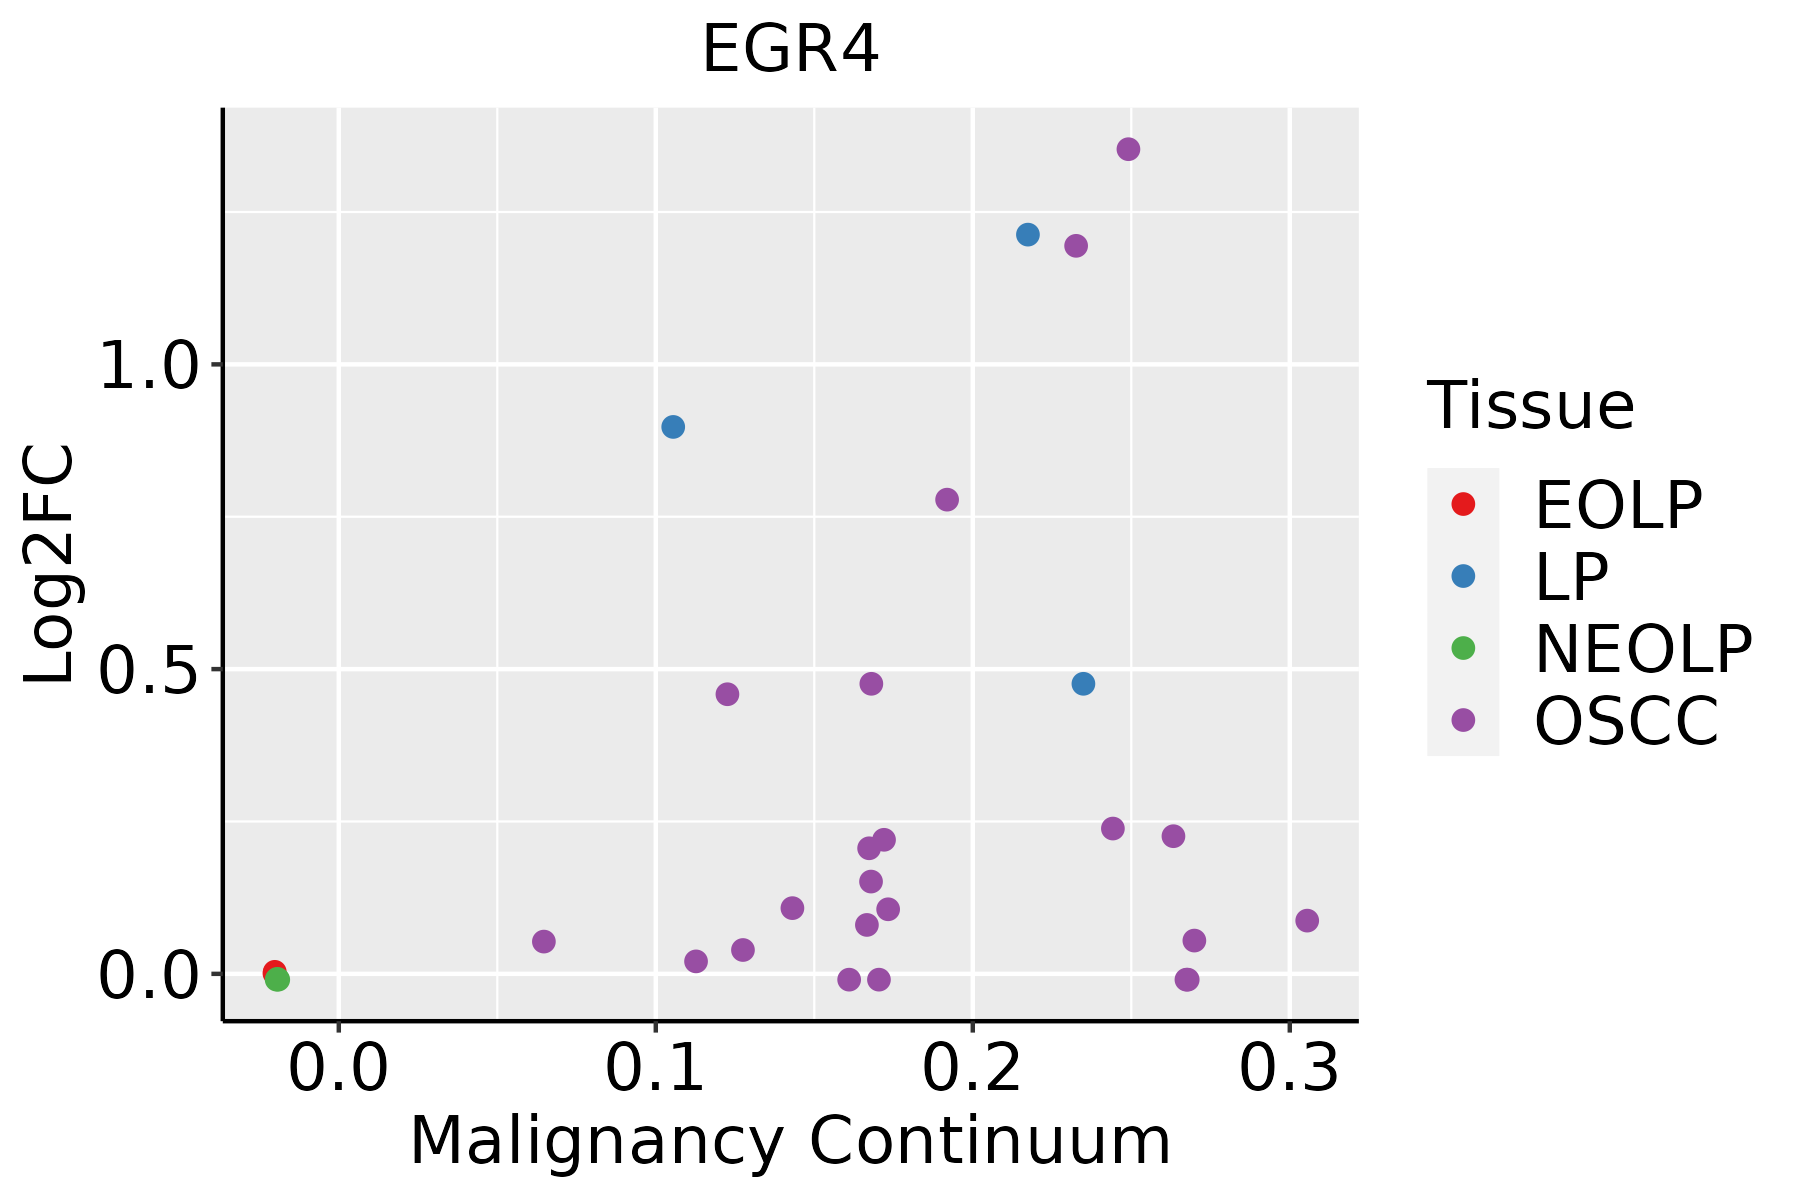 | EOLP: Erosive Oral lichen planus |
| LP: leukoplakia | ||
| NEOLP: Non-erosive oral lichen planus | ||
| OSCC: Oral squamous cell carcinoma |
| ∗log2FC in expression of this searched gene in stem-like cells from each diseased tissue sample relative to stem-like cells in normal samples in each tissue plotted against the malignancy continuum. Samples are colored based on if they are from different disease stage. |
Top |
Malignant transformation related pathway analysis |
| Find out the enriched GO biological processes and KEGG pathways involved in transition from healthy to precancer to cancer |
| Tissue | Disease Stage | Enriched GO biological Processes |
| Colorectum | AD |  |
| Colorectum | SER |  |
| Colorectum | MSS |  |
| Colorectum | MSI-H |  |
| Colorectum | FAP |  |
| ∗Top 15 enriched GO BP terms are showed in the bar plot of each disease state in each tissue. Each row represents a significant GO biological process which is colored according to the -log10(p.adjust). |
| Page: 1 2 3 4 5 6 7 8 9 |
| GO ID | Tissue | Disease Stage | Description | Gene Ratio | Bg Ratio | pvalue | p.adjust | Count |
| Page: 1 |
| Pathway ID | Tissue | Disease Stage | Description | Gene Ratio | Bg Ratio | pvalue | p.adjust | qvalue | Count |
| Page: 1 |
Top |
Cell-cell communication analysis |
| Identification of potential cell-cell interactions between two cell types and their ligand-receptor pairs for different disease states |
| Ligand | Receptor | LRpair | Pathway | Tissue | Disease Stage |
| Page: 1 |
Top |
Single-cell gene regulatory network inference analysis |
| Find out the significant the regulons (TFs) and the target genes of each regulon across cell types for different disease states |
| TF | Cell Type | Tissue | Disease Stage | Target Gene | RSS | Regulon Activity |
| ∗The dot plots of a searched regulon are shown for all cell subpopulations in each disease state of each tissue based on the regulon specific score inferred using pySCENIC and by calculating the average expression. |
| Page: 1 |
Top |
Somatic mutation of malignant transformation related genes |
| Annotation of somatic variants for genes involved in malignant transformation |
| Hugo Symbol | Variant Class | Variant Classification | dbSNP RS | HGVSc | HGVSp | HGVSp Short | SWISSPROT | BIOTYPE | SIFT | PolyPhen | Tumor Sample Barcode | Tissue | Histology | Sex | Age | Stage | Therapy Types | Drugs | Outcome |
| EGR4 | SNV | Missense_Mutation | novel | c.926N>T | p.Ala309Val | p.A309V | Q05215 | protein_coding | deleterious(0.04) | benign(0.001) | TCGA-A2-A0EV-01 | Breast | breast invasive carcinoma | Female | >=65 | I/II | Unknown | Unknown | SD |
| EGR4 | SNV | Missense_Mutation | novel | c.1039N>G | p.Leu347Val | p.L347V | Q05215 | protein_coding | deleterious(0) | probably_damaging(0.946) | TCGA-C8-A8HQ-01 | Breast | breast invasive carcinoma | Female | <65 | I/II | Unknown | Unknown | SD |
| EGR4 | SNV | Missense_Mutation | c.794C>T | p.Ser265Leu | p.S265L | Q05215 | protein_coding | deleterious(0.01) | benign(0.024) | TCGA-HM-A4S6-01 | Cervix | cervical & endocervical cancer | Female | <65 | III/IV | Chemotherapy | cisplatin | CR | |
| EGR4 | SNV | Missense_Mutation | c.1732N>A | p.Gly578Ser | p.G578S | Q05215 | protein_coding | deleterious(0.02) | probably_damaging(0.99) | TCGA-VS-A9U6-01 | Cervix | cervical & endocervical cancer | Female | <65 | I/II | Chemotherapy | cisplatin | PD | |
| EGR4 | SNV | Missense_Mutation | c.414N>T | p.Arg138Ser | p.R138S | Q05215 | protein_coding | deleterious(0) | possibly_damaging(0.556) | TCGA-A6-6653-01 | Colorectum | colon adenocarcinoma | Male | >=65 | I/II | Unknown | Unknown | SD | |
| EGR4 | SNV | Missense_Mutation | c.1222G>A | p.Ala408Thr | p.A408T | Q05215 | protein_coding | tolerated(0.41) | benign(0.011) | TCGA-AA-3510-01 | Colorectum | colon adenocarcinoma | Male | >=65 | I/II | Unknown | Unknown | SD | |
| EGR4 | SNV | Missense_Mutation | c.1102N>A | p.Ala368Thr | p.A368T | Q05215 | protein_coding | tolerated(0.59) | benign(0.003) | TCGA-CA-6718-01 | Colorectum | colon adenocarcinoma | Male | <65 | I/II | Unknown | Unknown | PD | |
| EGR4 | SNV | Missense_Mutation | novel | c.692N>T | p.Ala231Val | p.A231V | Q05215 | protein_coding | tolerated(0.09) | benign(0.01) | TCGA-A5-A0G1-01 | Endometrium | uterine corpus endometrioid carcinoma | Female | >=65 | I/II | Unknown | Unknown | SD |
| EGR4 | SNV | Missense_Mutation | c.586N>A | p.Glu196Lys | p.E196K | Q05215 | protein_coding | deleterious(0) | probably_damaging(0.983) | TCGA-A5-A0G2-01 | Endometrium | uterine corpus endometrioid carcinoma | Female | <65 | III/IV | Unknown | Unknown | SD | |
| EGR4 | SNV | Missense_Mutation | novel | c.460N>T | p.Ser154Cys | p.S154C | Q05215 | protein_coding | deleterious(0) | benign(0.041) | TCGA-A5-A0G2-01 | Endometrium | uterine corpus endometrioid carcinoma | Female | <65 | III/IV | Unknown | Unknown | SD |
| Page: 1 2 3 4 5 |
Top |
Related drugs of malignant transformation related genes |
| Identification of chemicals and drugs interact with genes involved in malignant transfromation |
| (DGIdb 4.0) |
| Entrez ID | Symbol | Category | Interaction Types | Drug Claim Name | Drug Name | PMIDs |
| Page: 1 |

Copyright 2023-Present -The University of Texas Health Science Center at Houston |