
|
|||||
|
 | |
| |
| |
| |
| |
| |
|
Gene: EGR2 |
Gene summary for EGR2 |
| Gene information | Species | Human | Gene symbol | EGR2 | Gene ID | 1959 |
| Gene name | early growth response 2 | |
| Gene Alias | AT591 | |
| Cytomap | 10q21.3 | |
| Gene Type | protein-coding | GO ID | GO:0000902 | UniProtAcc | P11161 |
Top |
Malignant transformation analysis |
| Identification of the aberrant gene expression in precancerous and cancerous lesions by comparing the gene expression of stem-like cells in diseased tissues with normal stem cells |
| Entrez ID | Symbol | Replicates | Species | Organ | Tissue | Adj P-value | Log2FC | Malignancy |
| 1959 | EGR2 | LZE4T | Human | Esophagus | ESCC | 2.21e-04 | 6.41e-01 | 0.0811 |
| 1959 | EGR2 | LZE8T | Human | Esophagus | ESCC | 3.14e-09 | 7.59e-01 | 0.067 |
| 1959 | EGR2 | LZE21D1 | Human | Esophagus | HGIN | 2.73e-03 | 1.32e-02 | 0.0632 |
| 1959 | EGR2 | LZE24T | Human | Esophagus | ESCC | 1.93e-05 | 8.88e-01 | 0.0596 |
| 1959 | EGR2 | LZE21T | Human | Esophagus | ESCC | 2.03e-04 | 6.54e-01 | 0.0655 |
| 1959 | EGR2 | P2T-E | Human | Esophagus | ESCC | 2.00e-46 | 1.16e+00 | 0.1177 |
| 1959 | EGR2 | P4T-E | Human | Esophagus | ESCC | 1.92e-15 | 4.29e-01 | 0.1323 |
| 1959 | EGR2 | P5T-E | Human | Esophagus | ESCC | 1.49e-22 | 9.15e-01 | 0.1327 |
| 1959 | EGR2 | P8T-E | Human | Esophagus | ESCC | 2.49e-18 | 6.49e-01 | 0.0889 |
| 1959 | EGR2 | P9T-E | Human | Esophagus | ESCC | 1.50e-05 | 1.98e-01 | 0.1131 |
| 1959 | EGR2 | P10T-E | Human | Esophagus | ESCC | 2.89e-09 | 1.23e-01 | 0.116 |
| 1959 | EGR2 | P11T-E | Human | Esophagus | ESCC | 1.40e-05 | 2.87e-01 | 0.1426 |
| 1959 | EGR2 | P12T-E | Human | Esophagus | ESCC | 6.36e-06 | 3.67e-01 | 0.1122 |
| 1959 | EGR2 | P15T-E | Human | Esophagus | ESCC | 5.87e-18 | 8.17e-01 | 0.1149 |
| 1959 | EGR2 | P16T-E | Human | Esophagus | ESCC | 1.23e-28 | 1.12e+00 | 0.1153 |
| 1959 | EGR2 | P20T-E | Human | Esophagus | ESCC | 1.04e-14 | 1.34e+00 | 0.1124 |
| 1959 | EGR2 | P22T-E | Human | Esophagus | ESCC | 6.01e-07 | 5.74e-01 | 0.1236 |
| 1959 | EGR2 | P23T-E | Human | Esophagus | ESCC | 1.62e-05 | 8.30e-01 | 0.108 |
| 1959 | EGR2 | P26T-E | Human | Esophagus | ESCC | 2.87e-53 | 1.24e+00 | 0.1276 |
| 1959 | EGR2 | P27T-E | Human | Esophagus | ESCC | 1.46e-23 | 1.04e+00 | 0.1055 |
| Page: 1 2 3 4 |
| Tissue | Expression Dynamics | Abbreviation |
| Esophagus |  | ESCC: Esophageal squamous cell carcinoma |
| HGIN: High-grade intraepithelial neoplasias | ||
| LGIN: Low-grade intraepithelial neoplasias | ||
| Oral Cavity | 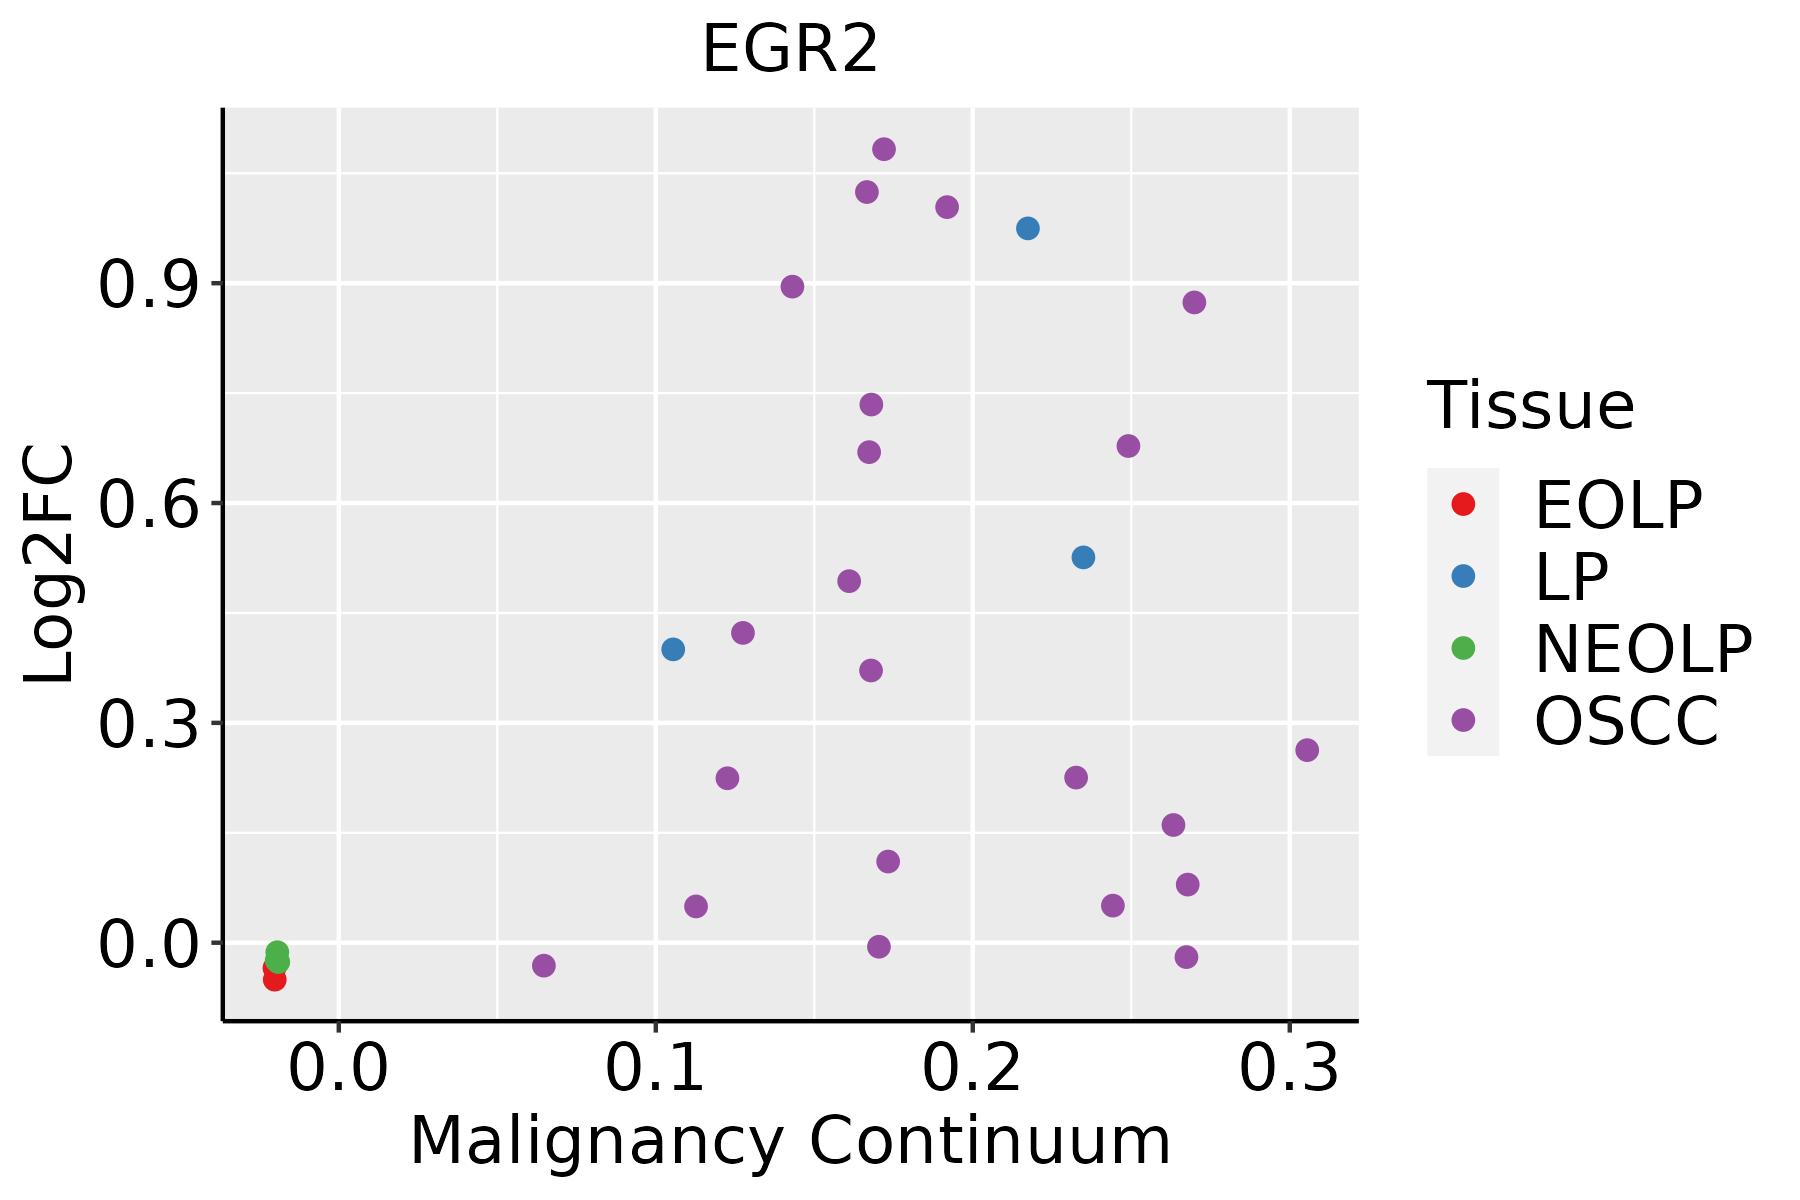 | EOLP: Erosive Oral lichen planus |
| LP: leukoplakia | ||
| NEOLP: Non-erosive oral lichen planus | ||
| OSCC: Oral squamous cell carcinoma | ||
| Skin | 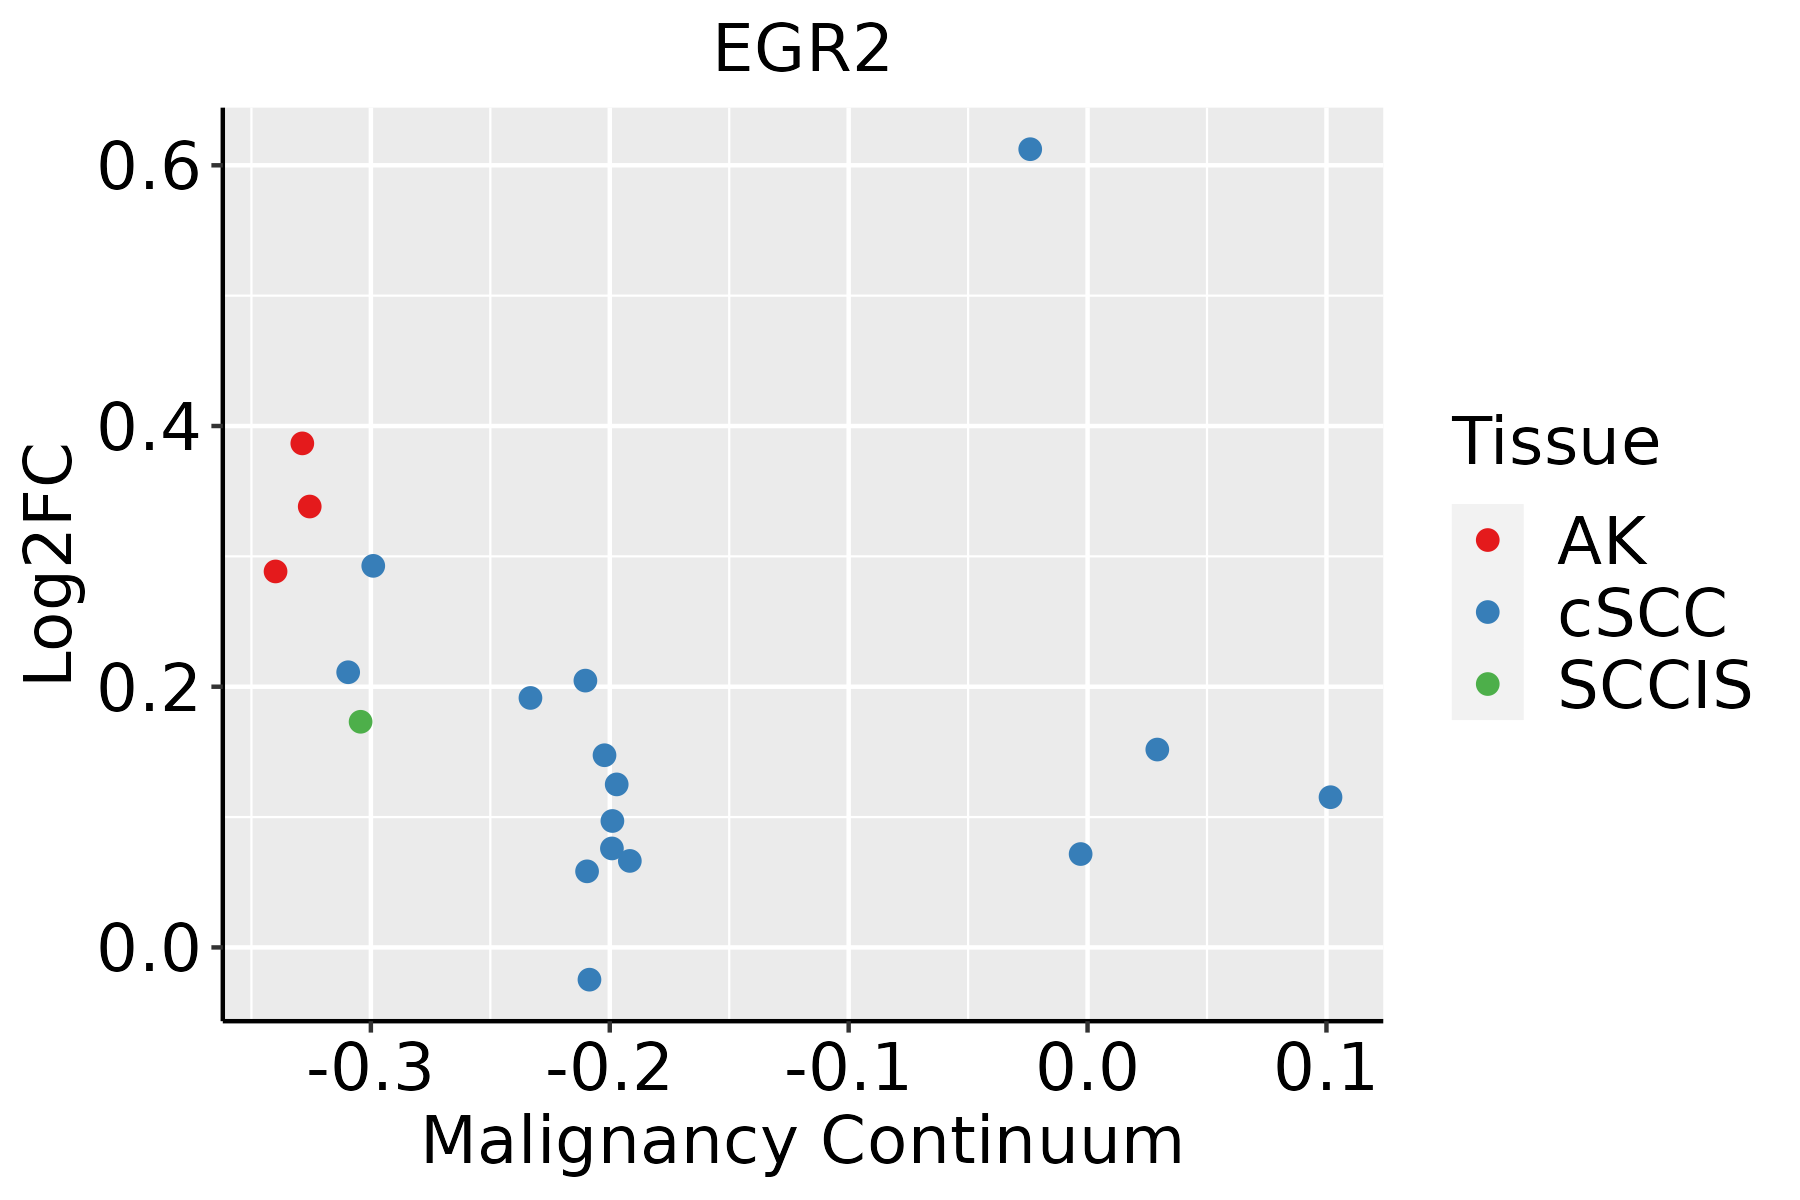 | AK: Actinic keratosis |
| cSCC: Cutaneous squamous cell carcinoma | ||
| SCCIS:squamous cell carcinoma in situ | ||
| Thyroid | 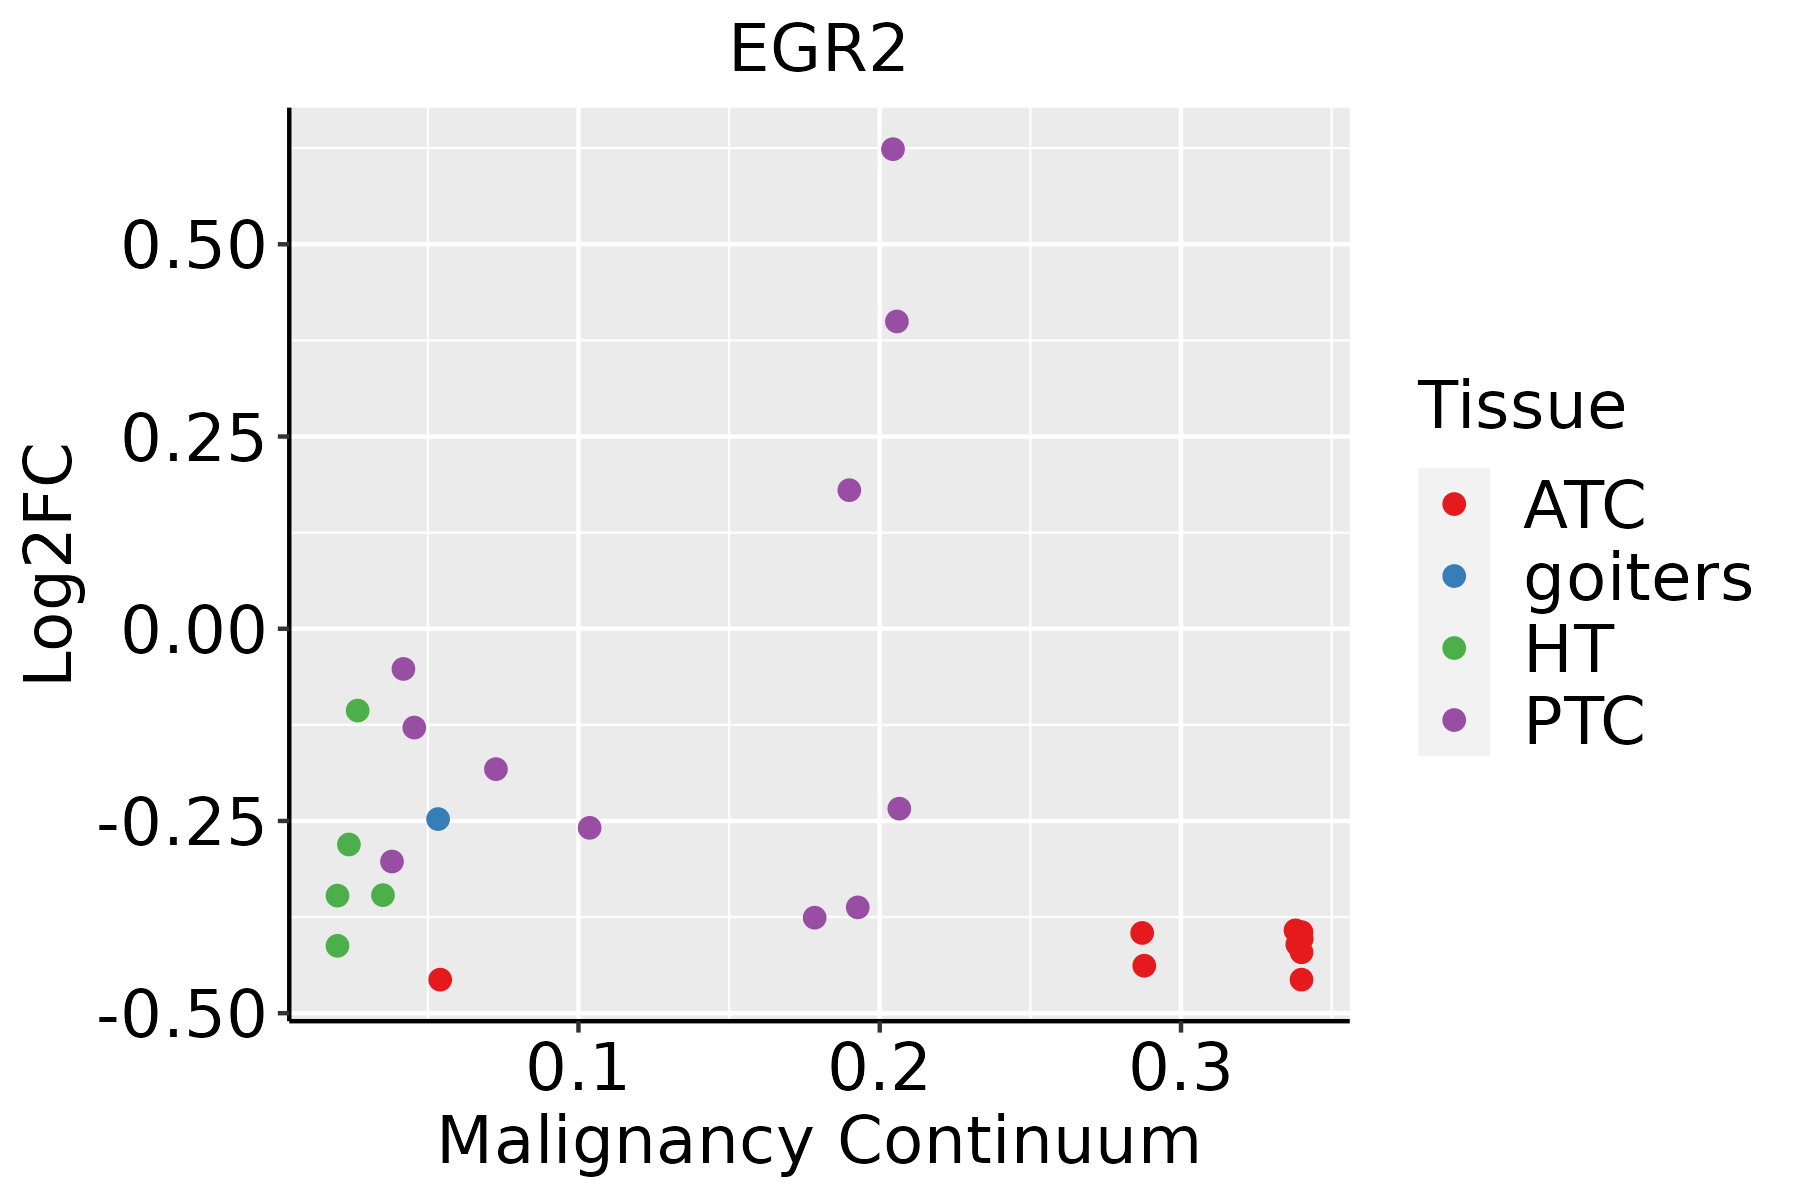 | ATC: Anaplastic thyroid cancer |
| HT: Hashimoto's thyroiditis | ||
| PTC: Papillary thyroid cancer |
| ∗log2FC in expression of this searched gene in stem-like cells from each diseased tissue sample relative to stem-like cells in normal samples in each tissue plotted against the malignancy continuum. Samples are colored based on if they are from different disease stage. |
Top |
Malignant transformation related pathway analysis |
| Find out the enriched GO biological processes and KEGG pathways involved in transition from healthy to precancer to cancer |
| Tissue | Disease Stage | Enriched GO biological Processes |
| Colorectum | AD |  |
| Colorectum | SER |  |
| Colorectum | MSS |  |
| Colorectum | MSI-H |  |
| Colorectum | FAP |  |
| ∗Top 15 enriched GO BP terms are showed in the bar plot of each disease state in each tissue. Each row represents a significant GO biological process which is colored according to the -log10(p.adjust). |
| Page: 1 2 3 4 5 6 7 8 9 |
| GO ID | Tissue | Disease Stage | Description | Gene Ratio | Bg Ratio | pvalue | p.adjust | Count |
| GO:000691319 | Esophagus | HGIN | nucleocytoplasmic transport | 83/2587 | 301/18723 | 2.14e-10 | 1.97e-08 | 83 |
| GO:005116919 | Esophagus | HGIN | nuclear transport | 83/2587 | 301/18723 | 2.14e-10 | 1.97e-08 | 83 |
| GO:005116819 | Esophagus | HGIN | nuclear export | 48/2587 | 154/18723 | 2.21e-08 | 1.34e-06 | 48 |
| GO:00182057 | Esophagus | HGIN | peptidyl-lysine modification | 88/2587 | 376/18723 | 2.99e-07 | 1.39e-05 | 88 |
| GO:000661110 | Esophagus | HGIN | protein export from nucleus | 22/2587 | 57/18723 | 2.96e-06 | 1.02e-04 | 22 |
| GO:00169254 | Esophagus | HGIN | protein sumoylation | 18/2587 | 53/18723 | 1.64e-04 | 3.19e-03 | 18 |
| GO:004343420 | Esophagus | HGIN | response to peptide hormone | 79/2587 | 414/18723 | 1.60e-03 | 1.79e-02 | 79 |
| GO:00605379 | Esophagus | HGIN | muscle tissue development | 76/2587 | 403/18723 | 2.67e-03 | 2.63e-02 | 76 |
| GO:00147068 | Esophagus | HGIN | striated muscle tissue development | 72/2587 | 384/18723 | 3.94e-03 | 3.56e-02 | 72 |
| GO:000150316 | Esophagus | HGIN | ossification | 75/2587 | 408/18723 | 5.49e-03 | 4.49e-02 | 75 |
| GO:0006913110 | Esophagus | ESCC | nucleocytoplasmic transport | 230/8552 | 301/18723 | 6.04e-28 | 2.02e-25 | 230 |
| GO:0051169110 | Esophagus | ESCC | nuclear transport | 230/8552 | 301/18723 | 6.04e-28 | 2.02e-25 | 230 |
| GO:0051168110 | Esophagus | ESCC | nuclear export | 126/8552 | 154/18723 | 1.88e-20 | 2.65e-18 | 126 |
| GO:001820514 | Esophagus | ESCC | peptidyl-lysine modification | 259/8552 | 376/18723 | 3.90e-20 | 5.26e-18 | 259 |
| GO:000661117 | Esophagus | ESCC | protein export from nucleus | 48/8552 | 57/18723 | 1.92e-09 | 4.39e-08 | 48 |
| GO:001692512 | Esophagus | ESCC | protein sumoylation | 41/8552 | 53/18723 | 2.49e-06 | 2.86e-05 | 41 |
| GO:000150317 | Esophagus | ESCC | ossification | 232/8552 | 408/18723 | 3.00e-06 | 3.40e-05 | 232 |
| GO:0043434111 | Esophagus | ESCC | response to peptide hormone | 234/8552 | 414/18723 | 4.93e-06 | 5.21e-05 | 234 |
| GO:003286818 | Esophagus | ESCC | response to insulin | 156/8552 | 264/18723 | 7.21e-06 | 7.20e-05 | 156 |
| GO:001072010 | Esophagus | ESCC | positive regulation of cell development | 172/8552 | 298/18723 | 1.74e-05 | 1.55e-04 | 172 |
| Page: 1 2 3 4 5 6 7 8 9 10 |
| Pathway ID | Tissue | Disease Stage | Description | Gene Ratio | Bg Ratio | pvalue | p.adjust | qvalue | Count |
| hsa052039 | Esophagus | HGIN | Viral carcinogenesis | 53/1383 | 204/8465 | 2.58e-04 | 2.71e-03 | 2.15e-03 | 53 |
| hsa0516639 | Esophagus | HGIN | Human T-cell leukemia virus 1 infection | 51/1383 | 222/8465 | 5.84e-03 | 4.05e-02 | 3.22e-02 | 51 |
| hsa0520315 | Esophagus | HGIN | Viral carcinogenesis | 53/1383 | 204/8465 | 2.58e-04 | 2.71e-03 | 2.15e-03 | 53 |
| hsa05166114 | Esophagus | HGIN | Human T-cell leukemia virus 1 infection | 51/1383 | 222/8465 | 5.84e-03 | 4.05e-02 | 3.22e-02 | 51 |
| hsa05166211 | Esophagus | ESCC | Human T-cell leukemia virus 1 infection | 164/4205 | 222/8465 | 8.13e-14 | 2.09e-12 | 1.07e-12 | 164 |
| hsa0520325 | Esophagus | ESCC | Viral carcinogenesis | 137/4205 | 204/8465 | 2.47e-07 | 1.88e-06 | 9.62e-07 | 137 |
| hsa051619 | Esophagus | ESCC | Hepatitis B | 108/4205 | 162/8465 | 7.68e-06 | 4.15e-05 | 2.12e-05 | 108 |
| hsa046259 | Esophagus | ESCC | C-type lectin receptor signaling pathway | 73/4205 | 104/8465 | 1.57e-05 | 7.98e-05 | 4.09e-05 | 73 |
| hsa05166310 | Esophagus | ESCC | Human T-cell leukemia virus 1 infection | 164/4205 | 222/8465 | 8.13e-14 | 2.09e-12 | 1.07e-12 | 164 |
| hsa0520335 | Esophagus | ESCC | Viral carcinogenesis | 137/4205 | 204/8465 | 2.47e-07 | 1.88e-06 | 9.62e-07 | 137 |
| hsa0516114 | Esophagus | ESCC | Hepatitis B | 108/4205 | 162/8465 | 7.68e-06 | 4.15e-05 | 2.12e-05 | 108 |
| hsa0462513 | Esophagus | ESCC | C-type lectin receptor signaling pathway | 73/4205 | 104/8465 | 1.57e-05 | 7.98e-05 | 4.09e-05 | 73 |
| hsa046258 | Oral cavity | OSCC | C-type lectin receptor signaling pathway | 73/3704 | 104/8465 | 3.83e-08 | 3.12e-07 | 1.59e-07 | 73 |
| hsa051618 | Oral cavity | OSCC | Hepatitis B | 103/3704 | 162/8465 | 2.34e-07 | 1.51e-06 | 7.69e-07 | 103 |
| hsa052038 | Oral cavity | OSCC | Viral carcinogenesis | 124/3704 | 204/8465 | 5.57e-07 | 3.28e-06 | 1.67e-06 | 124 |
| hsa0462512 | Oral cavity | OSCC | C-type lectin receptor signaling pathway | 73/3704 | 104/8465 | 3.83e-08 | 3.12e-07 | 1.59e-07 | 73 |
| hsa0516113 | Oral cavity | OSCC | Hepatitis B | 103/3704 | 162/8465 | 2.34e-07 | 1.51e-06 | 7.69e-07 | 103 |
| hsa0520314 | Oral cavity | OSCC | Viral carcinogenesis | 124/3704 | 204/8465 | 5.57e-07 | 3.28e-06 | 1.67e-06 | 124 |
| Page: 1 |
Top |
Cell-cell communication analysis |
| Identification of potential cell-cell interactions between two cell types and their ligand-receptor pairs for different disease states |
| Ligand | Receptor | LRpair | Pathway | Tissue | Disease Stage |
| Page: 1 |
Top |
Single-cell gene regulatory network inference analysis |
| Find out the significant the regulons (TFs) and the target genes of each regulon across cell types for different disease states |
| TF | Cell Type | Tissue | Disease Stage | Target Gene | RSS | Regulon Activity |
| EGR2 | CD8TRM | Cervix | Healthy | CCSAP,CCL4,CCL4L2, etc. | 8.99e-02 |  |
| EGR2 | CD8TRM | Cervix | N_HPV | CCSAP,CCL4,CCL4L2, etc. | 3.04e-01 |  |
| EGR2 | STM | Oral cavity | ADJ | EGR3,CX3CL1,EGR1, etc. | 7.15e-01 |  |
| EGR2 | cDC | Thyroid | PTC | EGR3,CCL4,CCL3, etc. | 1.87e-01 |  |
| ∗The dot plots of a searched regulon are shown for all cell subpopulations in each disease state of each tissue based on the regulon specific score inferred using pySCENIC and by calculating the average expression. |
| Page: 1 |
Top |
Somatic mutation of malignant transformation related genes |
| Annotation of somatic variants for genes involved in malignant transformation |
| Hugo Symbol | Variant Class | Variant Classification | dbSNP RS | HGVSc | HGVSp | HGVSp Short | SWISSPROT | BIOTYPE | SIFT | PolyPhen | Tumor Sample Barcode | Tissue | Histology | Sex | Age | Stage | Therapy Types | Drugs | Outcome |
| EGR2 | SNV | Missense_Mutation | c.1214N>A | p.Arg405Gln | p.R405Q | P11161 | protein_coding | deleterious(0) | probably_damaging(0.995) | TCGA-A2-A04W-01 | Breast | breast invasive carcinoma | Female | <65 | I/II | Chemotherapy | cytoxan | SD | |
| EGR2 | SNV | Missense_Mutation | novel | c.367N>T | p.Gly123Trp | p.G123W | P11161 | protein_coding | deleterious(0.04) | probably_damaging(0.933) | TCGA-C8-A8HQ-01 | Breast | breast invasive carcinoma | Female | <65 | I/II | Unknown | Unknown | SD |
| EGR2 | SNV | Missense_Mutation | c.1273G>A | p.Glu425Lys | p.E425K | P11161 | protein_coding | deleterious(0.01) | possibly_damaging(0.677) | TCGA-D8-A1JN-01 | Breast | breast invasive carcinoma | Female | >=65 | III/IV | Hormone Therapy | anastrozolum | SD | |
| EGR2 | SNV | Missense_Mutation | novel | c.899C>A | p.Ala300Glu | p.A300E | P11161 | protein_coding | tolerated(0.47) | benign(0.137) | TCGA-HN-A2NL-01 | Breast | breast invasive carcinoma | Female | <65 | I/II | Chemotherapy | cyclophosphamide | SD |
| EGR2 | insertion | Nonsense_Mutation | novel | c.252_253insTCTGTAAAATGAAGATACTTATTTTTCAGGGTTGTAAGAGTA | p.Ala84_Pro85insSerValLysTerArgTyrLeuPhePheArgValValArgVal | p.A84_P85insSVK*RYLFFRVVRV | P11161 | protein_coding | TCGA-AO-A03V-01 | Breast | breast invasive carcinoma | Female | <65 | I/II | Chemotherapy | fluorouracil | SD | ||
| EGR2 | deletion | Frame_Shift_Del | c.1337delG | p.Gly446AlafsTer89 | p.G446Afs*89 | P11161 | protein_coding | TCGA-D8-A27V-01 | Breast | breast invasive carcinoma | Female | <65 | I/II | Hormone Therapy | tamoxiphen | SD | |||
| EGR2 | SNV | Missense_Mutation | novel | c.655C>T | p.Leu219Phe | p.L219F | P11161 | protein_coding | deleterious(0.02) | possibly_damaging(0.799) | TCGA-2W-A8YY-01 | Cervix | cervical & endocervical cancer | Female | <65 | I/II | Chemotherapy | cisplatin | CR |
| EGR2 | SNV | Missense_Mutation | novel | c.188N>G | p.Asp63Gly | p.D63G | P11161 | protein_coding | tolerated(0.8) | benign(0.003) | TCGA-A6-5661-01 | Colorectum | colon adenocarcinoma | Female | >=65 | I/II | Unknown | Unknown | SD |
| EGR2 | SNV | Missense_Mutation | c.1085N>A | p.Arg362Gln | p.R362Q | P11161 | protein_coding | deleterious(0) | probably_damaging(0.995) | TCGA-A6-6141-01 | Colorectum | colon adenocarcinoma | Male | <65 | I/II | Chemotherapy | 5-fu | SD | |
| EGR2 | SNV | Missense_Mutation | c.1130G>A | p.Arg377His | p.R377H | P11161 | protein_coding | deleterious(0) | probably_damaging(0.998) | TCGA-AA-3672-01 | Colorectum | colon adenocarcinoma | Female | >=65 | III/IV | Unknown | Unknown | SD |
| Page: 1 2 3 4 5 6 7 8 9 |
Top |
Related drugs of malignant transformation related genes |
| Identification of chemicals and drugs interact with genes involved in malignant transfromation |
| (DGIdb 4.0) |
| Entrez ID | Symbol | Category | Interaction Types | Drug Claim Name | Drug Name | PMIDs |
| 1959 | EGR2 | TRANSCRIPTION FACTOR | RETINOIC ACID | 1361214 |
| Page: 1 |

Copyright 2023-Present -The University of Texas Health Science Center at Houston |