| Tissue | Expression Dynamics | Abbreviation |
| Breast | 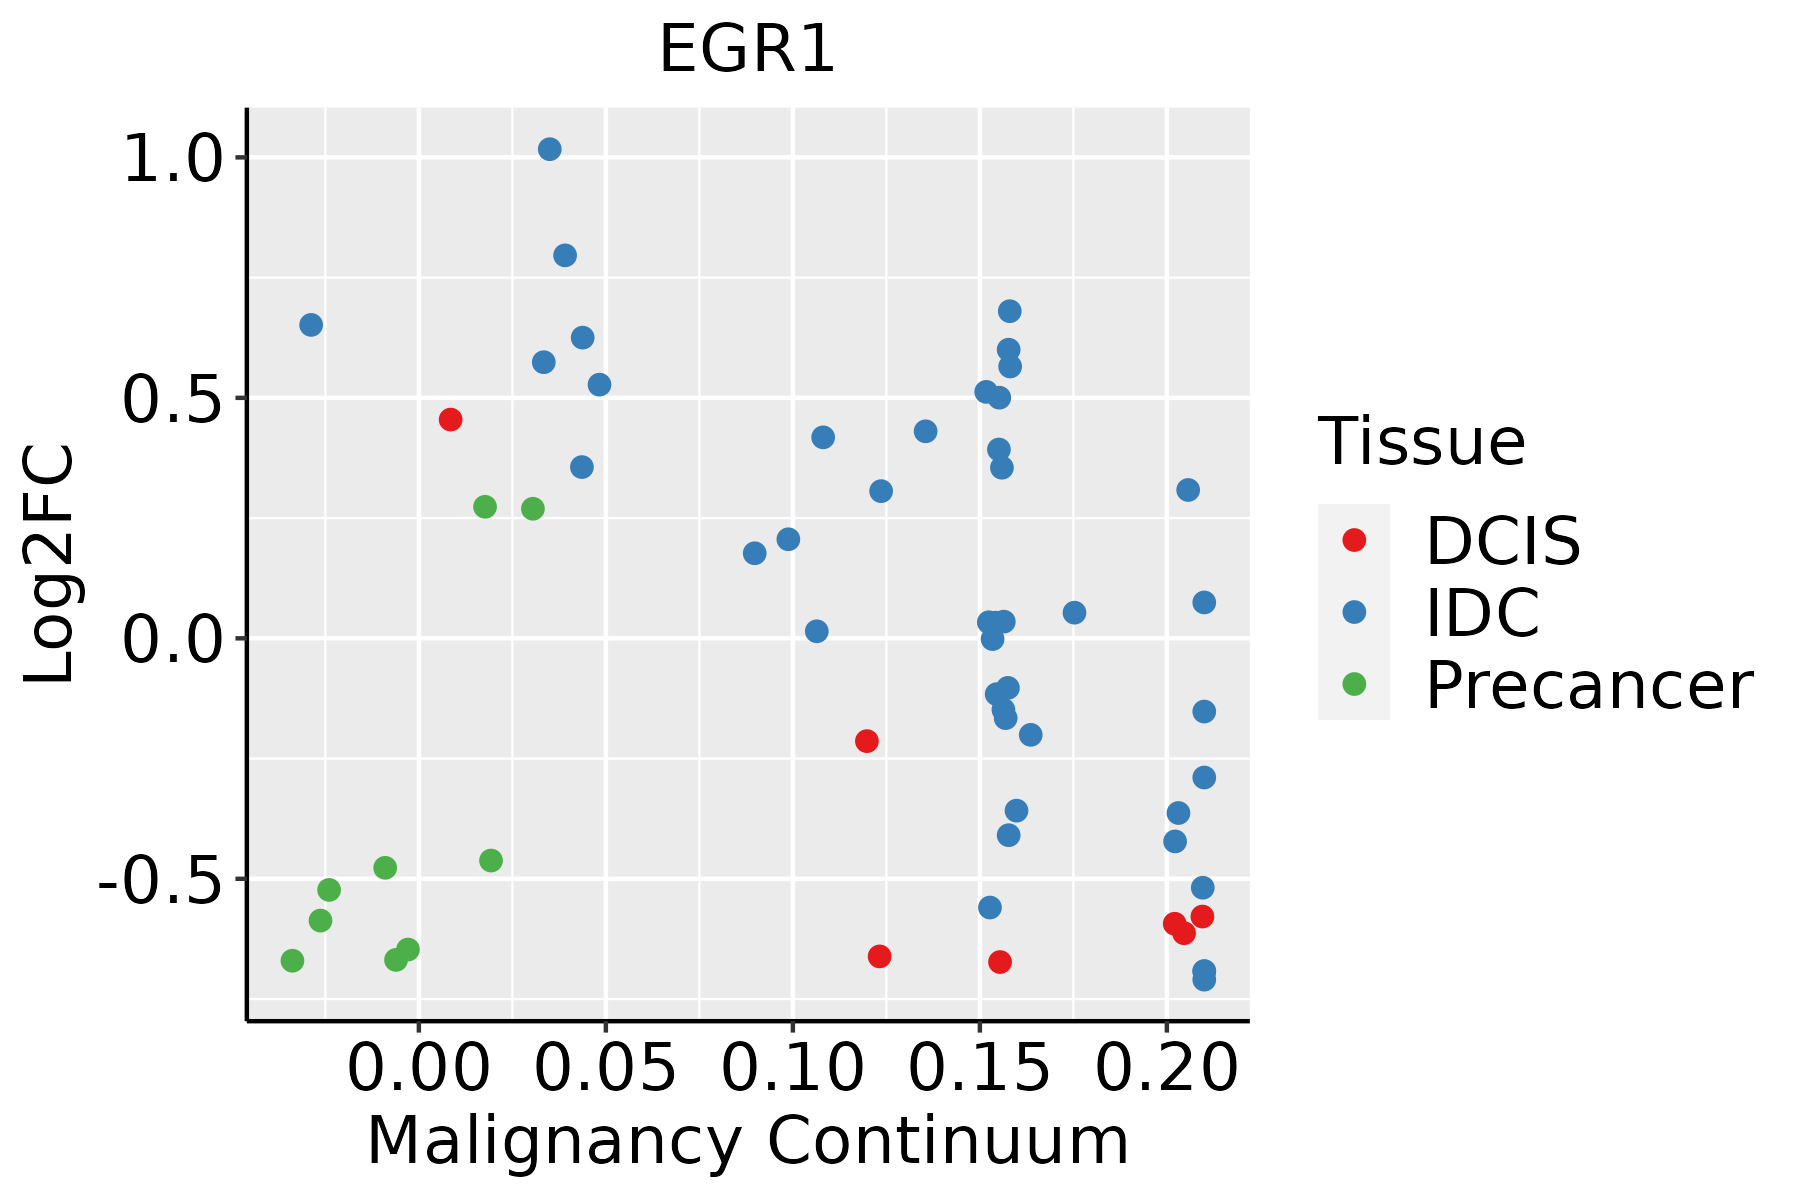 | IDC: Invasive ductal carcinoma |
| DCIS: Ductal carcinoma in situ |
| Precancer(BRCA1-mut): Precancerous lesion from BRCA1 mutation carriers |
| Cervix | 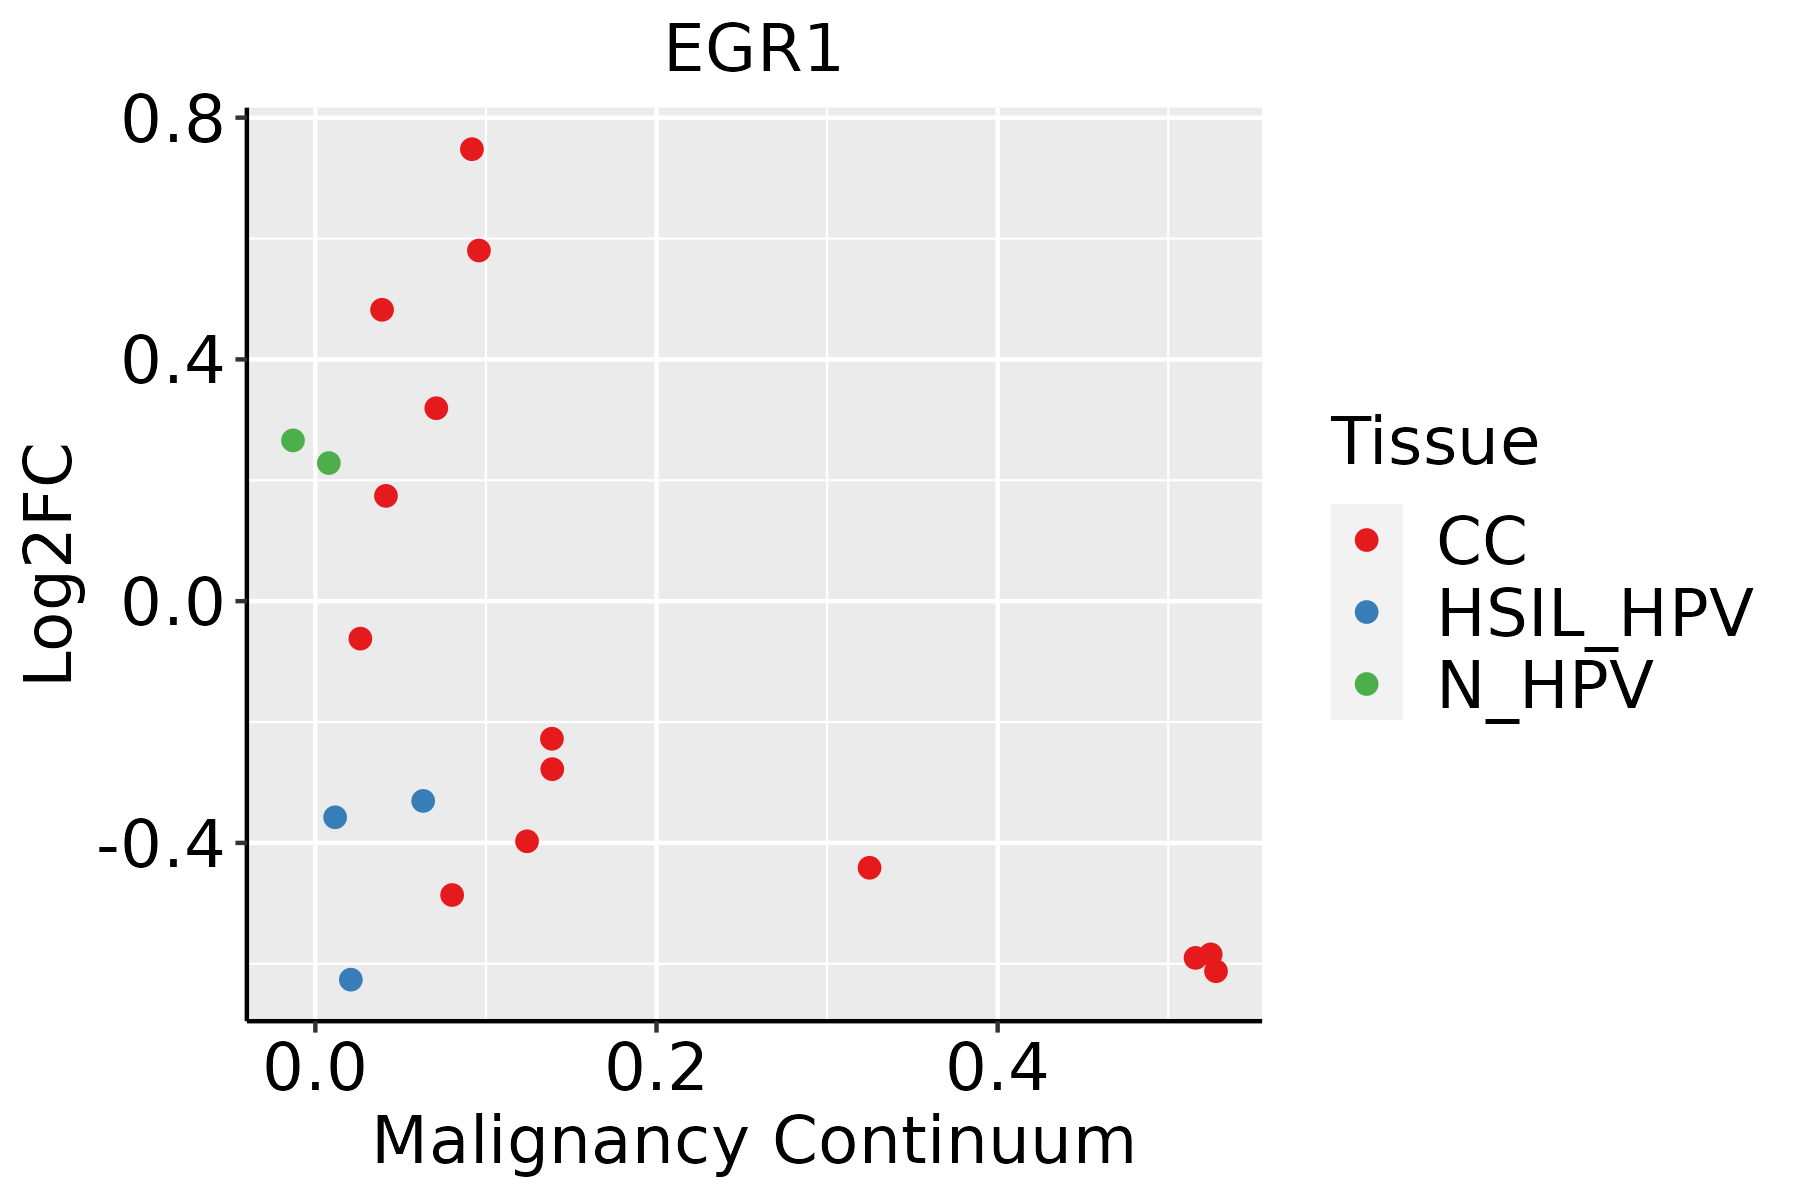 | CC: Cervix cancer |
| HSIL_HPV: HPV-infected high-grade squamous intraepithelial lesions |
| N_HPV: HPV-infected normal cervix |
| Endometrium | 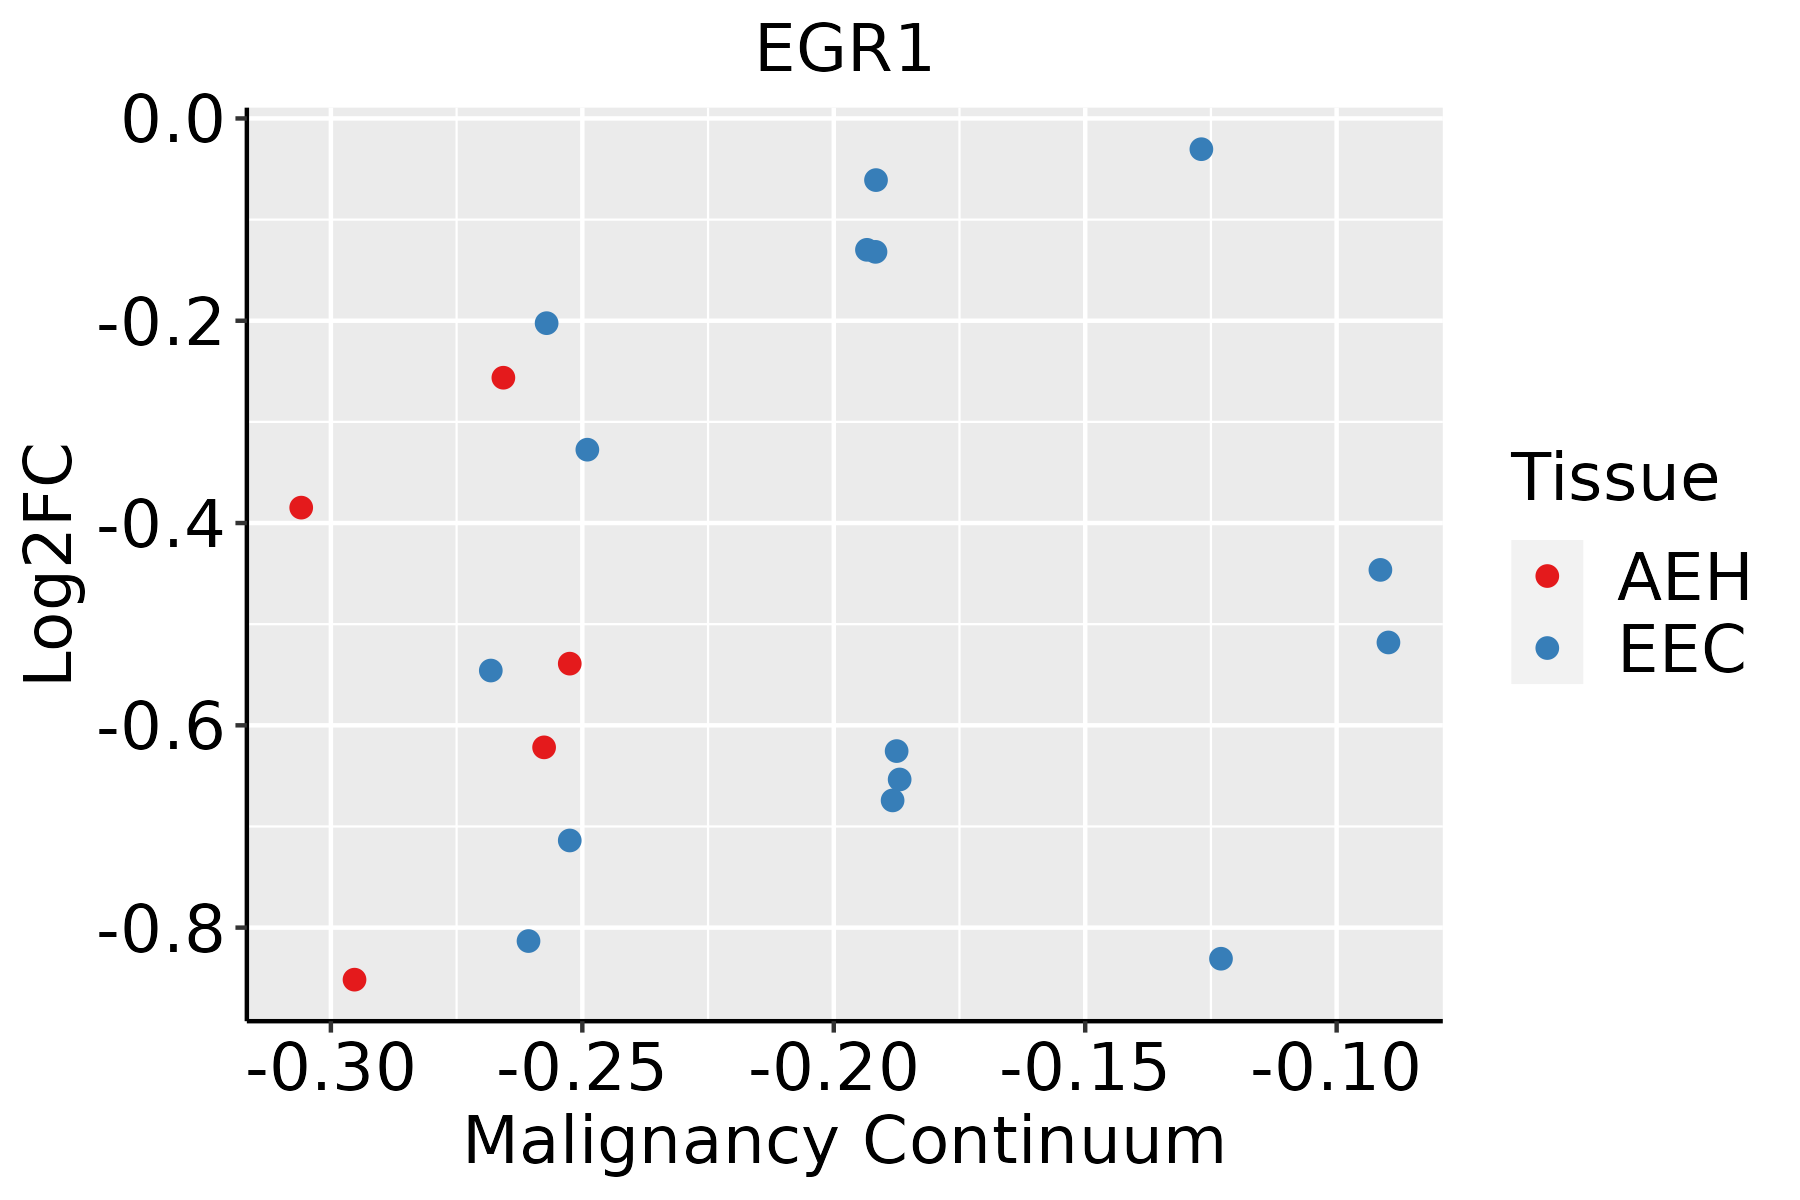 | AEH: Atypical endometrial hyperplasia |
| EEC: Endometrioid Cancer |
| Esophagus |  | ESCC: Esophageal squamous cell carcinoma |
| HGIN: High-grade intraepithelial neoplasias |
| LGIN: Low-grade intraepithelial neoplasias |
| GC | 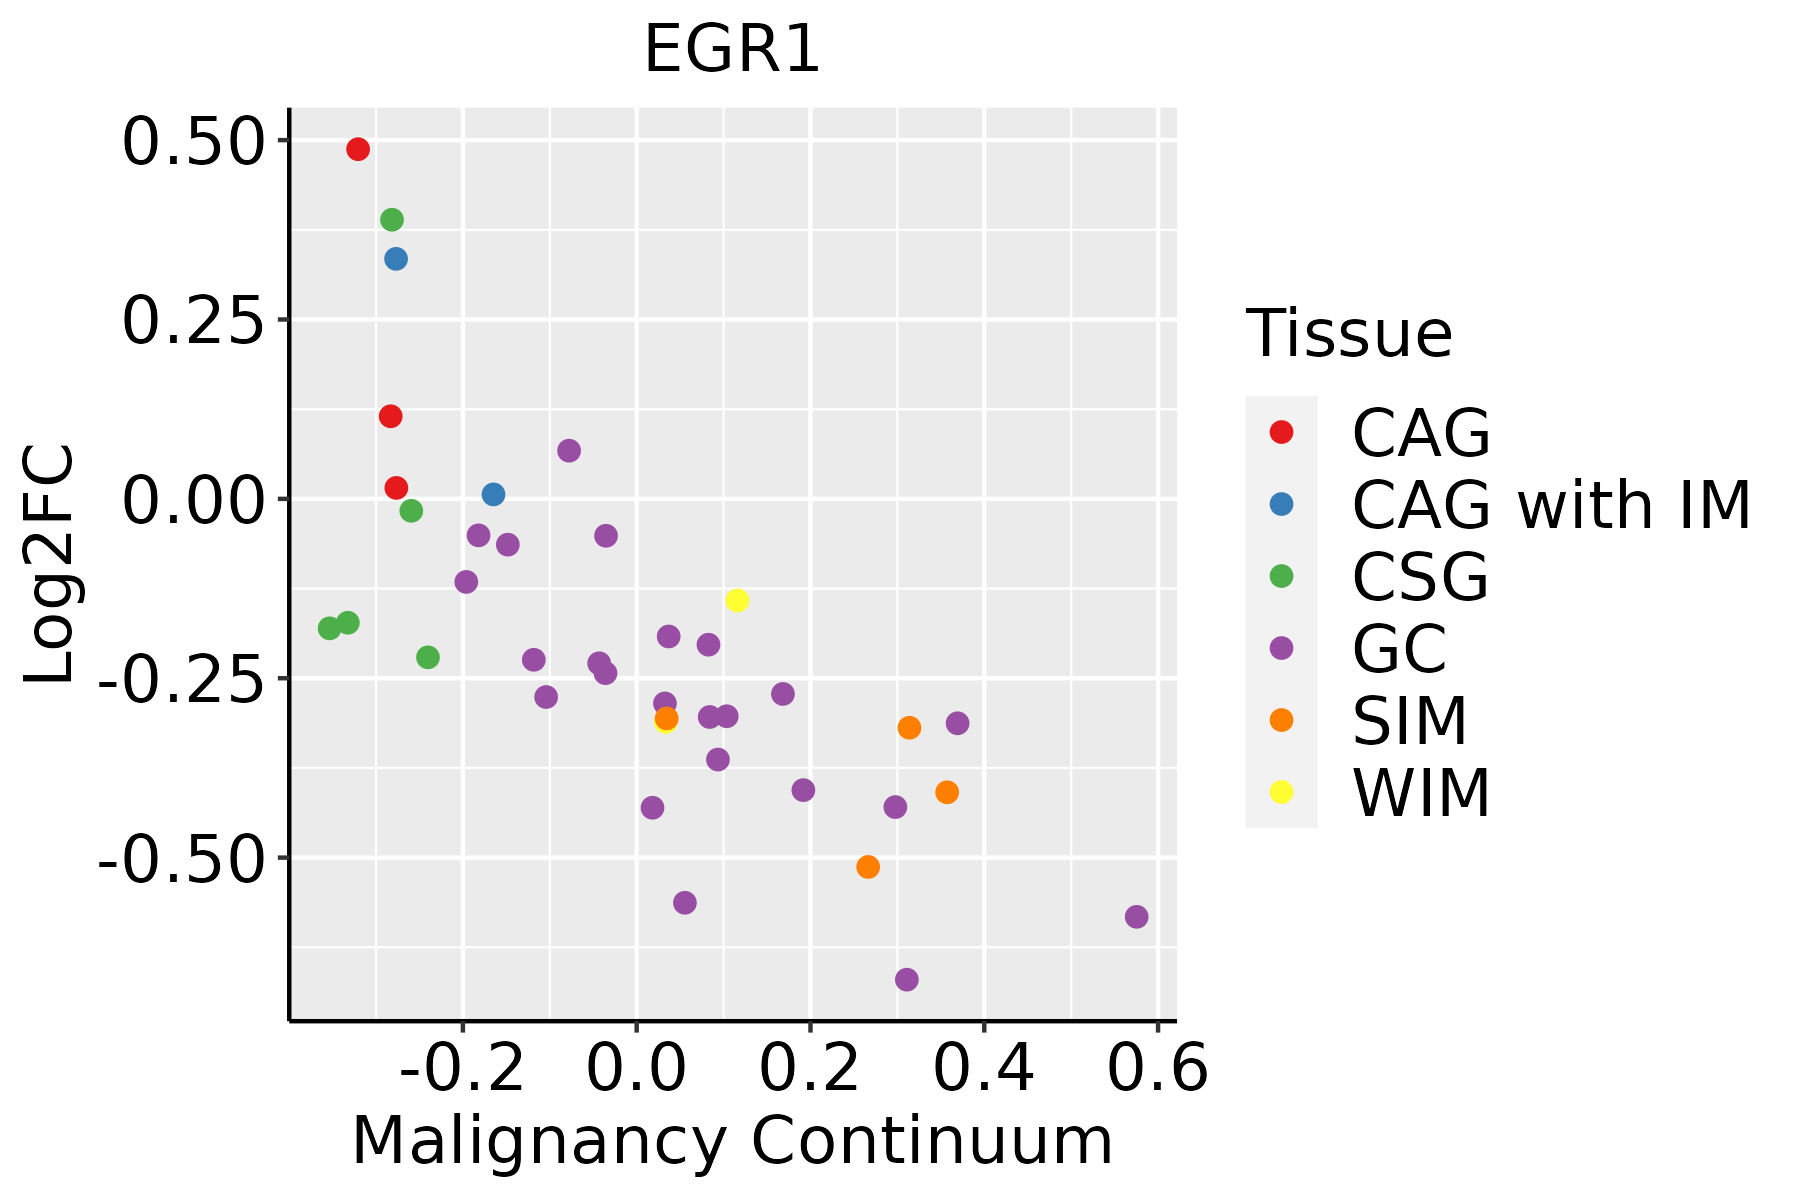 | CAG: Chronic atrophic gastritis |
| CAG with IM: Chronic atrophic gastritis with intestinal metaplasia |
| CSG: Chronic superficial gastritis |
| GC: Gastric cancer |
| SIM: Severe intestinal metaplasia |
| WIM: Wild intestinal metaplasia |
| Liver |  | HCC: Hepatocellular carcinoma |
| NAFLD: Non-alcoholic fatty liver disease |
| Lung | 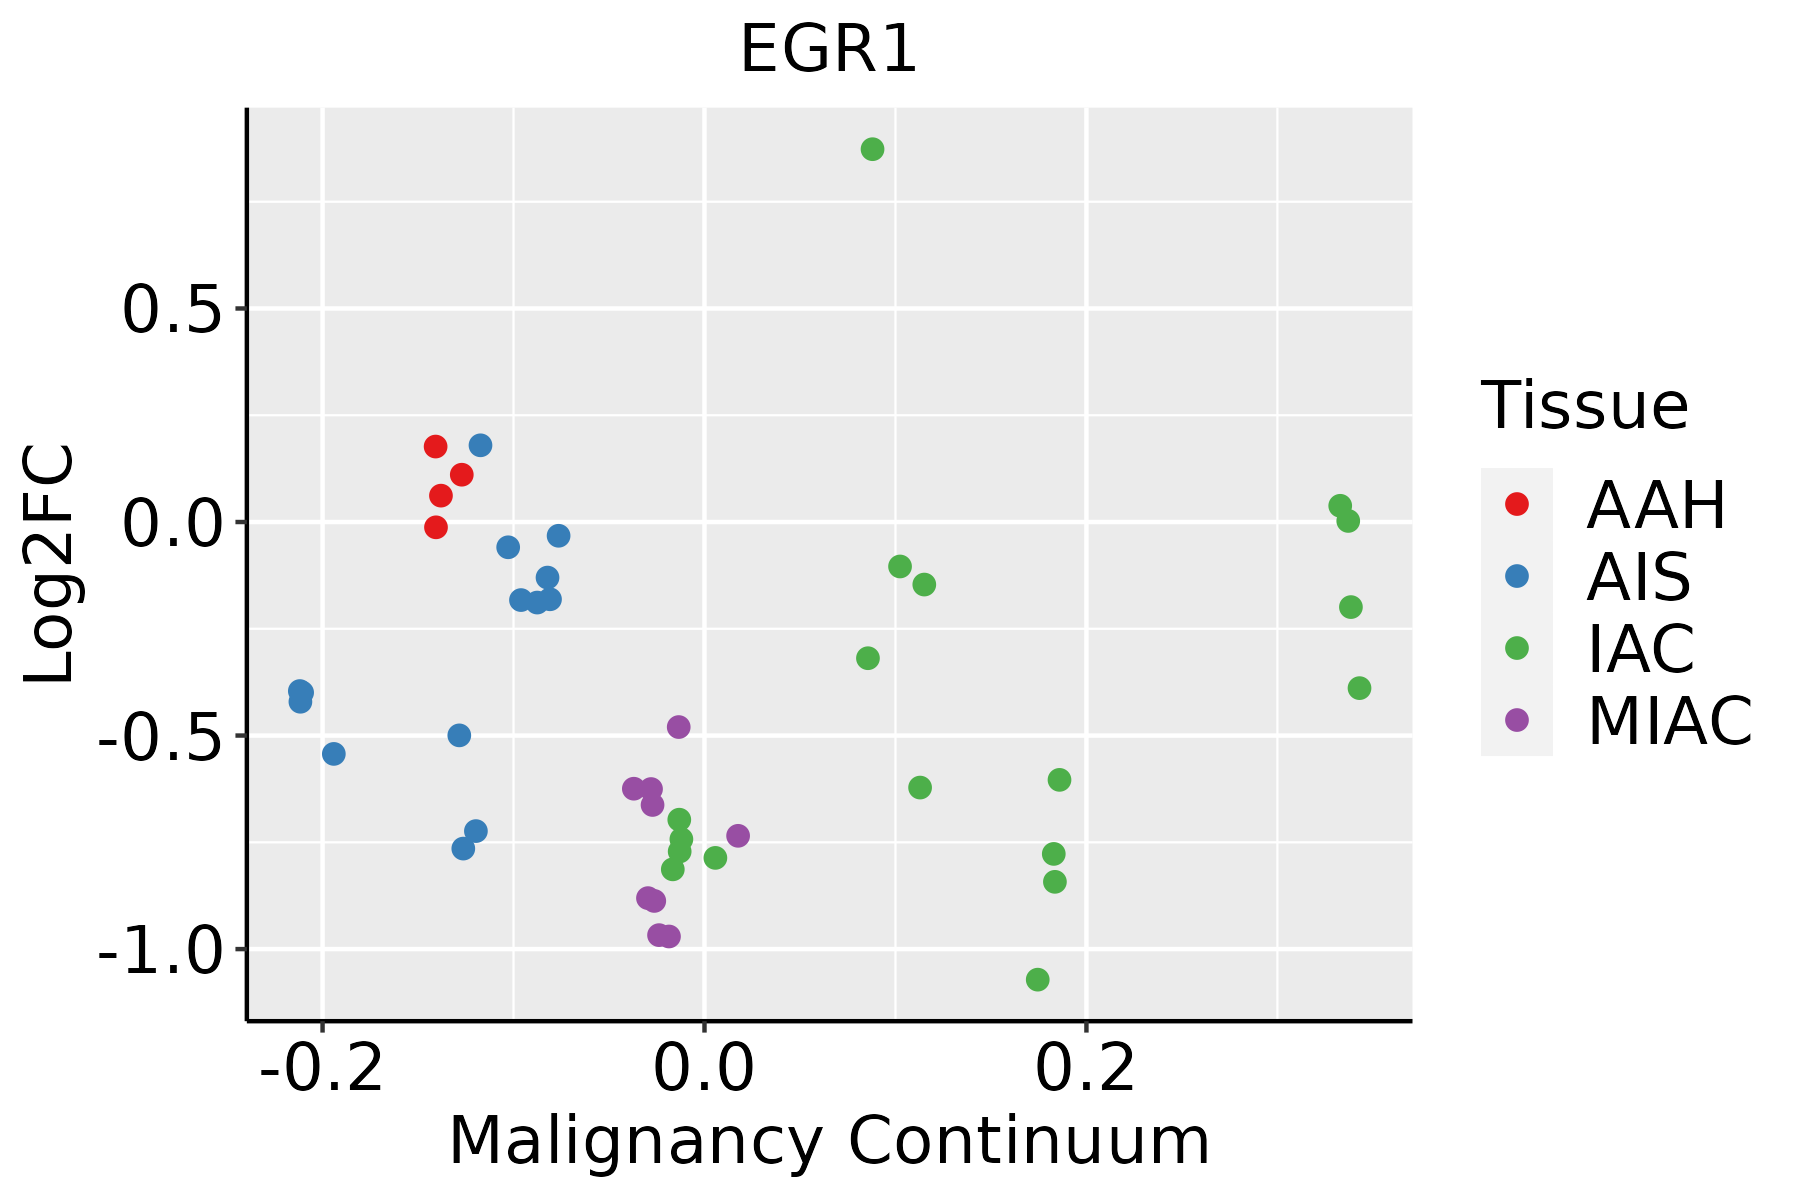 | AAH: Atypical adenomatous hyperplasia |
| AIS: Adenocarcinoma in situ |
| IAC: Invasive lung adenocarcinoma |
| MIA: Minimally invasive adenocarcinoma |
| Oral Cavity | 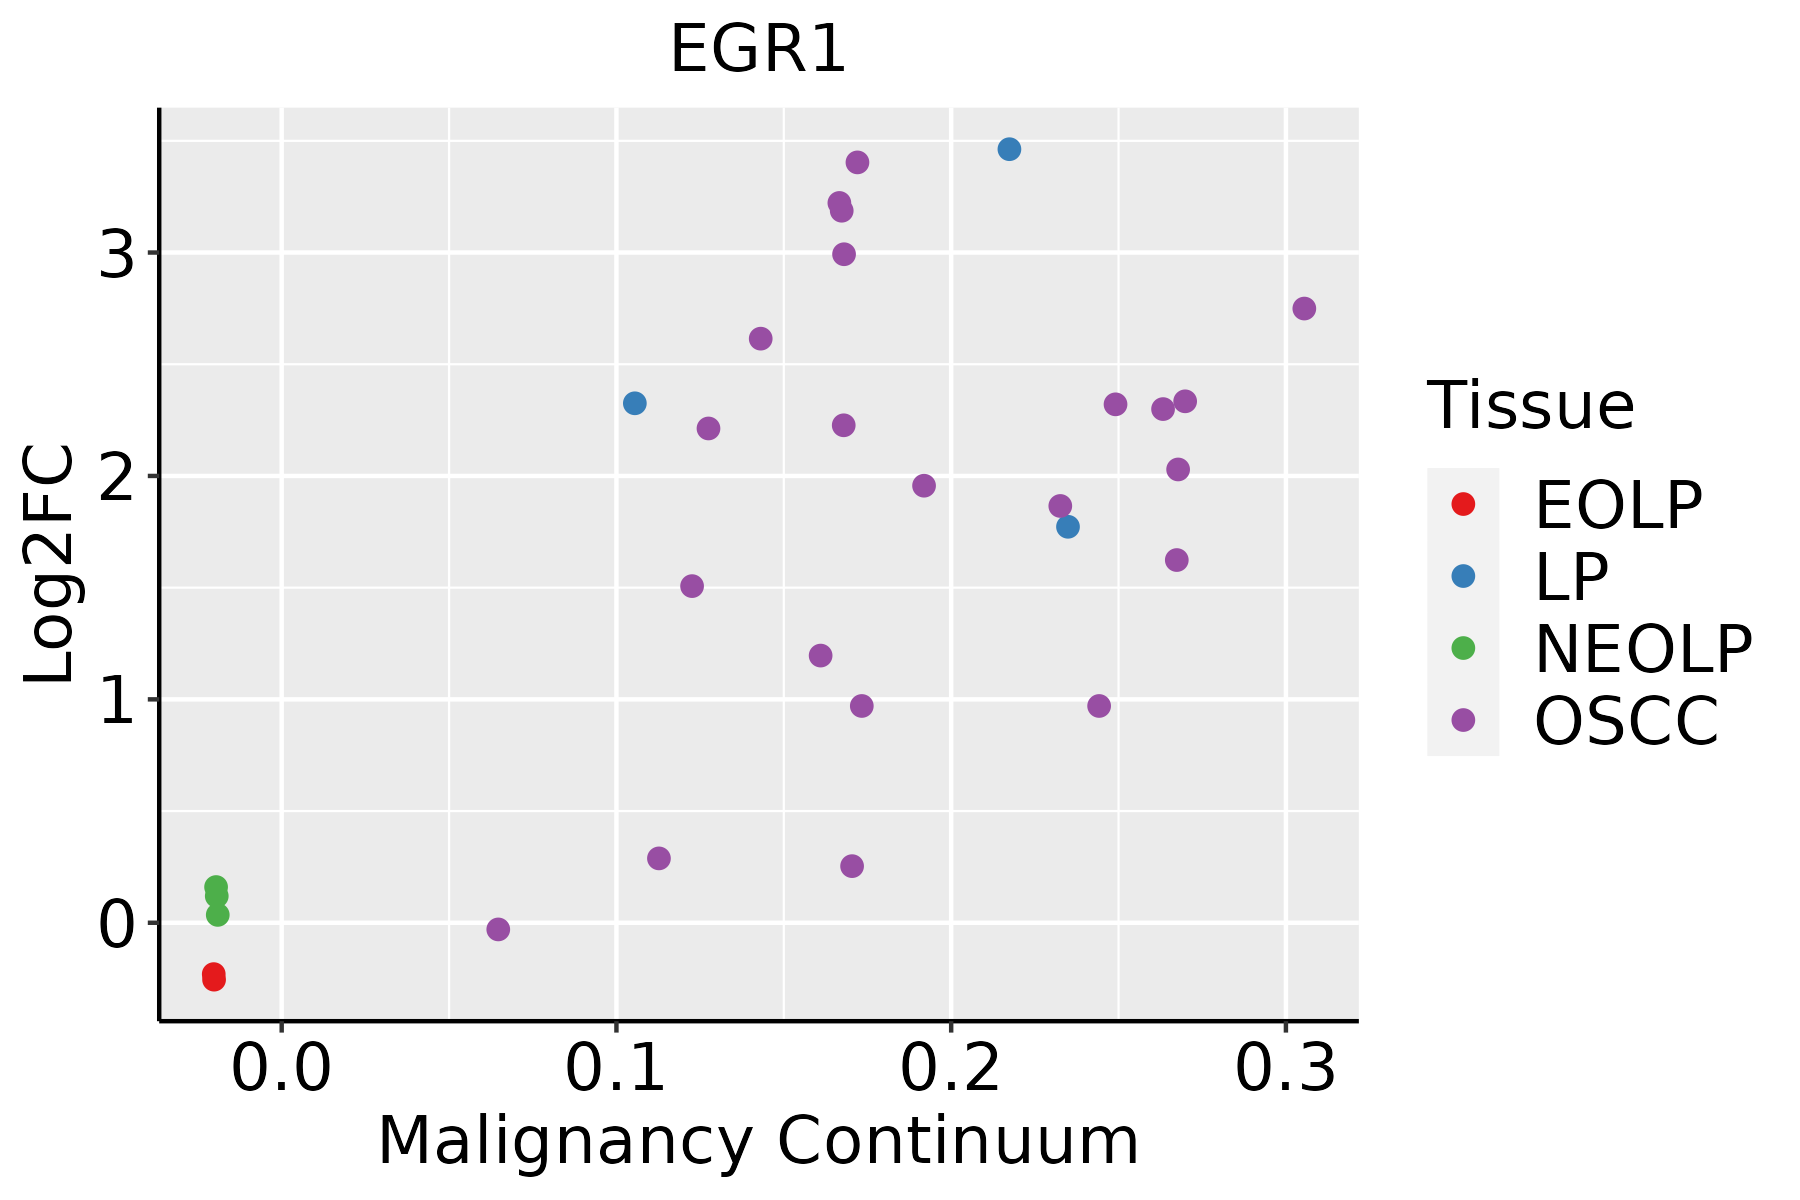 | EOLP: Erosive Oral lichen planus |
| LP: leukoplakia |
| NEOLP: Non-erosive oral lichen planus |
| OSCC: Oral squamous cell carcinoma |
| Prostate |  | BPH: Benign Prostatic Hyperplasia |
| Skin |  | AK: Actinic keratosis |
| cSCC: Cutaneous squamous cell carcinoma |
| SCCIS:squamous cell carcinoma in situ |
| Thyroid | 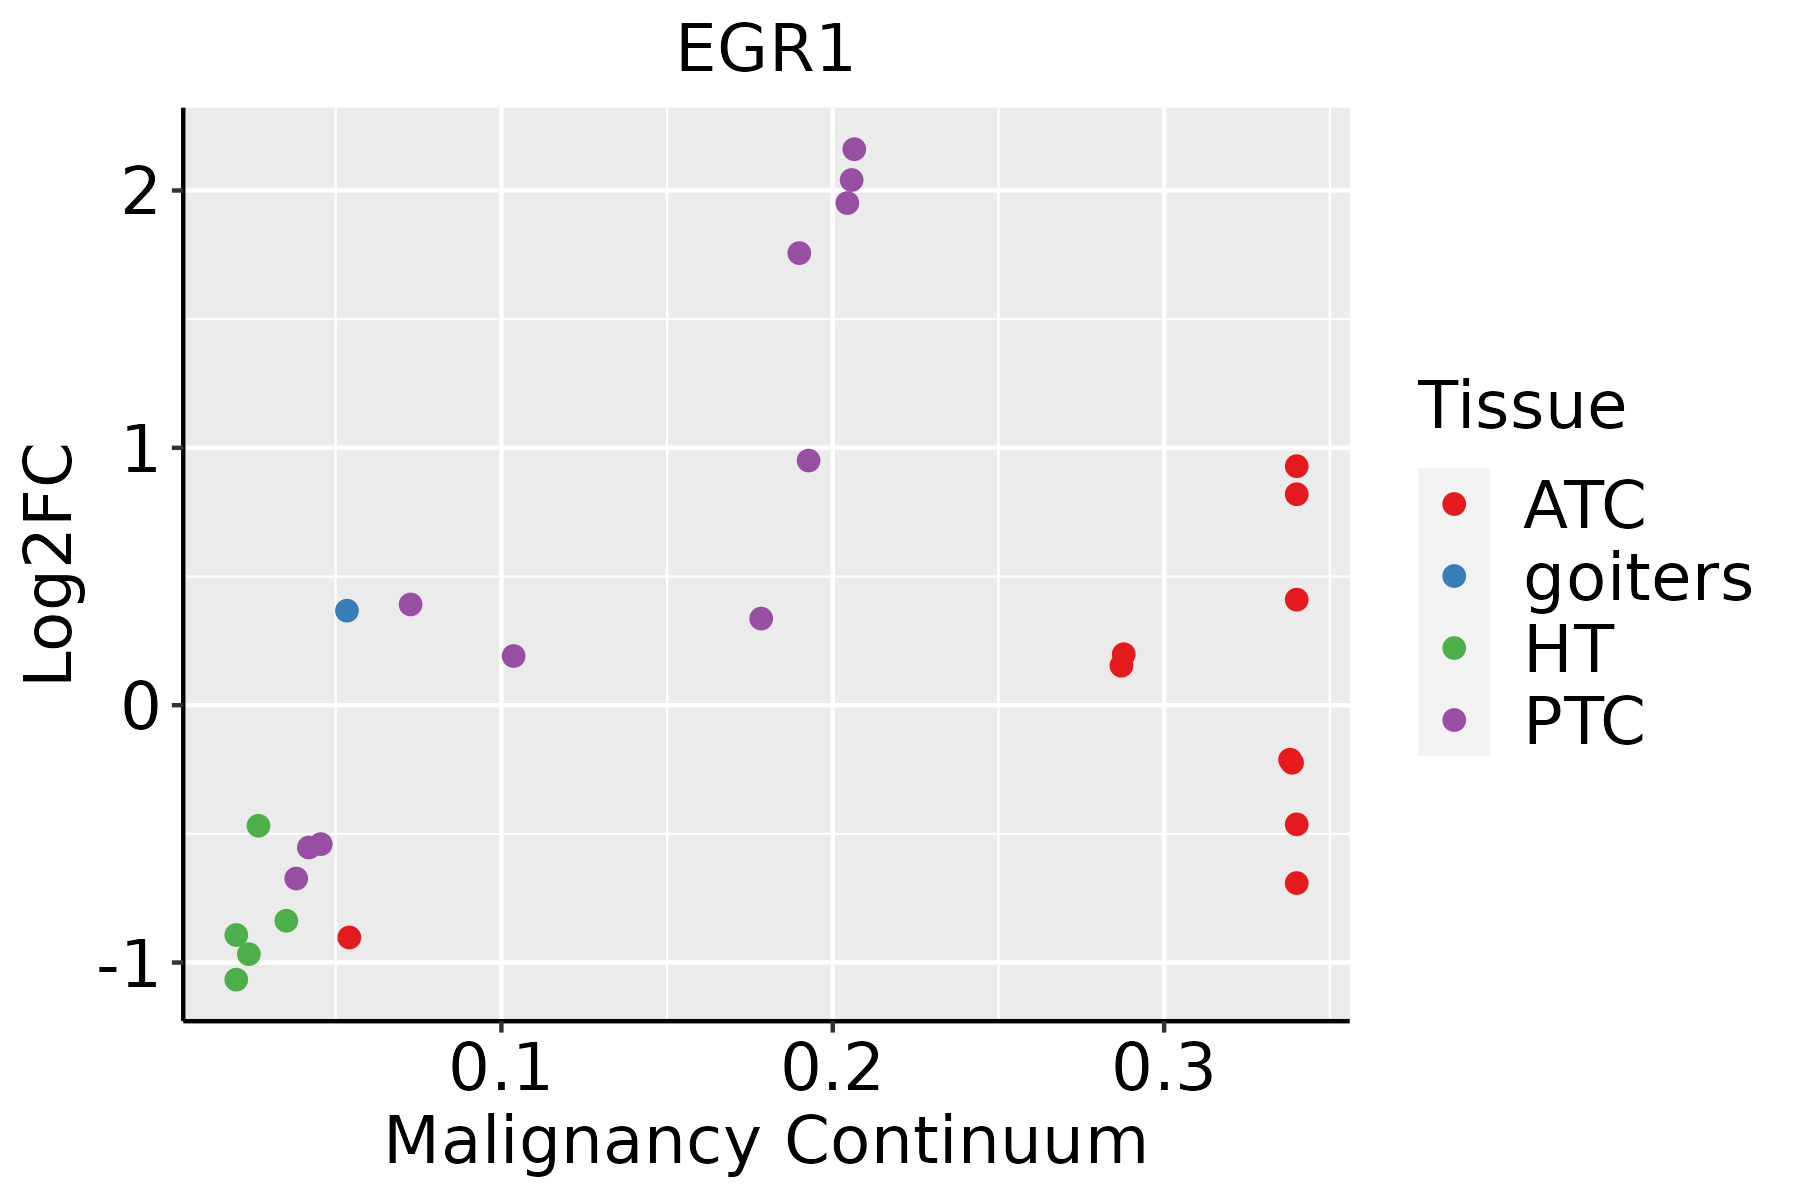 | ATC: Anaplastic thyroid cancer |
| HT: Hashimoto's thyroiditis |
| PTC: Papillary thyroid cancer |
| GO ID | Tissue | Disease Stage | Description | Gene Ratio | Bg Ratio | pvalue | p.adjust | Count |
| GO:00362939 | Breast | Precancer | response to decreased oxygen levels | 53/1080 | 322/18723 | 4.09e-12 | 6.84e-10 | 53 |
| GO:00016669 | Breast | Precancer | response to hypoxia | 51/1080 | 307/18723 | 7.33e-12 | 1.11e-09 | 51 |
| GO:00704829 | Breast | Precancer | response to oxygen levels | 55/1080 | 347/18723 | 7.47e-12 | 1.11e-09 | 55 |
| GO:00362948 | Breast | Precancer | cellular response to decreased oxygen levels | 31/1080 | 161/18723 | 2.61e-09 | 2.11e-07 | 31 |
| GO:00714538 | Breast | Precancer | cellular response to oxygen levels | 32/1080 | 177/18723 | 7.32e-09 | 5.52e-07 | 32 |
| GO:00709979 | Breast | Precancer | neuron death | 50/1080 | 361/18723 | 7.75e-09 | 5.70e-07 | 50 |
| GO:00714565 | Breast | Precancer | cellular response to hypoxia | 29/1080 | 151/18723 | 8.98e-09 | 6.50e-07 | 29 |
| GO:19033209 | Breast | Precancer | regulation of protein modification by small protein conjugation or removal | 38/1080 | 242/18723 | 1.71e-08 | 1.17e-06 | 38 |
| GO:19012149 | Breast | Precancer | regulation of neuron death | 41/1080 | 319/18723 | 1.27e-06 | 4.80e-05 | 41 |
| GO:00018196 | Breast | Precancer | positive regulation of cytokine production | 52/1080 | 467/18723 | 4.18e-06 | 1.29e-04 | 52 |
| GO:00436209 | Breast | Precancer | regulation of DNA-templated transcription in response to stress | 13/1080 | 53/18723 | 7.06e-06 | 1.95e-04 | 13 |
| GO:00436189 | Breast | Precancer | regulation of transcription from RNA polymerase II promoter in response to stress | 12/1080 | 47/18723 | 1.02e-05 | 2.67e-04 | 12 |
| GO:00103323 | Breast | Precancer | response to gamma radiation | 13/1080 | 56/18723 | 1.35e-05 | 3.38e-04 | 13 |
| GO:00421107 | Breast | Precancer | T cell activation | 52/1080 | 487/18723 | 1.37e-05 | 3.42e-04 | 52 |
| GO:00342849 | Breast | Precancer | response to monosaccharide | 29/1080 | 225/18723 | 4.19e-05 | 9.00e-04 | 29 |
| GO:00097439 | Breast | Precancer | response to carbohydrate | 31/1080 | 253/18723 | 6.15e-05 | 1.25e-03 | 31 |
| GO:00093148 | Breast | Precancer | response to radiation | 47/1080 | 456/18723 | 8.39e-05 | 1.62e-03 | 47 |
| GO:00712147 | Breast | Precancer | cellular response to abiotic stimulus | 37/1080 | 331/18723 | 9.12e-05 | 1.73e-03 | 37 |
| GO:01040047 | Breast | Precancer | cellular response to environmental stimulus | 37/1080 | 331/18723 | 9.12e-05 | 1.73e-03 | 37 |
| GO:0002931 | Breast | Precancer | response to ischemia | 12/1080 | 58/18723 | 9.65e-05 | 1.80e-03 | 12 |
| Pathway ID | Tissue | Disease Stage | Description | Gene Ratio | Bg Ratio | pvalue | p.adjust | qvalue | Count |
| hsa0502016 | Breast | Precancer | Prion disease | 95/684 | 273/8465 | 1.39e-37 | 1.46e-35 | 1.12e-35 | 95 |
| hsa0516618 | Breast | Precancer | Human T-cell leukemia virus 1 infection | 33/684 | 222/8465 | 4.29e-04 | 3.31e-03 | 2.53e-03 | 33 |
| hsa0502017 | Breast | Precancer | Prion disease | 95/684 | 273/8465 | 1.39e-37 | 1.46e-35 | 1.12e-35 | 95 |
| hsa0516619 | Breast | Precancer | Human T-cell leukemia virus 1 infection | 33/684 | 222/8465 | 4.29e-04 | 3.31e-03 | 2.53e-03 | 33 |
| hsa0502023 | Breast | IDC | Prion disease | 102/867 | 273/8465 | 3.70e-34 | 4.01e-32 | 3.00e-32 | 102 |
| hsa0516624 | Breast | IDC | Human T-cell leukemia virus 1 infection | 40/867 | 222/8465 | 2.52e-04 | 2.21e-03 | 1.66e-03 | 40 |
| hsa0502033 | Breast | IDC | Prion disease | 102/867 | 273/8465 | 3.70e-34 | 4.01e-32 | 3.00e-32 | 102 |
| hsa0516634 | Breast | IDC | Human T-cell leukemia virus 1 infection | 40/867 | 222/8465 | 2.52e-04 | 2.21e-03 | 1.66e-03 | 40 |
| hsa0502043 | Breast | DCIS | Prion disease | 100/846 | 273/8465 | 1.44e-33 | 1.55e-31 | 1.14e-31 | 100 |
| hsa0516642 | Breast | DCIS | Human T-cell leukemia virus 1 infection | 41/846 | 222/8465 | 7.03e-05 | 6.88e-04 | 5.07e-04 | 41 |
| hsa0502053 | Breast | DCIS | Prion disease | 100/846 | 273/8465 | 1.44e-33 | 1.55e-31 | 1.14e-31 | 100 |
| hsa0516652 | Breast | DCIS | Human T-cell leukemia virus 1 infection | 41/846 | 222/8465 | 7.03e-05 | 6.88e-04 | 5.07e-04 | 41 |
| hsa0502018 | Cervix | CC | Prion disease | 98/1267 | 273/8465 | 2.64e-18 | 1.42e-16 | 8.42e-17 | 98 |
| hsa0516620 | Cervix | CC | Human T-cell leukemia virus 1 infection | 61/1267 | 222/8465 | 8.13e-07 | 7.98e-06 | 4.72e-06 | 61 |
| hsa0491212 | Cervix | CC | GnRH signaling pathway | 26/1267 | 93/8465 | 8.72e-04 | 3.87e-03 | 2.29e-03 | 26 |
| hsa0492812 | Cervix | CC | Parathyroid hormone synthesis, secretion and action | 27/1267 | 106/8465 | 3.12e-03 | 1.19e-02 | 7.03e-03 | 27 |
| hsa049336 | Cervix | CC | AGE-RAGE signaling pathway in diabetic complications | 25/1267 | 100/8465 | 5.64e-03 | 1.88e-02 | 1.11e-02 | 25 |
| hsa0502019 | Cervix | CC | Prion disease | 98/1267 | 273/8465 | 2.64e-18 | 1.42e-16 | 8.42e-17 | 98 |
| hsa05166110 | Cervix | CC | Human T-cell leukemia virus 1 infection | 61/1267 | 222/8465 | 8.13e-07 | 7.98e-06 | 4.72e-06 | 61 |
| hsa0491213 | Cervix | CC | GnRH signaling pathway | 26/1267 | 93/8465 | 8.72e-04 | 3.87e-03 | 2.29e-03 | 26 |
| Hugo Symbol | Variant Class | Variant Classification | dbSNP RS | HGVSc | HGVSp | HGVSp Short | SWISSPROT | BIOTYPE | SIFT | PolyPhen | Tumor Sample Barcode | Tissue | Histology | Sex | Age | Stage | Therapy Types | Drugs | Outcome |
| EGR1 | SNV | Missense_Mutation | | c.1145A>G | p.His382Arg | p.H382R | P18146 | protein_coding | deleterious(0) | probably_damaging(0.997) | TCGA-D8-A1XK-01 | Breast | breast invasive carcinoma | Female | <65 | I/II | Chemotherapy | doxorubicine+cyclophosphamide | SD |
| EGR1 | insertion | Frame_Shift_Ins | novel | c.358_359insCCGTGATCCTTGGCCGTGGATGTCCCGGCAGCCCGGGTTTGGG | p.Ser120ThrfsTer110 | p.S120Tfs*110 | P18146 | protein_coding | | | TCGA-A8-A093-01 | Breast | breast invasive carcinoma | Female | <65 | I/II | Hormone Therapy | tamoxiphen | SD |
| EGR1 | insertion | Frame_Shift_Ins | rs746692720 | c.993_994insC | p.His334ProfsTer13 | p.H334Pfs*13 | P18146 | protein_coding | | | TCGA-AN-A03X-01 | Breast | breast invasive carcinoma | Female | >=65 | I/II | Unknown | Unknown | SD |
| EGR1 | SNV | Missense_Mutation | novel | c.1258N>T | p.Arg420Trp | p.R420W | P18146 | protein_coding | deleterious(0) | probably_damaging(0.986) | TCGA-EA-A3HU-01 | Cervix | cervical & endocervical cancer | Female | <65 | I/II | Unknown | Unknown | SD |
| EGR1 | SNV | Missense_Mutation | | c.62G>A | p.Gly21Glu | p.G21E | P18146 | protein_coding | deleterious_low_confidence(0.01) | benign(0.186) | TCGA-EK-A2PG-01 | Cervix | cervical & endocervical cancer | Female | >=65 | I/II | Unknown | Unknown | SD |
| EGR1 | SNV | Missense_Mutation | | c.1055C>T | p.Ser352Phe | p.S352F | P18146 | protein_coding | deleterious(0) | probably_damaging(0.916) | TCGA-EK-A2PG-01 | Cervix | cervical & endocervical cancer | Female | >=65 | I/II | Unknown | Unknown | SD |
| EGR1 | SNV | Missense_Mutation | novel | c.1070G>T | p.Arg357Leu | p.R357L | P18146 | protein_coding | deleterious(0) | probably_damaging(0.998) | TCGA-EK-A2R9-01 | Cervix | cervical & endocervical cancer | Female | <65 | I/II | Unknown | Unknown | SD |
| EGR1 | SNV | Missense_Mutation | novel | c.114N>A | p.Met38Ile | p.M38I | P18146 | protein_coding | tolerated_low_confidence(0.1) | benign(0.015) | TCGA-MA-AA41-01 | Cervix | cervical & endocervical cancer | Female | <65 | I/II | Unknown | Unknown | SD |
| EGR1 | SNV | Missense_Mutation | novel | c.931T>C | p.Tyr311His | p.Y311H | P18146 | protein_coding | tolerated(0.12) | probably_damaging(0.96) | TCGA-5M-AAT6-01 | Colorectum | colon adenocarcinoma | Female | <65 | III/IV | Unknown | Unknown | PD |
| EGR1 | SNV | Missense_Mutation | | c.964C>T | p.Arg322Cys | p.R322C | P18146 | protein_coding | deleterious(0) | probably_damaging(0.994) | TCGA-AA-3663-01 | Colorectum | colon adenocarcinoma | Male | <65 | I/II | Unknown | Unknown | SD |


