
|
|||||
|
 | |
| |
| |
| |
| |
| |
|
Gene: EGLN3 |
Gene summary for EGLN3 |
| Gene information | Species | Human | Gene symbol | EGLN3 | Gene ID | 112399 |
| Gene name | egl-9 family hypoxia inducible factor 3 | |
| Gene Alias | HIFP4H3 | |
| Cytomap | 14q13.1 | |
| Gene Type | protein-coding | GO ID | GO:0001666 | UniProtAcc | B3KVT0 |
Top |
Malignant transformation analysis |
| Identification of the aberrant gene expression in precancerous and cancerous lesions by comparing the gene expression of stem-like cells in diseased tissues with normal stem cells |
| Entrez ID | Symbol | Replicates | Species | Organ | Tissue | Adj P-value | Log2FC | Malignancy |
| 112399 | EGLN3 | GSM4909282 | Human | Breast | IDC | 1.12e-04 | 3.40e-01 | -0.0288 |
| 112399 | EGLN3 | GSM4909286 | Human | Breast | IDC | 7.01e-03 | -1.32e-01 | 0.1081 |
| 112399 | EGLN3 | GSM4909292 | Human | Breast | IDC | 1.57e-08 | 8.55e-01 | 0.1236 |
| 112399 | EGLN3 | GSM4909301 | Human | Breast | IDC | 3.11e-02 | -1.27e-01 | 0.1577 |
| 112399 | EGLN3 | GSM4909311 | Human | Breast | IDC | 1.48e-02 | -1.32e-01 | 0.1534 |
| 112399 | EGLN3 | GSM4909315 | Human | Breast | IDC | 1.25e-13 | 5.38e-01 | 0.21 |
| 112399 | EGLN3 | ctrl6 | Human | Breast | Precancer | 2.52e-10 | 5.86e-01 | -0.0061 |
| 112399 | EGLN3 | brca3 | Human | Breast | Precancer | 8.70e-23 | 5.48e-01 | -0.0263 |
| 112399 | EGLN3 | brca7 | Human | Breast | Precancer | 1.43e-11 | 9.76e-01 | -0.009 |
| 112399 | EGLN3 | brca10 | Human | Breast | Precancer | 7.40e-07 | 3.44e-01 | -0.0029 |
| 112399 | EGLN3 | DCIS2 | Human | Breast | DCIS | 1.35e-02 | -8.13e-02 | 0.0085 |
| 112399 | EGLN3 | CA_HPV_2 | Human | Cervix | CC | 3.42e-04 | 2.34e-01 | 0.0391 |
| 112399 | EGLN3 | CCI_1 | Human | Cervix | CC | 1.01e-20 | 1.78e+00 | 0.528 |
| 112399 | EGLN3 | Tumor | Human | Cervix | CC | 4.39e-36 | 7.02e-01 | 0.1241 |
| 112399 | EGLN3 | sample1 | Human | Cervix | CC | 9.72e-19 | 6.67e-01 | 0.0959 |
| 112399 | EGLN3 | sample3 | Human | Cervix | CC | 3.54e-64 | 1.03e+00 | 0.1387 |
| 112399 | EGLN3 | H2 | Human | Cervix | HSIL_HPV | 2.74e-05 | 2.45e-01 | 0.0632 |
| 112399 | EGLN3 | L1 | Human | Cervix | CC | 1.22e-03 | 4.00e-01 | 0.0802 |
| 112399 | EGLN3 | T1 | Human | Cervix | CC | 4.47e-46 | 9.00e-01 | 0.0918 |
| 112399 | EGLN3 | T2 | Human | Cervix | CC | 1.46e-03 | 4.14e-01 | 0.0709 |
| Page: 1 2 3 4 5 |
| Tissue | Expression Dynamics | Abbreviation |
| Breast | 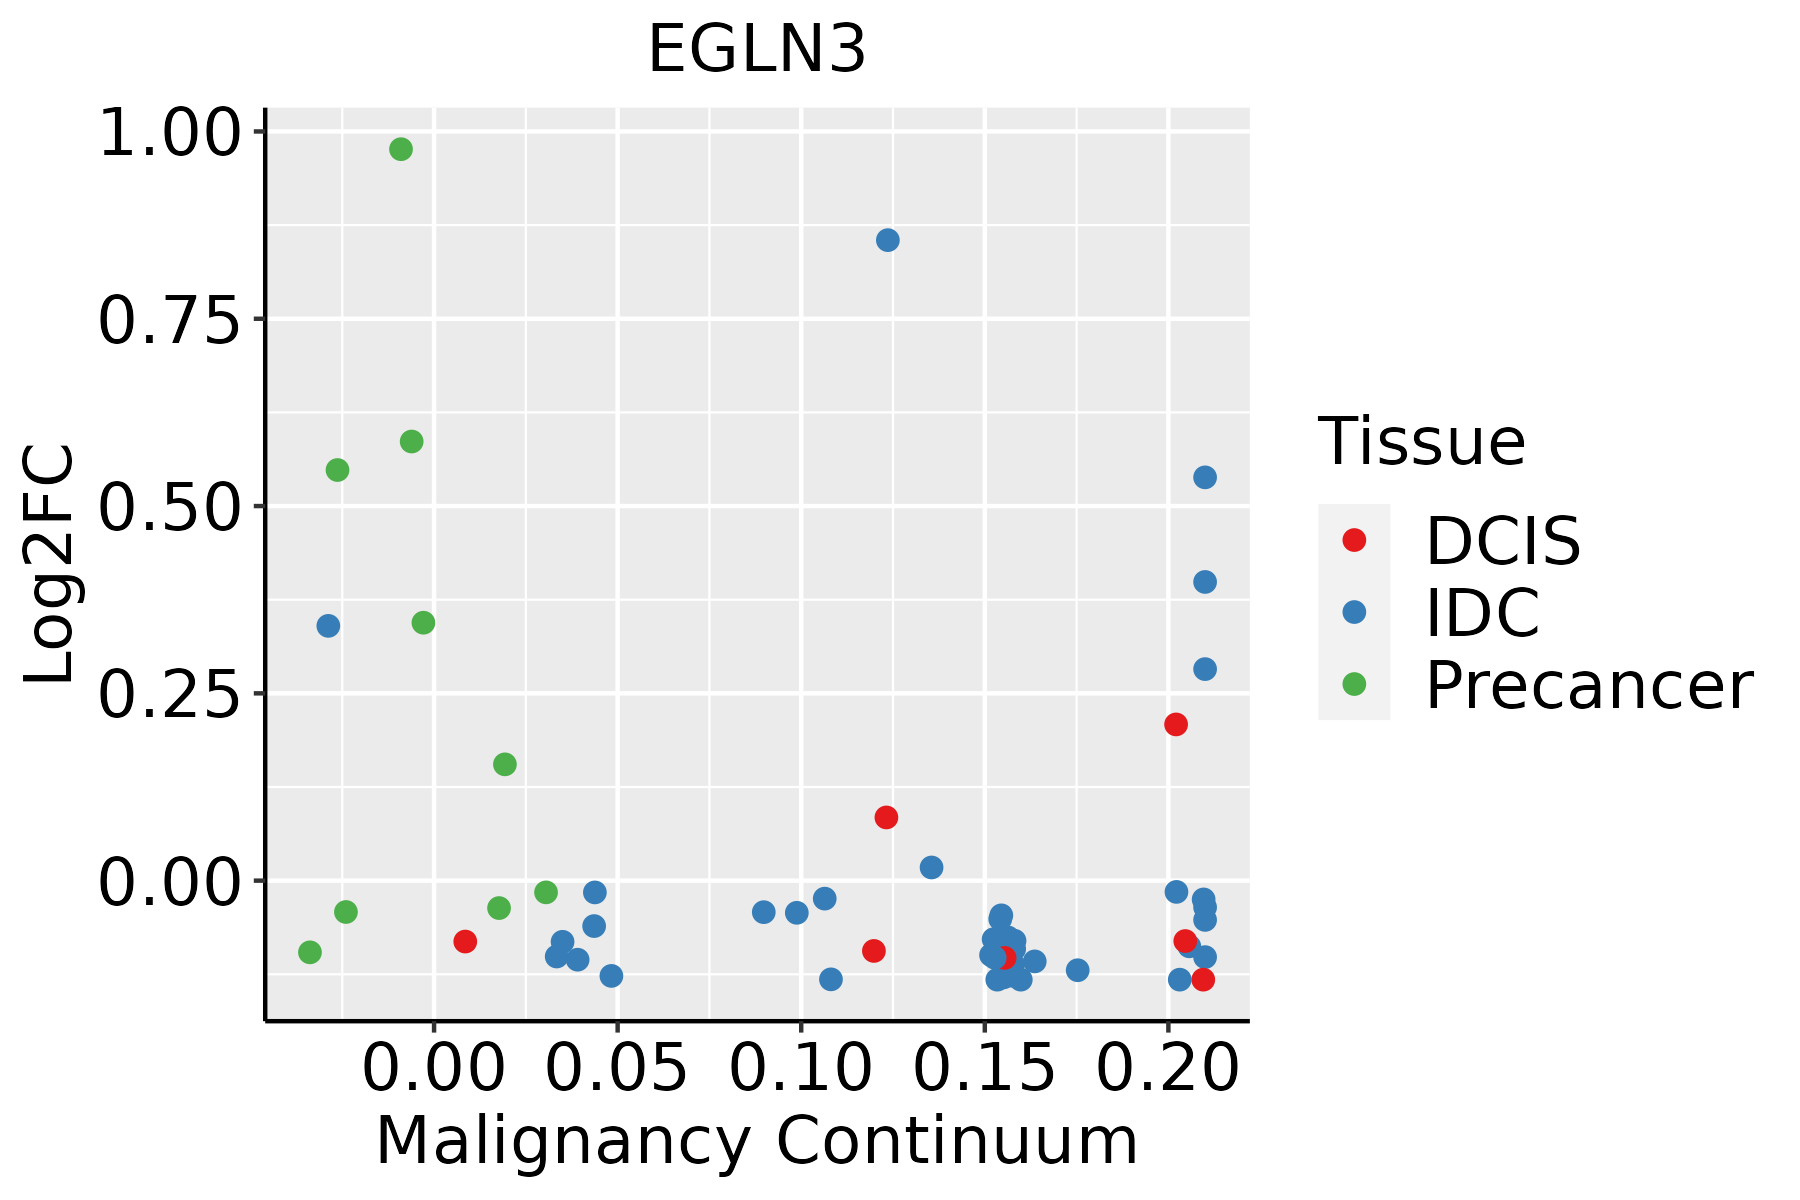 | IDC: Invasive ductal carcinoma |
| DCIS: Ductal carcinoma in situ | ||
| Precancer(BRCA1-mut): Precancerous lesion from BRCA1 mutation carriers | ||
| Cervix | 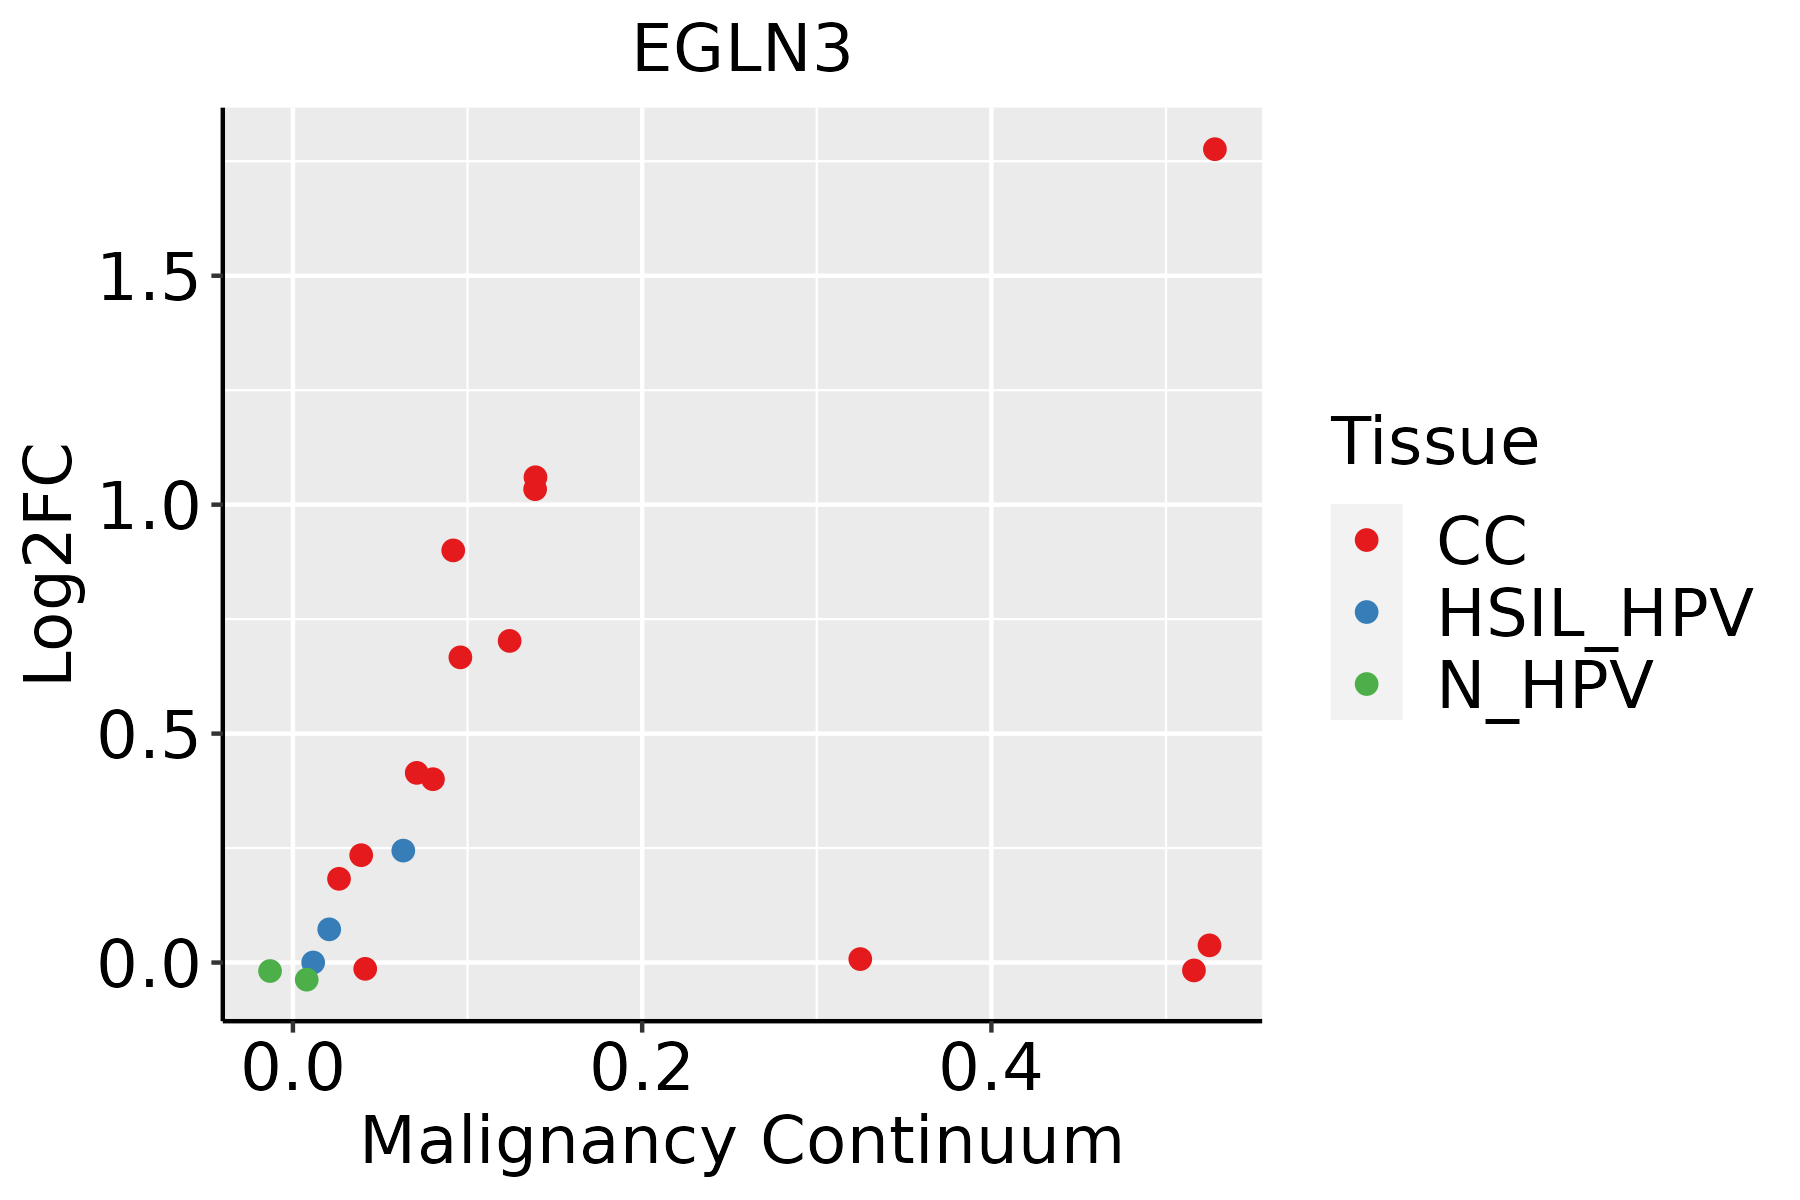 | CC: Cervix cancer |
| HSIL_HPV: HPV-infected high-grade squamous intraepithelial lesions | ||
| N_HPV: HPV-infected normal cervix | ||
| Esophagus | 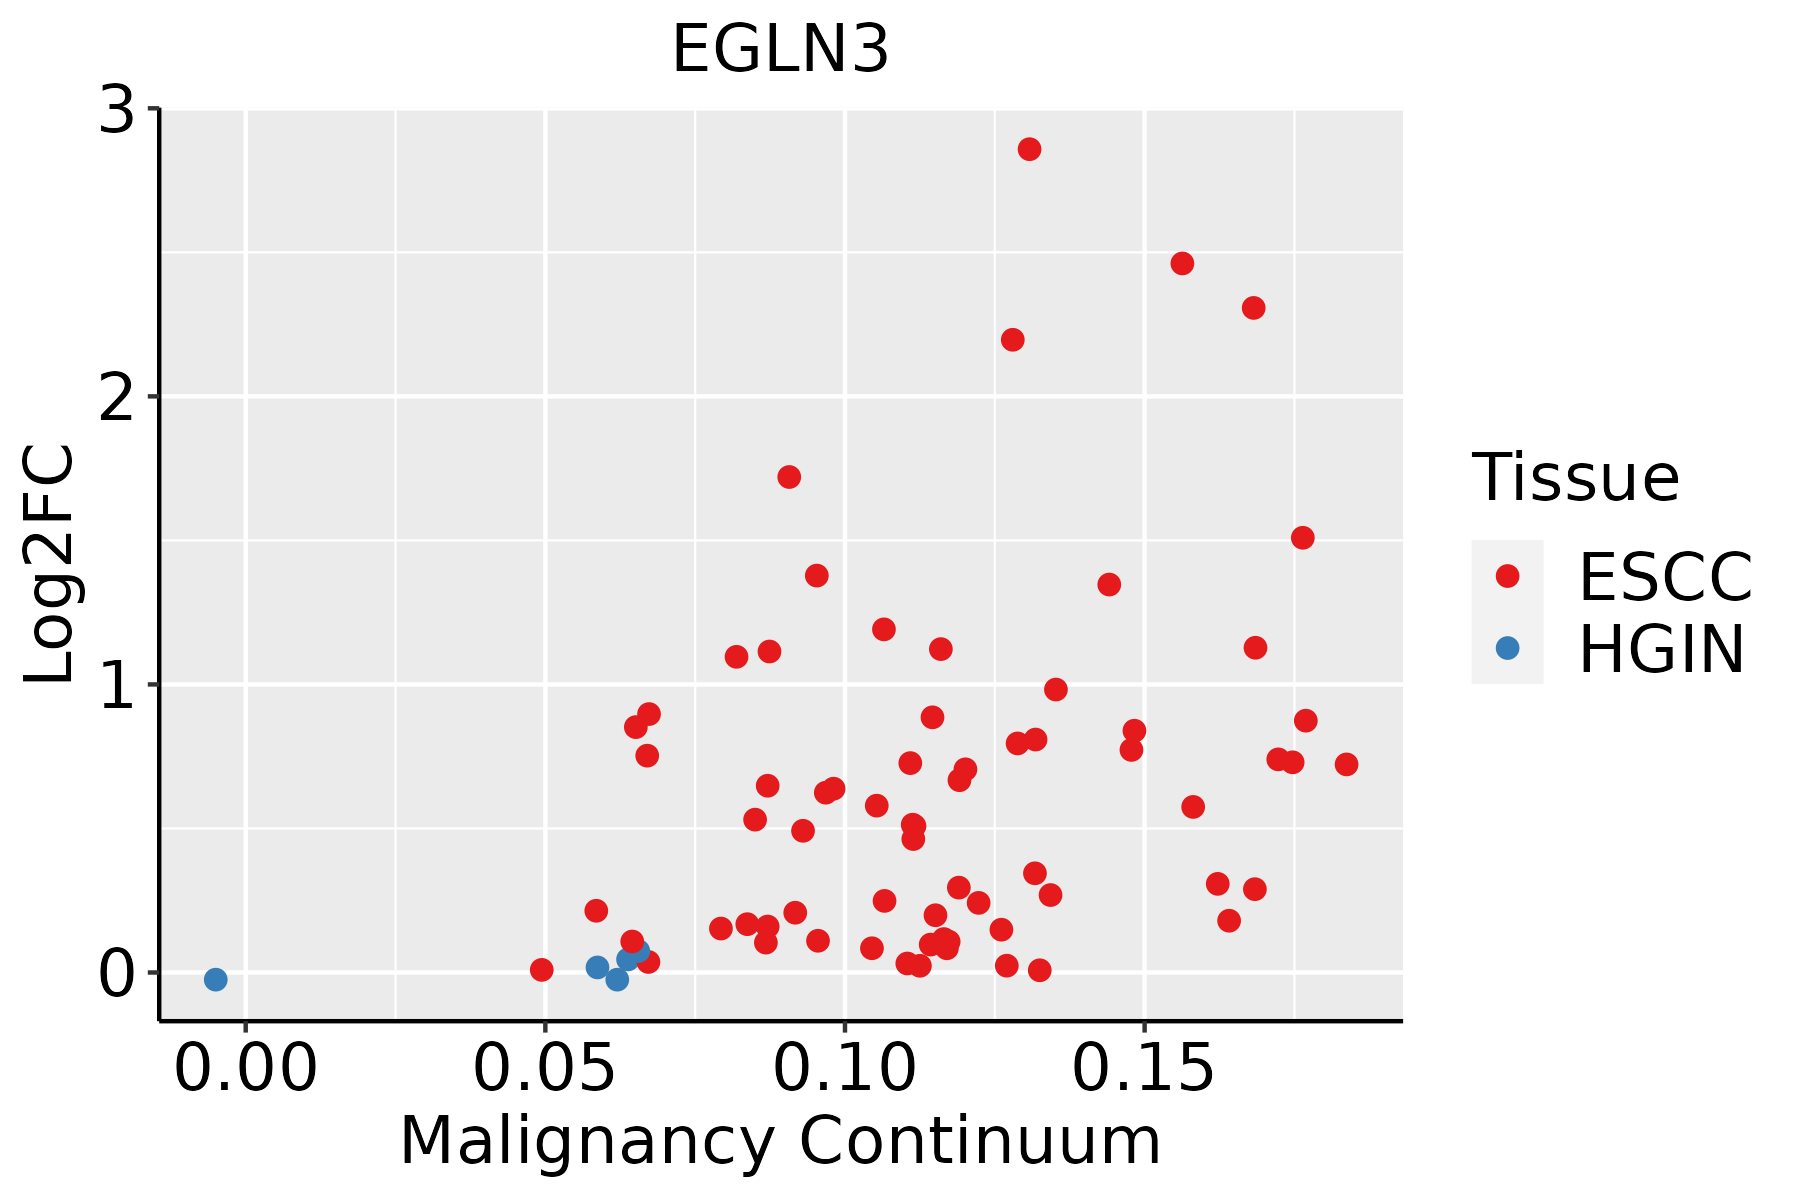 | ESCC: Esophageal squamous cell carcinoma |
| HGIN: High-grade intraepithelial neoplasias | ||
| LGIN: Low-grade intraepithelial neoplasias | ||
| Lung | 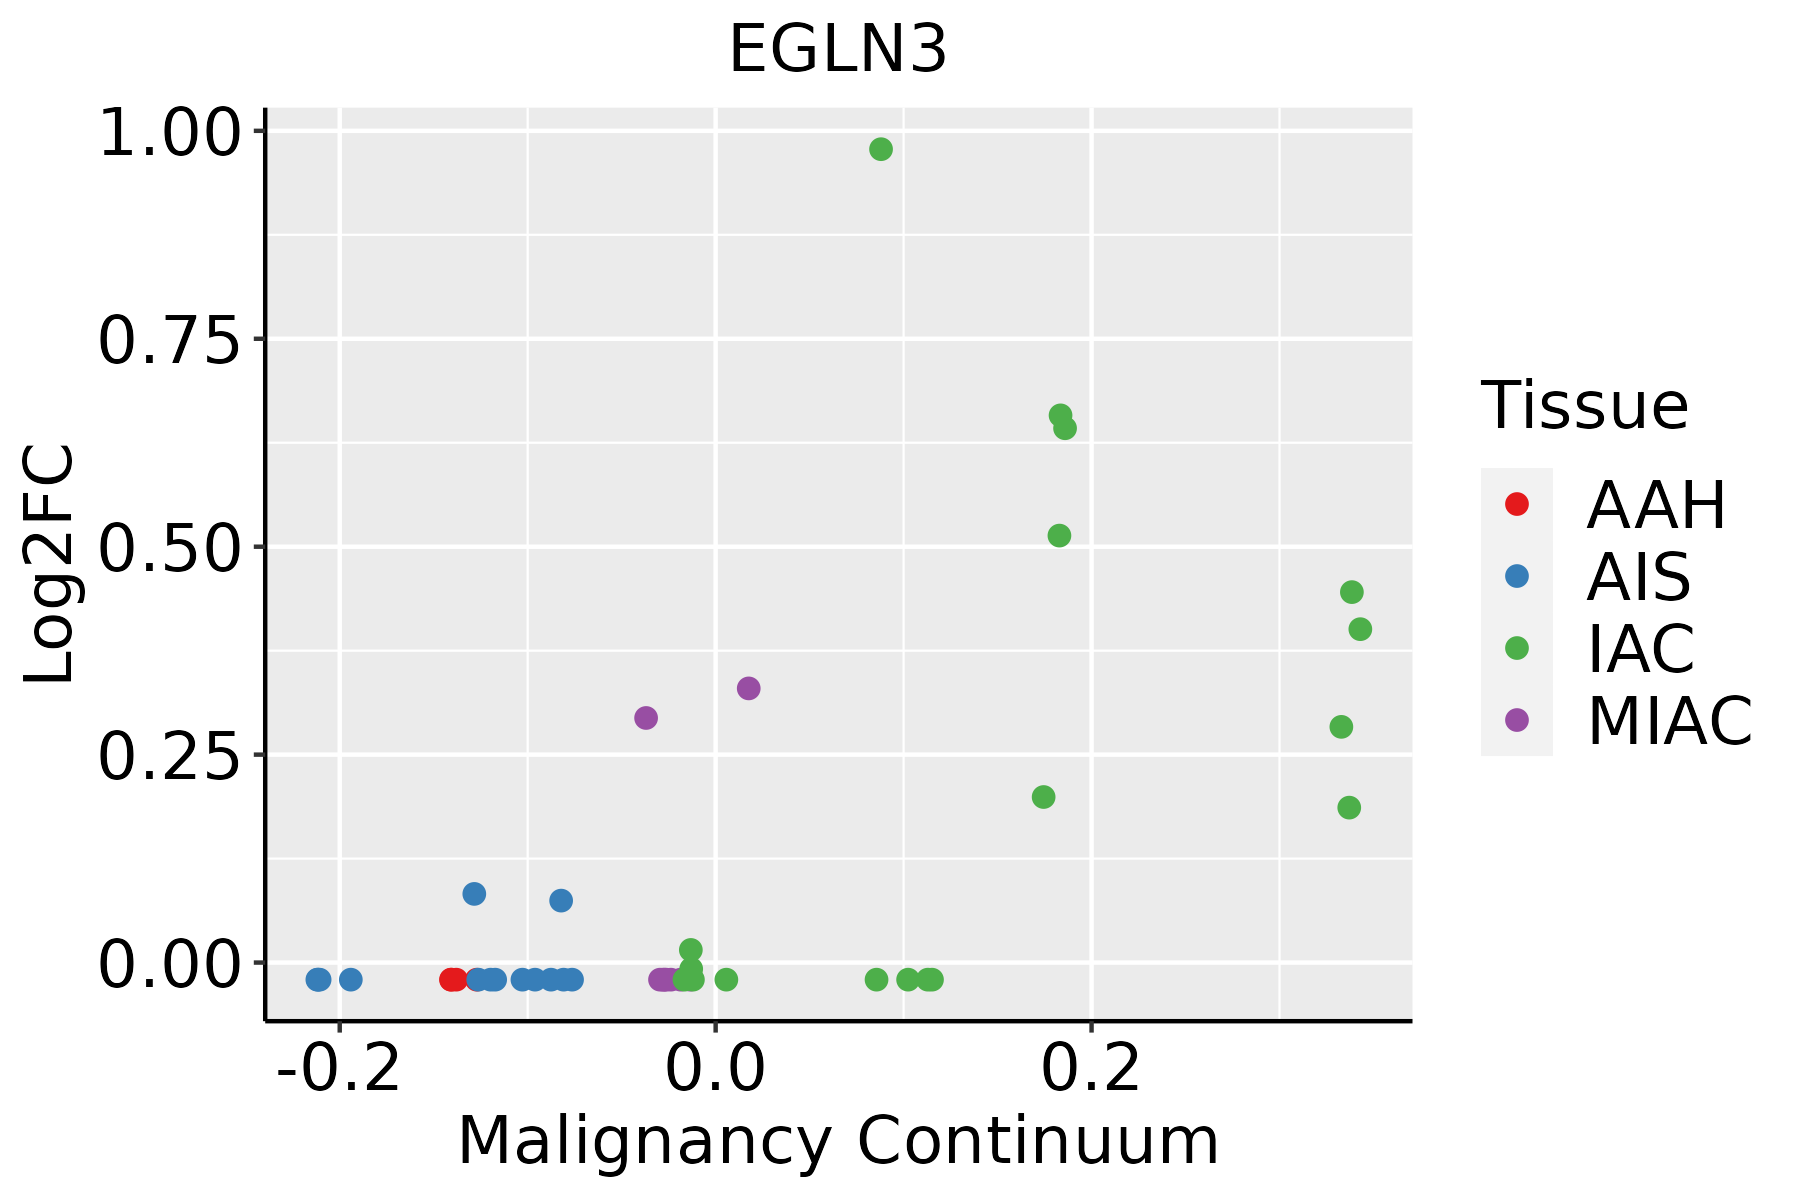 | AAH: Atypical adenomatous hyperplasia |
| AIS: Adenocarcinoma in situ | ||
| IAC: Invasive lung adenocarcinoma | ||
| MIA: Minimally invasive adenocarcinoma | ||
| Oral Cavity | 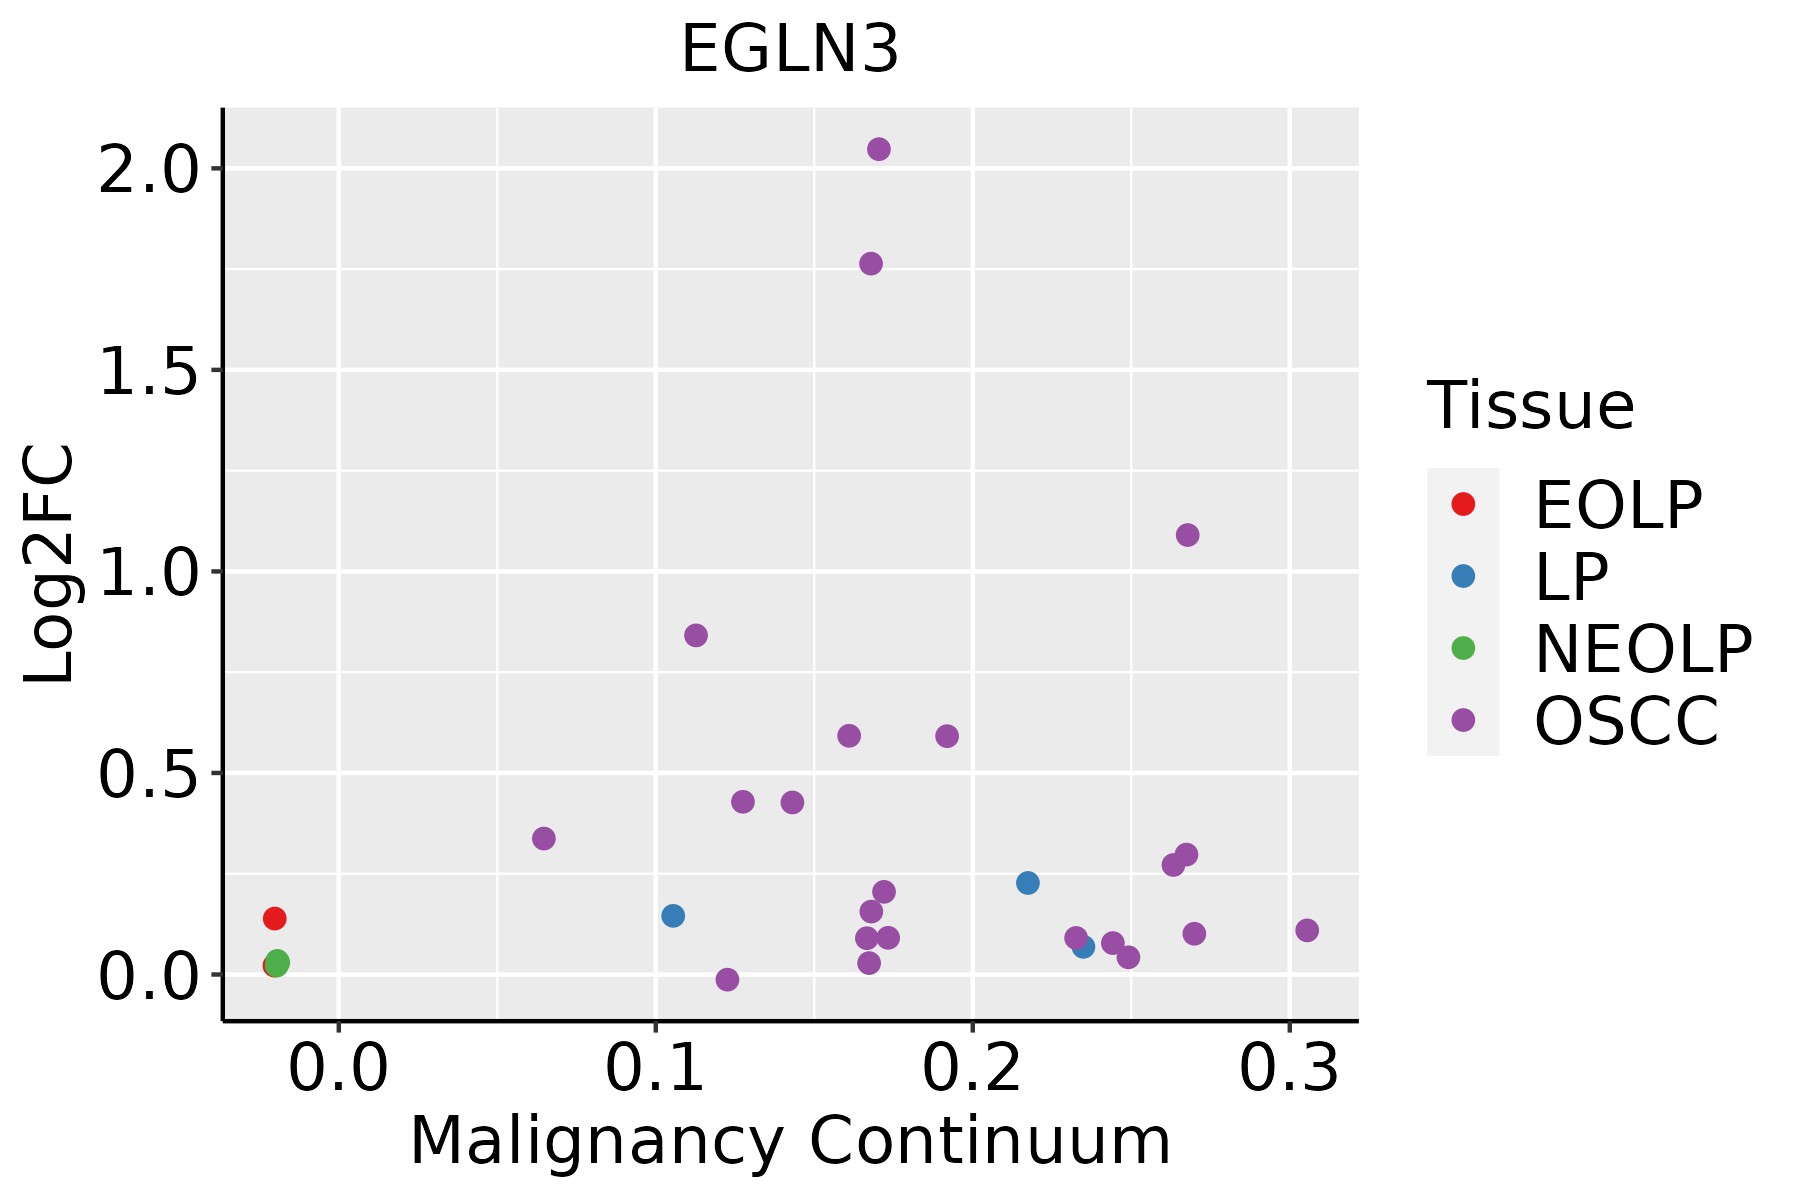 | EOLP: Erosive Oral lichen planus |
| LP: leukoplakia | ||
| NEOLP: Non-erosive oral lichen planus | ||
| OSCC: Oral squamous cell carcinoma | ||
| Skin |  | AK: Actinic keratosis |
| cSCC: Cutaneous squamous cell carcinoma | ||
| SCCIS:squamous cell carcinoma in situ |
| ∗log2FC in expression of this searched gene in stem-like cells from each diseased tissue sample relative to stem-like cells in normal samples in each tissue plotted against the malignancy continuum. Samples are colored based on if they are from different disease stage. |
Top |
Malignant transformation related pathway analysis |
| Find out the enriched GO biological processes and KEGG pathways involved in transition from healthy to precancer to cancer |
| Tissue | Disease Stage | Enriched GO biological Processes |
| Colorectum | AD |  |
| Colorectum | SER |  |
| Colorectum | MSS |  |
| Colorectum | MSI-H |  |
| Colorectum | FAP |  |
| ∗Top 15 enriched GO BP terms are showed in the bar plot of each disease state in each tissue. Each row represents a significant GO biological process which is colored according to the -log10(p.adjust). |
| Page: 1 2 3 4 5 6 7 8 9 |
| GO ID | Tissue | Disease Stage | Description | Gene Ratio | Bg Ratio | pvalue | p.adjust | Count |
| GO:00525479 | Breast | Precancer | regulation of peptidase activity | 71/1080 | 461/18723 | 2.72e-14 | 6.94e-12 | 71 |
| GO:00525489 | Breast | Precancer | regulation of endopeptidase activity | 67/1080 | 432/18723 | 1.06e-13 | 2.36e-11 | 67 |
| GO:00362939 | Breast | Precancer | response to decreased oxygen levels | 53/1080 | 322/18723 | 4.09e-12 | 6.84e-10 | 53 |
| GO:00016669 | Breast | Precancer | response to hypoxia | 51/1080 | 307/18723 | 7.33e-12 | 1.11e-09 | 51 |
| GO:00704829 | Breast | Precancer | response to oxygen levels | 55/1080 | 347/18723 | 7.47e-12 | 1.11e-09 | 55 |
| GO:20001169 | Breast | Precancer | regulation of cysteine-type endopeptidase activity | 43/1080 | 235/18723 | 1.30e-11 | 1.83e-09 | 43 |
| GO:00432819 | Breast | Precancer | regulation of cysteine-type endopeptidase activity involved in apoptotic process | 40/1080 | 209/18723 | 1.59e-11 | 2.07e-09 | 40 |
| GO:00362948 | Breast | Precancer | cellular response to decreased oxygen levels | 31/1080 | 161/18723 | 2.61e-09 | 2.11e-07 | 31 |
| GO:00714538 | Breast | Precancer | cellular response to oxygen levels | 32/1080 | 177/18723 | 7.32e-09 | 5.52e-07 | 32 |
| GO:00709979 | Breast | Precancer | neuron death | 50/1080 | 361/18723 | 7.75e-09 | 5.70e-07 | 50 |
| GO:00458629 | Breast | Precancer | positive regulation of proteolysis | 51/1080 | 372/18723 | 7.77e-09 | 5.70e-07 | 51 |
| GO:00714565 | Breast | Precancer | cellular response to hypoxia | 29/1080 | 151/18723 | 8.98e-09 | 6.50e-07 | 29 |
| GO:00514029 | Breast | Precancer | neuron apoptotic process | 38/1080 | 246/18723 | 2.68e-08 | 1.75e-06 | 38 |
| GO:00109529 | Breast | Precancer | positive regulation of peptidase activity | 33/1080 | 197/18723 | 3.01e-08 | 1.89e-06 | 33 |
| GO:00432808 | Breast | Precancer | positive regulation of cysteine-type endopeptidase activity involved in apoptotic process | 24/1080 | 129/18723 | 3.13e-07 | 1.50e-05 | 24 |
| GO:00109509 | Breast | Precancer | positive regulation of endopeptidase activity | 29/1080 | 179/18723 | 4.23e-07 | 1.90e-05 | 29 |
| GO:20010568 | Breast | Precancer | positive regulation of cysteine-type endopeptidase activity | 25/1080 | 148/18723 | 1.19e-06 | 4.60e-05 | 25 |
| GO:19012149 | Breast | Precancer | regulation of neuron death | 41/1080 | 319/18723 | 1.27e-06 | 4.80e-05 | 41 |
| GO:00435237 | Breast | Precancer | regulation of neuron apoptotic process | 31/1080 | 212/18723 | 1.69e-06 | 6.08e-05 | 31 |
| GO:0018401 | Breast | Precancer | peptidyl-proline hydroxylation to 4-hydroxy-L-proline | 5/1080 | 10/18723 | 1.25e-04 | 2.21e-03 | 5 |
| Page: 1 2 3 4 5 6 7 8 9 10 |
| Pathway ID | Tissue | Disease Stage | Description | Gene Ratio | Bg Ratio | pvalue | p.adjust | qvalue | Count |
| hsa0406616 | Breast | Precancer | HIF-1 signaling pathway | 23/684 | 109/8465 | 1.51e-05 | 1.59e-04 | 1.22e-04 | 23 |
| hsa0406617 | Breast | Precancer | HIF-1 signaling pathway | 23/684 | 109/8465 | 1.51e-05 | 1.59e-04 | 1.22e-04 | 23 |
| hsa0406623 | Breast | IDC | HIF-1 signaling pathway | 22/867 | 109/8465 | 1.36e-03 | 1.00e-02 | 7.50e-03 | 22 |
| hsa052118 | Breast | IDC | Renal cell carcinoma | 14/867 | 69/8465 | 9.16e-03 | 4.37e-02 | 3.27e-02 | 14 |
| hsa0406633 | Breast | IDC | HIF-1 signaling pathway | 22/867 | 109/8465 | 1.36e-03 | 1.00e-02 | 7.50e-03 | 22 |
| hsa0521113 | Breast | IDC | Renal cell carcinoma | 14/867 | 69/8465 | 9.16e-03 | 4.37e-02 | 3.27e-02 | 14 |
| hsa0406642 | Breast | DCIS | HIF-1 signaling pathway | 22/846 | 109/8465 | 9.83e-04 | 7.05e-03 | 5.20e-03 | 22 |
| hsa0521123 | Breast | DCIS | Renal cell carcinoma | 14/846 | 69/8465 | 7.42e-03 | 3.48e-02 | 2.56e-02 | 14 |
| hsa0406652 | Breast | DCIS | HIF-1 signaling pathway | 22/846 | 109/8465 | 9.83e-04 | 7.05e-03 | 5.20e-03 | 22 |
| hsa0521133 | Breast | DCIS | Renal cell carcinoma | 14/846 | 69/8465 | 7.42e-03 | 3.48e-02 | 2.56e-02 | 14 |
| hsa052119 | Cervix | CC | Renal cell carcinoma | 20/1267 | 69/8465 | 2.07e-03 | 8.17e-03 | 4.83e-03 | 20 |
| hsa0406618 | Cervix | CC | HIF-1 signaling pathway | 27/1267 | 109/8465 | 4.72e-03 | 1.64e-02 | 9.72e-03 | 27 |
| hsa0521114 | Cervix | CC | Renal cell carcinoma | 20/1267 | 69/8465 | 2.07e-03 | 8.17e-03 | 4.83e-03 | 20 |
| hsa0406619 | Cervix | CC | HIF-1 signaling pathway | 27/1267 | 109/8465 | 4.72e-03 | 1.64e-02 | 9.72e-03 | 27 |
| hsa0521118 | Esophagus | ESCC | Renal cell carcinoma | 51/4205 | 69/8465 | 3.29e-05 | 1.53e-04 | 7.83e-05 | 51 |
| hsa0406629 | Esophagus | ESCC | HIF-1 signaling pathway | 75/4205 | 109/8465 | 3.66e-05 | 1.68e-04 | 8.60e-05 | 75 |
| hsa0521119 | Esophagus | ESCC | Renal cell carcinoma | 51/4205 | 69/8465 | 3.29e-05 | 1.53e-04 | 7.83e-05 | 51 |
| hsa04066113 | Esophagus | ESCC | HIF-1 signaling pathway | 75/4205 | 109/8465 | 3.66e-05 | 1.68e-04 | 8.60e-05 | 75 |
| hsa0406614 | Lung | IAC | HIF-1 signaling pathway | 22/1053 | 109/8465 | 1.40e-02 | 4.84e-02 | 3.21e-02 | 22 |
| hsa0406615 | Lung | IAC | HIF-1 signaling pathway | 22/1053 | 109/8465 | 1.40e-02 | 4.84e-02 | 3.21e-02 | 22 |
| Page: 1 2 |
Top |
Cell-cell communication analysis |
| Identification of potential cell-cell interactions between two cell types and their ligand-receptor pairs for different disease states |
| Ligand | Receptor | LRpair | Pathway | Tissue | Disease Stage |
| Page: 1 |
Top |
Single-cell gene regulatory network inference analysis |
| Find out the significant the regulons (TFs) and the target genes of each regulon across cell types for different disease states |
| TF | Cell Type | Tissue | Disease Stage | Target Gene | RSS | Regulon Activity |
| ∗The dot plots of a searched regulon are shown for all cell subpopulations in each disease state of each tissue based on the regulon specific score inferred using pySCENIC and by calculating the average expression. |
| Page: 1 |
Top |
Somatic mutation of malignant transformation related genes |
| Annotation of somatic variants for genes involved in malignant transformation |
| Hugo Symbol | Variant Class | Variant Classification | dbSNP RS | HGVSc | HGVSp | HGVSp Short | SWISSPROT | BIOTYPE | SIFT | PolyPhen | Tumor Sample Barcode | Tissue | Histology | Sex | Age | Stage | Therapy Types | Drugs | Outcome |
| EGLN3 | SNV | Missense_Mutation | c.406N>A | p.Val136Met | p.V136M | Q9H6Z9 | protein_coding | deleterious(0) | probably_damaging(0.99) | TCGA-EA-A5ZD-01 | Cervix | cervical & endocervical cancer | Female | <65 | I/II | Unknown | Unknown | SD | |
| EGLN3 | SNV | Missense_Mutation | rs375310922 | c.607G>A | p.Ala203Thr | p.A203T | Q9H6Z9 | protein_coding | tolerated(0.09) | benign(0.065) | TCGA-A6-4105-01 | Colorectum | colon adenocarcinoma | Male | >=65 | I/II | Unknown | Unknown | PD |
| EGLN3 | SNV | Missense_Mutation | novel | c.649N>A | p.Glu217Lys | p.E217K | Q9H6Z9 | protein_coding | deleterious(0.02) | probably_damaging(0.999) | TCGA-AA-3984-01 | Colorectum | colon adenocarcinoma | Female | <65 | I/II | Unknown | Unknown | SD |
| EGLN3 | SNV | Missense_Mutation | c.380N>A | p.Gly127Glu | p.G127E | Q9H6Z9 | protein_coding | deleterious(0) | probably_damaging(0.996) | TCGA-AA-A010-01 | Colorectum | colon adenocarcinoma | Female | <65 | I/II | Chemotherapy | folinic | CR | |
| EGLN3 | SNV | Missense_Mutation | c.293N>C | p.Ile98Thr | p.I98T | Q9H6Z9 | protein_coding | deleterious(0) | benign(0.059) | TCGA-WS-AB45-01 | Colorectum | colon adenocarcinoma | Female | <65 | I/II | Unknown | Unknown | SD | |
| EGLN3 | SNV | Missense_Mutation | novel | c.425A>G | p.Asp142Gly | p.D142G | Q9H6Z9 | protein_coding | deleterious(0) | probably_damaging(0.998) | TCGA-A5-A0G2-01 | Endometrium | uterine corpus endometrioid carcinoma | Female | <65 | III/IV | Unknown | Unknown | SD |
| EGLN3 | SNV | Missense_Mutation | novel | c.84C>A | p.Phe28Leu | p.F28L | Q9H6Z9 | protein_coding | tolerated(0.17) | benign(0.007) | TCGA-A5-A0G2-01 | Endometrium | uterine corpus endometrioid carcinoma | Female | <65 | III/IV | Unknown | Unknown | SD |
| EGLN3 | SNV | Missense_Mutation | novel | c.397G>A | p.Val133Ile | p.V133I | Q9H6Z9 | protein_coding | tolerated(0.09) | benign(0.12) | TCGA-AP-A1DK-01 | Endometrium | uterine corpus endometrioid carcinoma | Female | <65 | I/II | Unknown | Unknown | SD |
| EGLN3 | SNV | Missense_Mutation | c.669N>T | p.Lys223Asn | p.K223N | Q9H6Z9 | protein_coding | tolerated(0.33) | benign(0.005) | TCGA-AX-A0J0-01 | Endometrium | uterine corpus endometrioid carcinoma | Female | <65 | I/II | Unknown | Unknown | SD | |
| EGLN3 | SNV | Missense_Mutation | c.589G>A | p.Glu197Lys | p.E197K | Q9H6Z9 | protein_coding | deleterious(0) | probably_damaging(0.987) | TCGA-B5-A0JY-01 | Endometrium | uterine corpus endometrioid carcinoma | Female | <65 | III/IV | Chemotherapy | doxorubicin | SD |
| Page: 1 2 3 4 |
Top |
Related drugs of malignant transformation related genes |
| Identification of chemicals and drugs interact with genes involved in malignant transfromation |
| (DGIdb 4.0) |
| Entrez ID | Symbol | Category | Interaction Types | Drug Claim Name | Drug Name | PMIDs |
| 112399 | EGLN3 | DRUGGABLE GENOME, ENZYME | inhibitor | 252827454 | ||
| 112399 | EGLN3 | DRUGGABLE GENOME, ENZYME | inhibitor | CHEMBL3544988 | DAPRODUSTAT | |
| 112399 | EGLN3 | DRUGGABLE GENOME, ENZYME | inhibitor | 252166666 | ||
| 112399 | EGLN3 | DRUGGABLE GENOME, ENZYME | FG-4592 | ROXADUSTAT | ||
| 112399 | EGLN3 | DRUGGABLE GENOME, ENZYME | FG-2216 | |||
| 112399 | EGLN3 | DRUGGABLE GENOME, ENZYME | inhibitor | CHEMBL2338329 | ROXADUSTAT |
| Page: 1 |

Copyright 2023-Present -The University of Texas Health Science Center at Houston |