
|
|||||
|
 | |
| |
| |
| |
| |
| |
|
Gene: EGLN2 |
Gene summary for EGLN2 |
| Gene information | Species | Human | Gene symbol | EGLN2 | Gene ID | 112398 |
| Gene name | egl-9 family hypoxia inducible factor 2 | |
| Gene Alias | EIT-6 | |
| Cytomap | 19q13.2 | |
| Gene Type | protein-coding | GO ID | GO:0001558 | UniProtAcc | A0A024R0R2 |
Top |
Malignant transformation analysis |
| Identification of the aberrant gene expression in precancerous and cancerous lesions by comparing the gene expression of stem-like cells in diseased tissues with normal stem cells |
| Entrez ID | Symbol | Replicates | Species | Organ | Tissue | Adj P-value | Log2FC | Malignancy |
| 112398 | EGLN2 | LZE4T | Human | Esophagus | ESCC | 7.06e-09 | 1.98e-01 | 0.0811 |
| 112398 | EGLN2 | LZE5T | Human | Esophagus | ESCC | 4.16e-04 | 5.03e-01 | 0.0514 |
| 112398 | EGLN2 | LZE7T | Human | Esophagus | ESCC | 5.04e-09 | 6.17e-01 | 0.0667 |
| 112398 | EGLN2 | LZE8T | Human | Esophagus | ESCC | 2.04e-08 | 3.52e-01 | 0.067 |
| 112398 | EGLN2 | LZE20T | Human | Esophagus | ESCC | 2.26e-08 | 2.40e-01 | 0.0662 |
| 112398 | EGLN2 | LZE22D1 | Human | Esophagus | HGIN | 1.51e-02 | 1.74e-01 | 0.0595 |
| 112398 | EGLN2 | LZE22T | Human | Esophagus | ESCC | 3.75e-10 | 6.76e-01 | 0.068 |
| 112398 | EGLN2 | LZE24T | Human | Esophagus | ESCC | 4.39e-29 | 8.41e-01 | 0.0596 |
| 112398 | EGLN2 | LZE21T | Human | Esophagus | ESCC | 1.36e-02 | 2.84e-01 | 0.0655 |
| 112398 | EGLN2 | LZE6T | Human | Esophagus | ESCC | 1.55e-08 | 2.29e-01 | 0.0845 |
| 112398 | EGLN2 | P1T-E | Human | Esophagus | ESCC | 5.15e-11 | 3.82e-01 | 0.0875 |
| 112398 | EGLN2 | P2T-E | Human | Esophagus | ESCC | 3.89e-19 | 2.54e-01 | 0.1177 |
| 112398 | EGLN2 | P4T-E | Human | Esophagus | ESCC | 2.63e-17 | 4.26e-01 | 0.1323 |
| 112398 | EGLN2 | P5T-E | Human | Esophagus | ESCC | 1.07e-16 | 1.18e-01 | 0.1327 |
| 112398 | EGLN2 | P8T-E | Human | Esophagus | ESCC | 7.87e-52 | 1.11e+00 | 0.0889 |
| 112398 | EGLN2 | P9T-E | Human | Esophagus | ESCC | 3.88e-14 | 3.26e-01 | 0.1131 |
| 112398 | EGLN2 | P10T-E | Human | Esophagus | ESCC | 1.39e-24 | 4.67e-01 | 0.116 |
| 112398 | EGLN2 | P11T-E | Human | Esophagus | ESCC | 1.48e-11 | 4.45e-01 | 0.1426 |
| 112398 | EGLN2 | P12T-E | Human | Esophagus | ESCC | 7.11e-33 | 8.00e-01 | 0.1122 |
| 112398 | EGLN2 | P15T-E | Human | Esophagus | ESCC | 2.69e-18 | 4.58e-01 | 0.1149 |
| Page: 1 2 3 4 5 |
| Tissue | Expression Dynamics | Abbreviation |
| Esophagus | 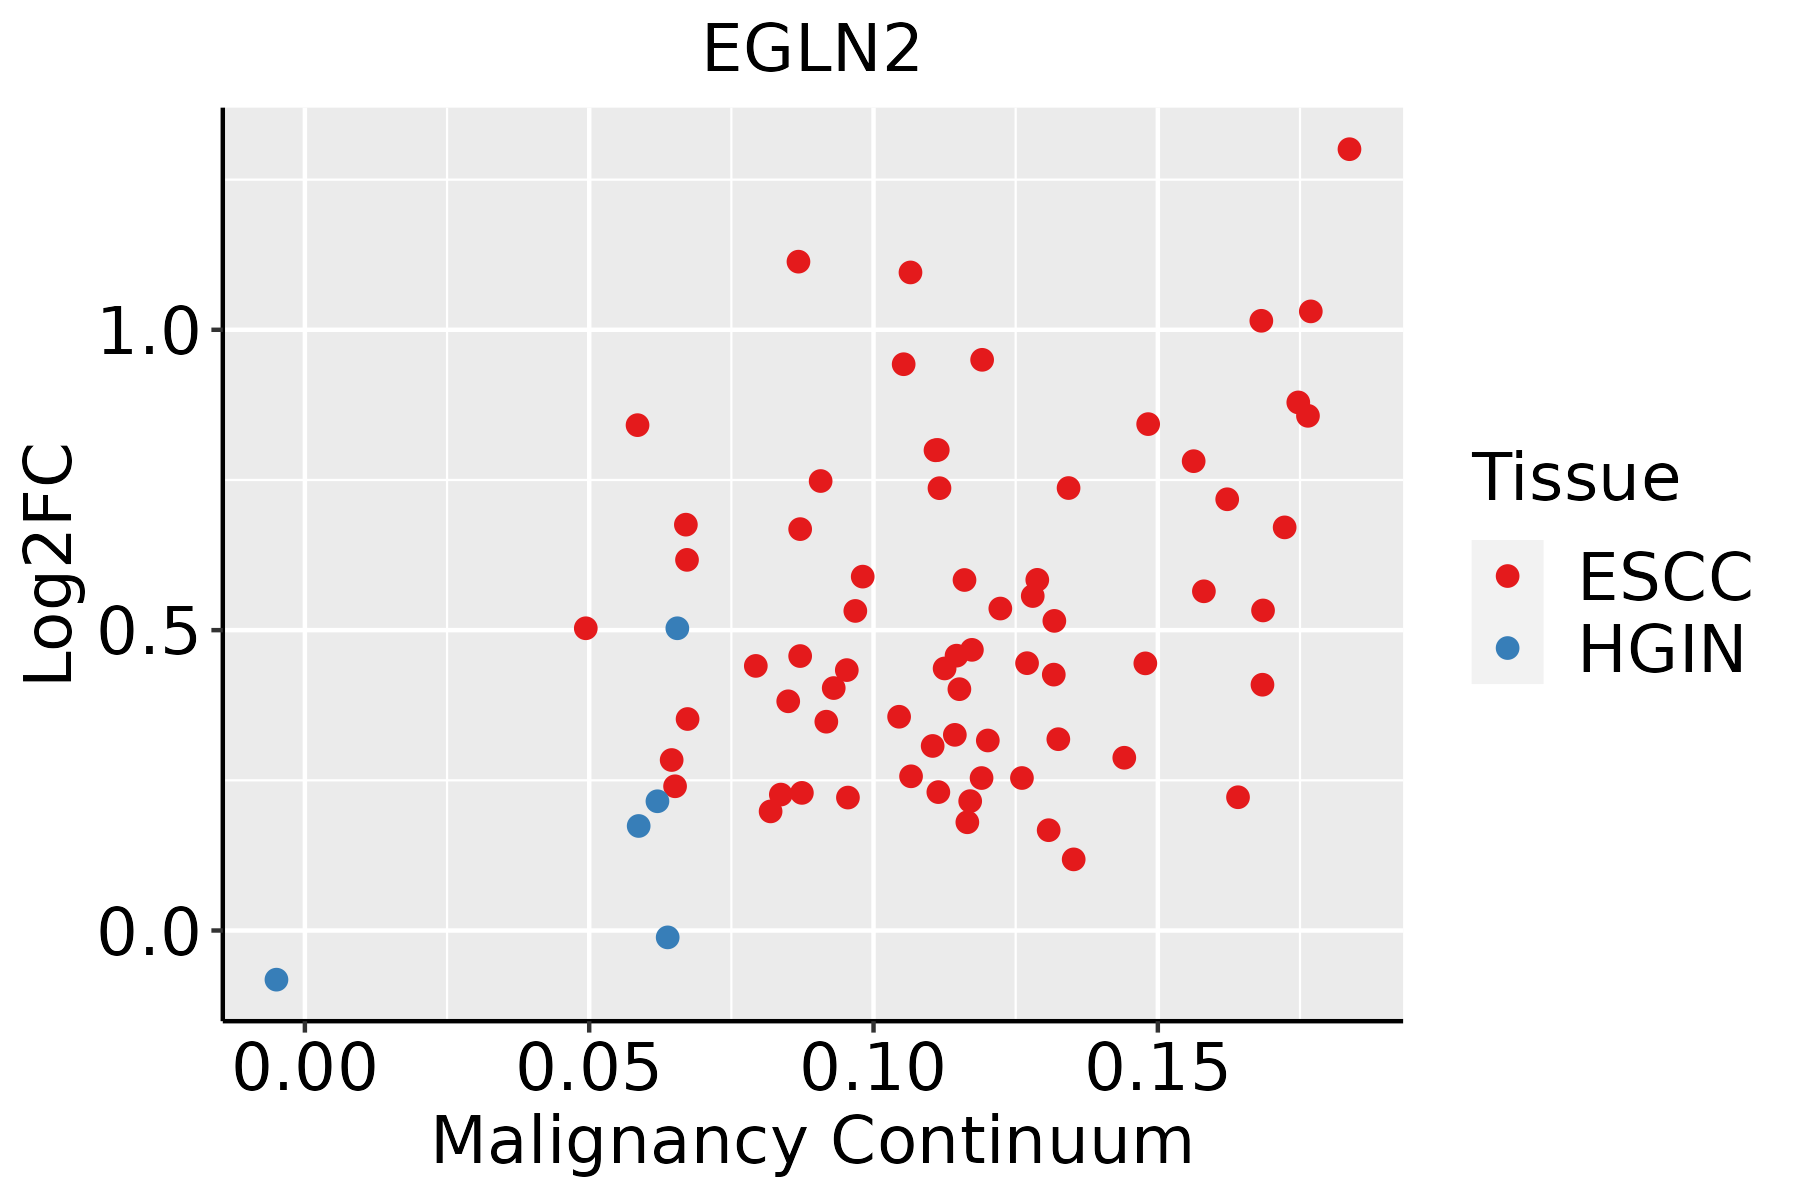 | ESCC: Esophageal squamous cell carcinoma |
| HGIN: High-grade intraepithelial neoplasias | ||
| LGIN: Low-grade intraepithelial neoplasias | ||
| Oral Cavity |  | EOLP: Erosive Oral lichen planus |
| LP: leukoplakia | ||
| NEOLP: Non-erosive oral lichen planus | ||
| OSCC: Oral squamous cell carcinoma | ||
| Skin | 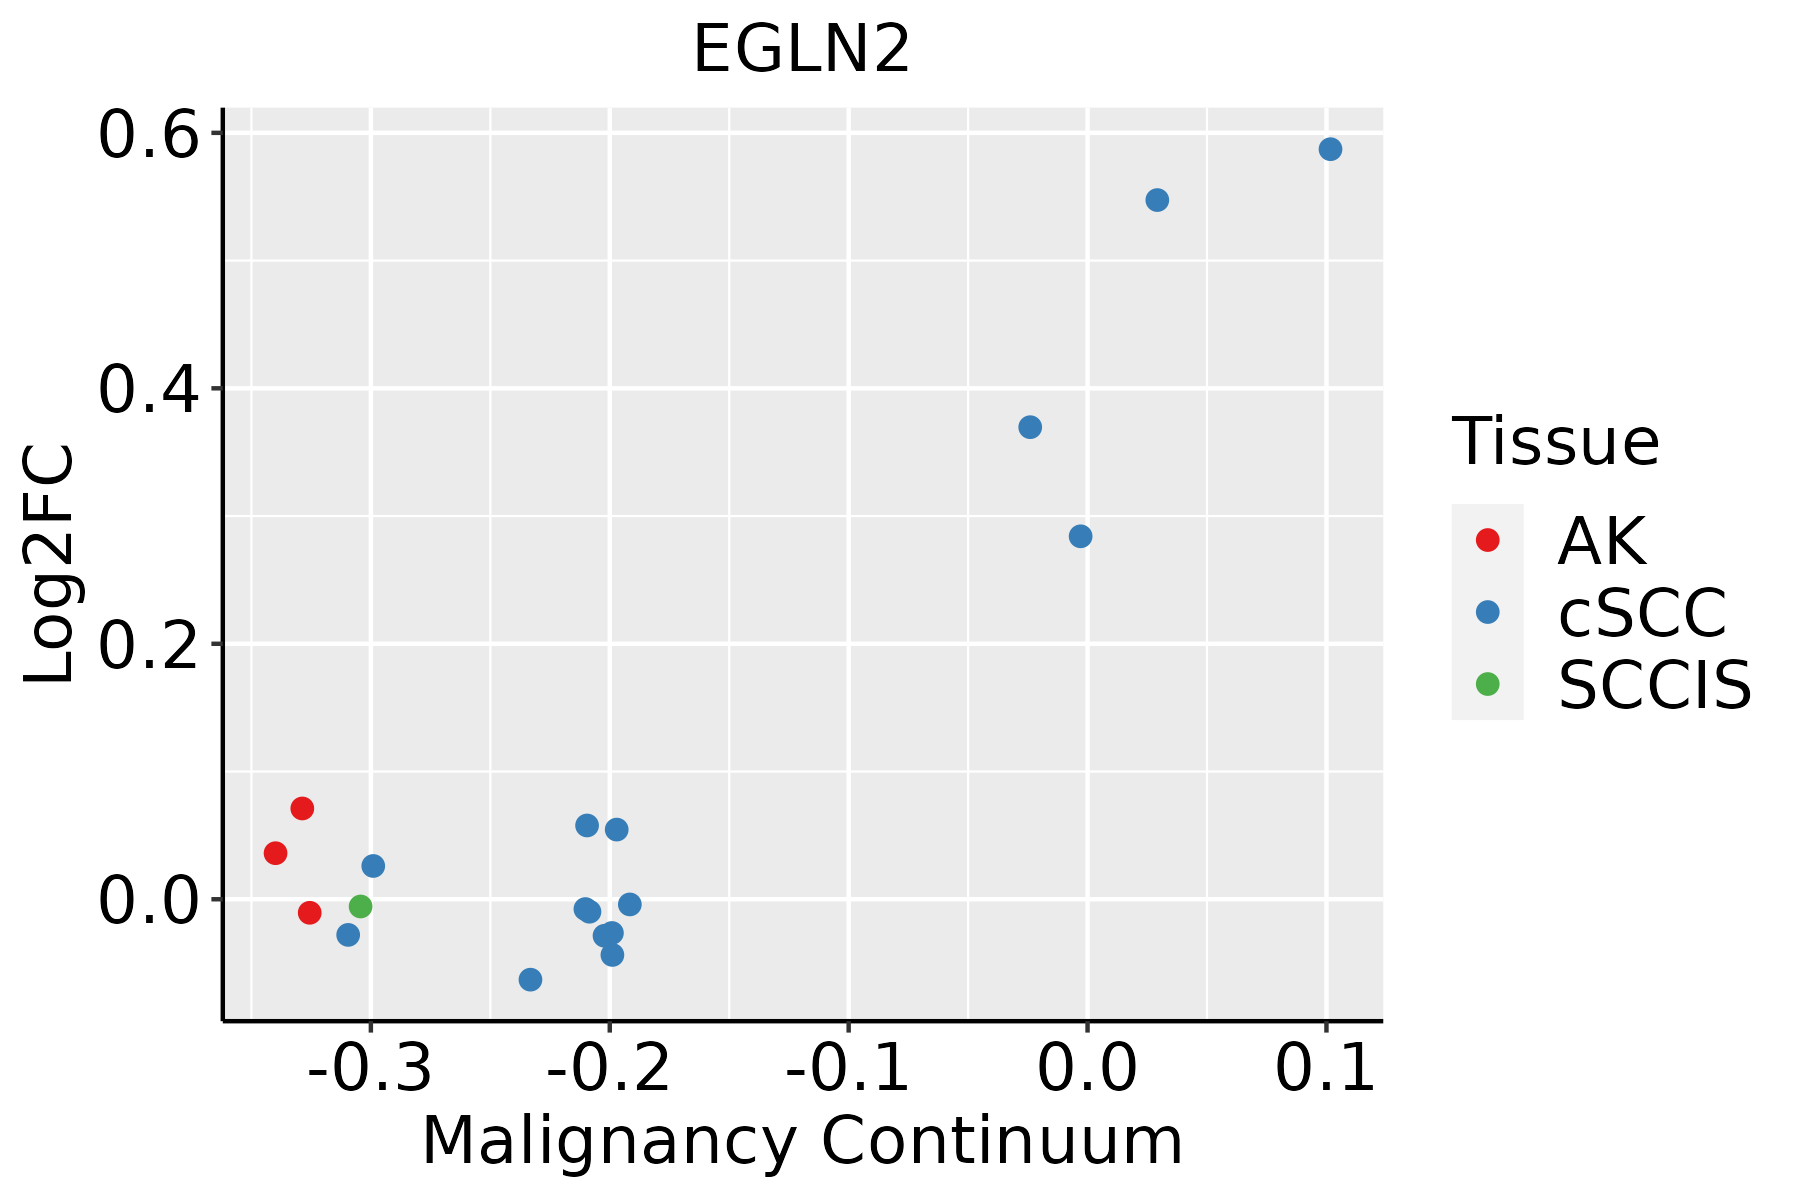 | AK: Actinic keratosis |
| cSCC: Cutaneous squamous cell carcinoma | ||
| SCCIS:squamous cell carcinoma in situ |
| ∗log2FC in expression of this searched gene in stem-like cells from each diseased tissue sample relative to stem-like cells in normal samples in each tissue plotted against the malignancy continuum. Samples are colored based on if they are from different disease stage. |
Top |
Malignant transformation related pathway analysis |
| Find out the enriched GO biological processes and KEGG pathways involved in transition from healthy to precancer to cancer |
| Tissue | Disease Stage | Enriched GO biological Processes |
| Colorectum | AD |  |
| Colorectum | SER |  |
| Colorectum | MSS |  |
| Colorectum | MSI-H |  |
| Colorectum | FAP |  |
| ∗Top 15 enriched GO BP terms are showed in the bar plot of each disease state in each tissue. Each row represents a significant GO biological process which is colored according to the -log10(p.adjust). |
| Page: 1 2 3 4 5 6 7 8 9 |
| GO ID | Tissue | Disease Stage | Description | Gene Ratio | Bg Ratio | pvalue | p.adjust | Count |
| GO:004217627 | Esophagus | HGIN | regulation of protein catabolic process | 119/2587 | 391/18723 | 8.09e-18 | 2.43e-15 | 119 |
| GO:000989626 | Esophagus | HGIN | positive regulation of catabolic process | 126/2587 | 492/18723 | 1.46e-12 | 2.09e-10 | 126 |
| GO:004573227 | Esophagus | HGIN | positive regulation of protein catabolic process | 69/2587 | 231/18723 | 1.66e-10 | 1.64e-08 | 69 |
| GO:007099727 | Esophagus | HGIN | neuron death | 81/2587 | 361/18723 | 5.01e-06 | 1.61e-04 | 81 |
| GO:003052220 | Esophagus | HGIN | intracellular receptor signaling pathway | 62/2587 | 265/18723 | 1.63e-05 | 4.50e-04 | 62 |
| GO:007048220 | Esophagus | HGIN | response to oxygen levels | 76/2587 | 347/18723 | 2.36e-05 | 6.25e-04 | 76 |
| GO:007145319 | Esophagus | HGIN | cellular response to oxygen levels | 44/2587 | 177/18723 | 5.88e-05 | 1.38e-03 | 44 |
| GO:004854527 | Esophagus | HGIN | response to steroid hormone | 73/2587 | 339/18723 | 6.06e-05 | 1.40e-03 | 73 |
| GO:003629320 | Esophagus | HGIN | response to decreased oxygen levels | 70/2587 | 322/18723 | 6.23e-05 | 1.44e-03 | 70 |
| GO:000166620 | Esophagus | HGIN | response to hypoxia | 67/2587 | 307/18723 | 7.82e-05 | 1.75e-03 | 67 |
| GO:003629419 | Esophagus | HGIN | cellular response to decreased oxygen levels | 40/2587 | 161/18723 | 1.26e-04 | 2.57e-03 | 40 |
| GO:190121424 | Esophagus | HGIN | regulation of neuron death | 68/2587 | 319/18723 | 1.46e-04 | 2.91e-03 | 68 |
| GO:007145610 | Esophagus | HGIN | cellular response to hypoxia | 37/2587 | 151/18723 | 2.98e-04 | 5.07e-03 | 37 |
| GO:001604919 | Esophagus | HGIN | cell growth | 93/2587 | 482/18723 | 4.49e-04 | 6.62e-03 | 93 |
| GO:003051818 | Esophagus | HGIN | intracellular steroid hormone receptor signaling pathway | 29/2587 | 116/18723 | 9.06e-04 | 1.15e-02 | 29 |
| GO:005140219 | Esophagus | HGIN | neuron apoptotic process | 52/2587 | 246/18723 | 1.01e-03 | 1.26e-02 | 52 |
| GO:007138320 | Esophagus | HGIN | cellular response to steroid hormone stimulus | 44/2587 | 204/18723 | 1.56e-03 | 1.79e-02 | 44 |
| GO:00182089 | Esophagus | HGIN | peptidyl-proline modification | 17/2587 | 58/18723 | 1.64e-03 | 1.82e-02 | 17 |
| GO:00305207 | Esophagus | HGIN | intracellular estrogen receptor signaling pathway | 16/2587 | 54/18723 | 1.97e-03 | 2.08e-02 | 16 |
| GO:004340118 | Esophagus | HGIN | steroid hormone mediated signaling pathway | 31/2587 | 136/18723 | 3.01e-03 | 2.88e-02 | 31 |
| Page: 1 2 3 4 5 6 7 |
| Pathway ID | Tissue | Disease Stage | Description | Gene Ratio | Bg Ratio | pvalue | p.adjust | qvalue | Count |
| hsa0521118 | Esophagus | ESCC | Renal cell carcinoma | 51/4205 | 69/8465 | 3.29e-05 | 1.53e-04 | 7.83e-05 | 51 |
| hsa0406629 | Esophagus | ESCC | HIF-1 signaling pathway | 75/4205 | 109/8465 | 3.66e-05 | 1.68e-04 | 8.60e-05 | 75 |
| hsa0521119 | Esophagus | ESCC | Renal cell carcinoma | 51/4205 | 69/8465 | 3.29e-05 | 1.53e-04 | 7.83e-05 | 51 |
| hsa04066113 | Esophagus | ESCC | HIF-1 signaling pathway | 75/4205 | 109/8465 | 3.66e-05 | 1.68e-04 | 8.60e-05 | 75 |
| hsa0521116 | Oral cavity | OSCC | Renal cell carcinoma | 51/3704 | 69/8465 | 3.30e-07 | 2.05e-06 | 1.04e-06 | 51 |
| hsa0406627 | Oral cavity | OSCC | HIF-1 signaling pathway | 68/3704 | 109/8465 | 6.30e-05 | 2.48e-04 | 1.26e-04 | 68 |
| hsa0521117 | Oral cavity | OSCC | Renal cell carcinoma | 51/3704 | 69/8465 | 3.30e-07 | 2.05e-06 | 1.04e-06 | 51 |
| hsa04066112 | Oral cavity | OSCC | HIF-1 signaling pathway | 68/3704 | 109/8465 | 6.30e-05 | 2.48e-04 | 1.26e-04 | 68 |
| hsa0521125 | Oral cavity | LP | Renal cell carcinoma | 30/2418 | 69/8465 | 5.60e-03 | 2.25e-02 | 1.45e-02 | 30 |
| hsa0406628 | Oral cavity | LP | HIF-1 signaling pathway | 42/2418 | 109/8465 | 1.52e-02 | 4.75e-02 | 3.06e-02 | 42 |
| hsa0521135 | Oral cavity | LP | Renal cell carcinoma | 30/2418 | 69/8465 | 5.60e-03 | 2.25e-02 | 1.45e-02 | 30 |
| hsa0406636 | Oral cavity | LP | HIF-1 signaling pathway | 42/2418 | 109/8465 | 1.52e-02 | 4.75e-02 | 3.06e-02 | 42 |
| Page: 1 |
Top |
Cell-cell communication analysis |
| Identification of potential cell-cell interactions between two cell types and their ligand-receptor pairs for different disease states |
| Ligand | Receptor | LRpair | Pathway | Tissue | Disease Stage |
| Page: 1 |
Top |
Single-cell gene regulatory network inference analysis |
| Find out the significant the regulons (TFs) and the target genes of each regulon across cell types for different disease states |
| TF | Cell Type | Tissue | Disease Stage | Target Gene | RSS | Regulon Activity |
| ∗The dot plots of a searched regulon are shown for all cell subpopulations in each disease state of each tissue based on the regulon specific score inferred using pySCENIC and by calculating the average expression. |
| Page: 1 |
Top |
Somatic mutation of malignant transformation related genes |
| Annotation of somatic variants for genes involved in malignant transformation |
| Hugo Symbol | Variant Class | Variant Classification | dbSNP RS | HGVSc | HGVSp | HGVSp Short | SWISSPROT | BIOTYPE | SIFT | PolyPhen | Tumor Sample Barcode | Tissue | Histology | Sex | Age | Stage | Therapy Types | Drugs | Outcome |
| EGLN2 | insertion | Frame_Shift_Ins | novel | c.1160_1161insCCCCTGCTGTACACATCAGGCAGTTGAGGCCCAT | p.Gln388ProfsTer44 | p.Q388Pfs*44 | Q96KS0 | protein_coding | TCGA-AN-A0FS-01 | Breast | breast invasive carcinoma | Female | <65 | I/II | Unknown | Unknown | SD | ||
| EGLN2 | SNV | Missense_Mutation | rs756541267 | c.653N>A | p.Arg218His | p.R218H | Q96KS0 | protein_coding | tolerated(0.12) | possibly_damaging(0.835) | TCGA-2W-A8YY-01 | Cervix | cervical & endocervical cancer | Female | <65 | I/II | Chemotherapy | cisplatin | CR |
| EGLN2 | SNV | Missense_Mutation | c.577N>A | p.Val193Ile | p.V193I | Q96KS0 | protein_coding | tolerated(0.09) | benign(0.084) | TCGA-A6-6653-01 | Colorectum | colon adenocarcinoma | Male | >=65 | I/II | Unknown | Unknown | SD | |
| EGLN2 | SNV | Missense_Mutation | rs763273304 | c.854C>T | p.Ala285Val | p.A285V | Q96KS0 | protein_coding | deleterious(0) | probably_damaging(0.995) | TCGA-AA-3947-01 | Colorectum | colon adenocarcinoma | Female | <65 | I/II | Unknown | Unknown | SD |
| EGLN2 | SNV | Missense_Mutation | c.481N>A | p.Ala161Thr | p.A161T | Q96KS0 | protein_coding | deleterious_low_confidence(0.02) | benign(0) | TCGA-CK-4951-01 | Colorectum | colon adenocarcinoma | Female | >=65 | I/II | Unknown | Unknown | PD | |
| EGLN2 | SNV | Missense_Mutation | c.1199N>C | p.Val400Ala | p.V400A | Q96KS0 | protein_coding | deleterious_low_confidence(0.03) | benign(0.21) | TCGA-D5-6928-01 | Colorectum | colon adenocarcinoma | Male | >=65 | I/II | Unknown | Unknown | SD | |
| EGLN2 | SNV | Missense_Mutation | c.929N>A | p.Cys310Tyr | p.C310Y | Q96KS0 | protein_coding | deleterious(0) | probably_damaging(0.985) | TCGA-AP-A059-01 | Endometrium | uterine corpus endometrioid carcinoma | Female | >=65 | I/II | Unknown | Unknown | SD | |
| EGLN2 | SNV | Missense_Mutation | c.907G>A | p.Gly303Ser | p.G303S | Q96KS0 | protein_coding | deleterious(0.04) | possibly_damaging(0.566) | TCGA-B5-A0JR-01 | Endometrium | uterine corpus endometrioid carcinoma | Female | >=65 | I/II | Unknown | Unknown | SD | |
| EGLN2 | SNV | Missense_Mutation | novel | c.598N>A | p.Ala200Thr | p.A200T | Q96KS0 | protein_coding | tolerated(0.24) | benign(0.053) | TCGA-B5-A1MR-01 | Endometrium | uterine corpus endometrioid carcinoma | Female | >=65 | III/IV | Unknown | Unknown | SD |
| EGLN2 | SNV | Missense_Mutation | novel | c.202G>A | p.Ala68Thr | p.A68T | Q96KS0 | protein_coding | deleterious_low_confidence(0) | benign(0) | TCGA-B5-A3FC-01 | Endometrium | uterine corpus endometrioid carcinoma | Female | <65 | I/II | Unknown | Unknown | SD |
| Page: 1 2 3 4 |
Top |
Related drugs of malignant transformation related genes |
| Identification of chemicals and drugs interact with genes involved in malignant transfromation |
| (DGIdb 4.0) |
| Entrez ID | Symbol | Category | Interaction Types | Drug Claim Name | Drug Name | PMIDs |
| 112398 | EGLN2 | ENZYME, DRUGGABLE GENOME | BAY-85-3934 | |||
| 112398 | EGLN2 | ENZYME, DRUGGABLE GENOME | GSK1278863 | DAPRODUSTAT | ||
| 112398 | EGLN2 | ENZYME, DRUGGABLE GENOME | inhibitor | CHEMBL2338329 | ROXADUSTAT | |
| 112398 | EGLN2 | ENZYME, DRUGGABLE GENOME | FG-4592 | ROXADUSTAT | ||
| 112398 | EGLN2 | ENZYME, DRUGGABLE GENOME | FG-4592 | ROXADUSTAT | ||
| 112398 | EGLN2 | ENZYME, DRUGGABLE GENOME | FG-2216 | |||
| 112398 | EGLN2 | ENZYME, DRUGGABLE GENOME | inhibitor | CHEMBL3544988 | DAPRODUSTAT | |
| 112398 | EGLN2 | ENZYME, DRUGGABLE GENOME | inhibitor | 252827454 | ||
| 112398 | EGLN2 | ENZYME, DRUGGABLE GENOME | AKB-6548 | VADADUSTAT |
| Page: 1 |

Copyright 2023-Present -The University of Texas Health Science Center at Houston |