
|
|||||
|
 | |
| |
| |
| |
| |
| |
|
Gene: EGLN1 |
Gene summary for EGLN1 |
| Gene information | Species | Human | Gene symbol | EGLN1 | Gene ID | 54583 |
| Gene name | egl-9 family hypoxia inducible factor 1 | |
| Gene Alias | C1orf12 | |
| Cytomap | 1q42.2 | |
| Gene Type | protein-coding | GO ID | GO:0001525 | UniProtAcc | Q9GZT9 |
Top |
Malignant transformation analysis |
| Identification of the aberrant gene expression in precancerous and cancerous lesions by comparing the gene expression of stem-like cells in diseased tissues with normal stem cells |
| Entrez ID | Symbol | Replicates | Species | Organ | Tissue | Adj P-value | Log2FC | Malignancy |
| 54583 | EGLN1 | LZE4T | Human | Esophagus | ESCC | 1.49e-03 | 2.04e-02 | 0.0811 |
| 54583 | EGLN1 | LZE24T | Human | Esophagus | ESCC | 1.97e-04 | 7.73e-02 | 0.0596 |
| 54583 | EGLN1 | P1T-E | Human | Esophagus | ESCC | 4.89e-02 | 3.42e-01 | 0.0875 |
| 54583 | EGLN1 | P2T-E | Human | Esophagus | ESCC | 1.25e-21 | 4.07e-01 | 0.1177 |
| 54583 | EGLN1 | P4T-E | Human | Esophagus | ESCC | 1.84e-13 | 3.60e-01 | 0.1323 |
| 54583 | EGLN1 | P5T-E | Human | Esophagus | ESCC | 2.91e-19 | 3.01e-01 | 0.1327 |
| 54583 | EGLN1 | P8T-E | Human | Esophagus | ESCC | 2.68e-07 | 7.50e-02 | 0.0889 |
| 54583 | EGLN1 | P9T-E | Human | Esophagus | ESCC | 2.49e-09 | 1.87e-01 | 0.1131 |
| 54583 | EGLN1 | P10T-E | Human | Esophagus | ESCC | 8.58e-25 | 5.91e-01 | 0.116 |
| 54583 | EGLN1 | P11T-E | Human | Esophagus | ESCC | 2.09e-06 | 2.14e-01 | 0.1426 |
| 54583 | EGLN1 | P12T-E | Human | Esophagus | ESCC | 8.19e-13 | 2.14e-01 | 0.1122 |
| 54583 | EGLN1 | P15T-E | Human | Esophagus | ESCC | 3.46e-20 | 4.79e-01 | 0.1149 |
| 54583 | EGLN1 | P16T-E | Human | Esophagus | ESCC | 1.70e-14 | 2.84e-01 | 0.1153 |
| 54583 | EGLN1 | P17T-E | Human | Esophagus | ESCC | 6.03e-05 | 1.32e-01 | 0.1278 |
| 54583 | EGLN1 | P19T-E | Human | Esophagus | ESCC | 4.58e-04 | 2.84e-01 | 0.1662 |
| 54583 | EGLN1 | P20T-E | Human | Esophagus | ESCC | 8.33e-10 | 1.81e-01 | 0.1124 |
| 54583 | EGLN1 | P21T-E | Human | Esophagus | ESCC | 9.30e-04 | -1.06e-04 | 0.1617 |
| 54583 | EGLN1 | P22T-E | Human | Esophagus | ESCC | 3.02e-09 | 1.62e-01 | 0.1236 |
| 54583 | EGLN1 | P23T-E | Human | Esophagus | ESCC | 6.16e-19 | 3.64e-01 | 0.108 |
| 54583 | EGLN1 | P24T-E | Human | Esophagus | ESCC | 4.48e-02 | -1.54e-02 | 0.1287 |
| Page: 1 2 3 4 5 |
| Tissue | Expression Dynamics | Abbreviation |
| Esophagus |  | ESCC: Esophageal squamous cell carcinoma |
| HGIN: High-grade intraepithelial neoplasias | ||
| LGIN: Low-grade intraepithelial neoplasias | ||
| Liver | 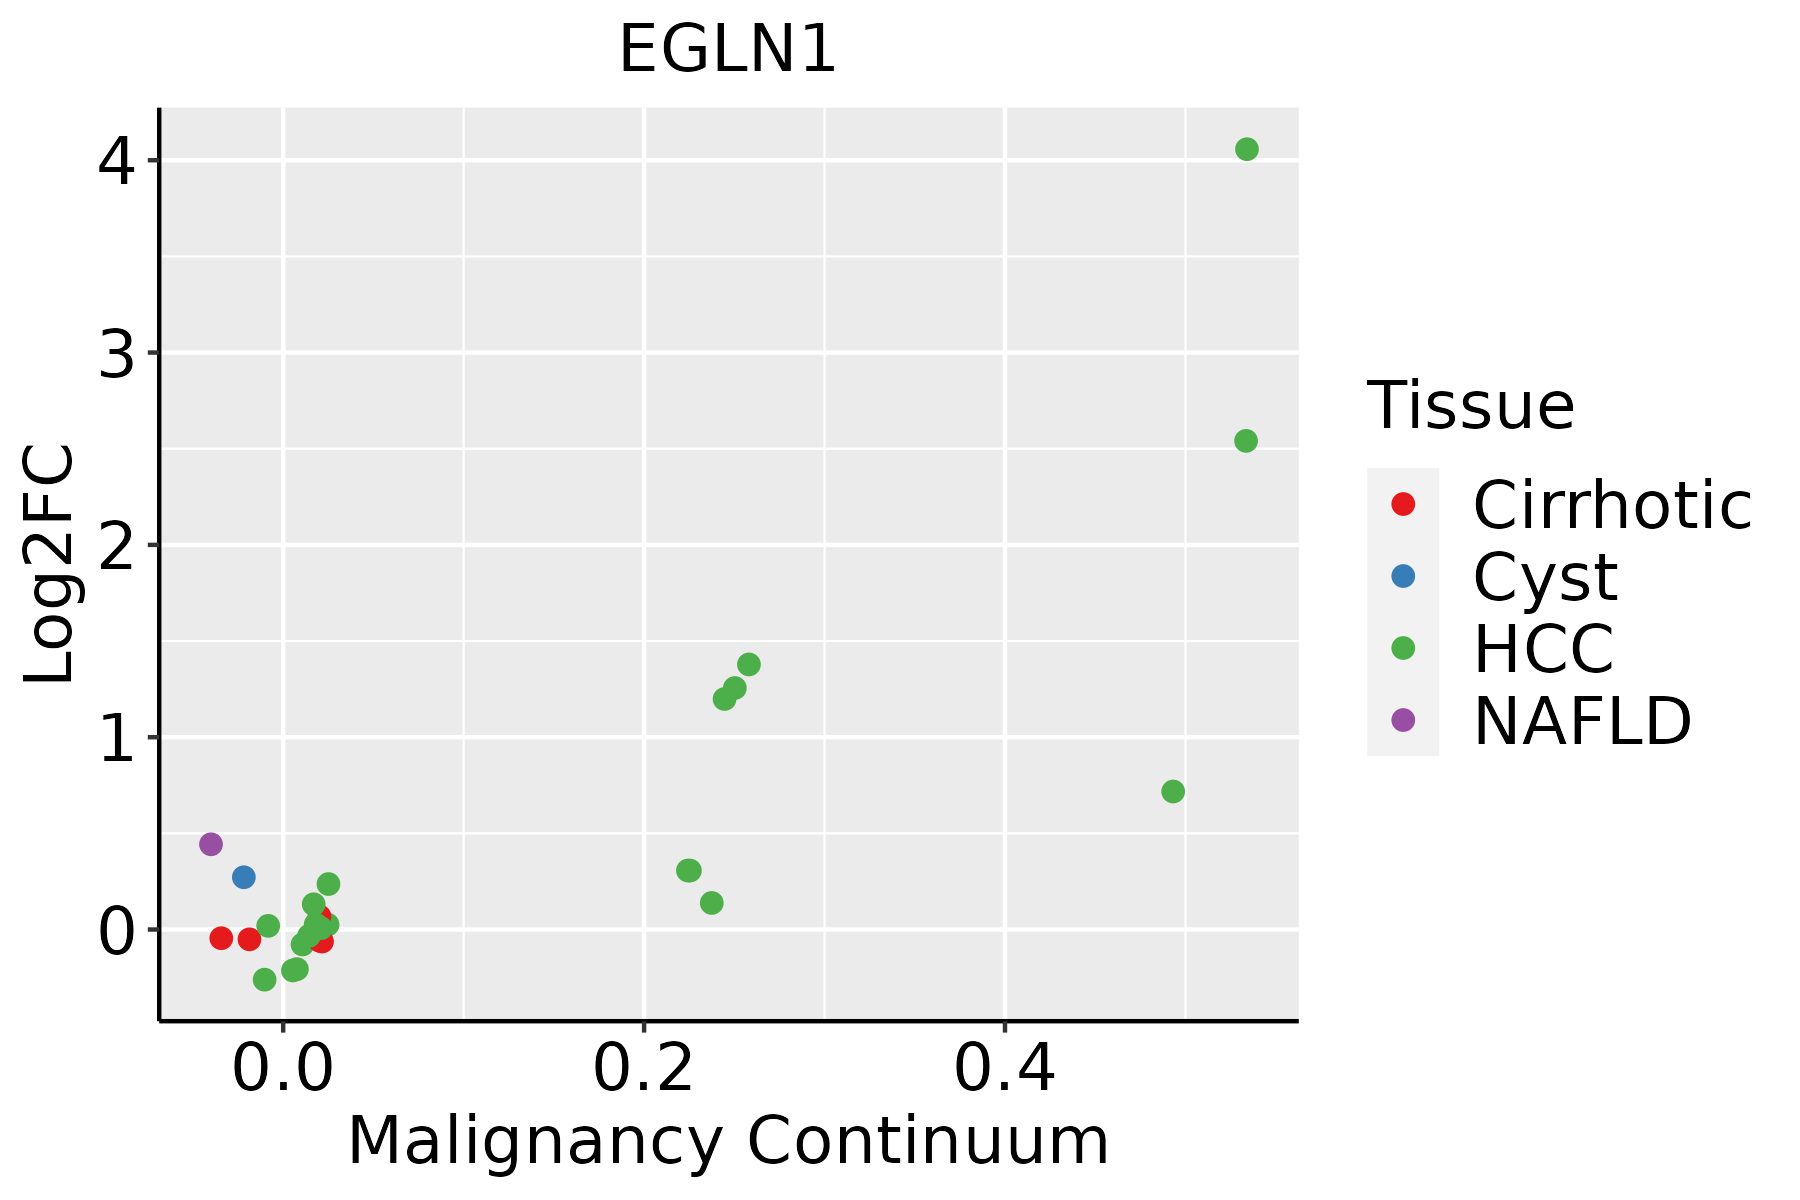 | HCC: Hepatocellular carcinoma |
| NAFLD: Non-alcoholic fatty liver disease | ||
| Oral Cavity |  | EOLP: Erosive Oral lichen planus |
| LP: leukoplakia | ||
| NEOLP: Non-erosive oral lichen planus | ||
| OSCC: Oral squamous cell carcinoma | ||
| Skin | 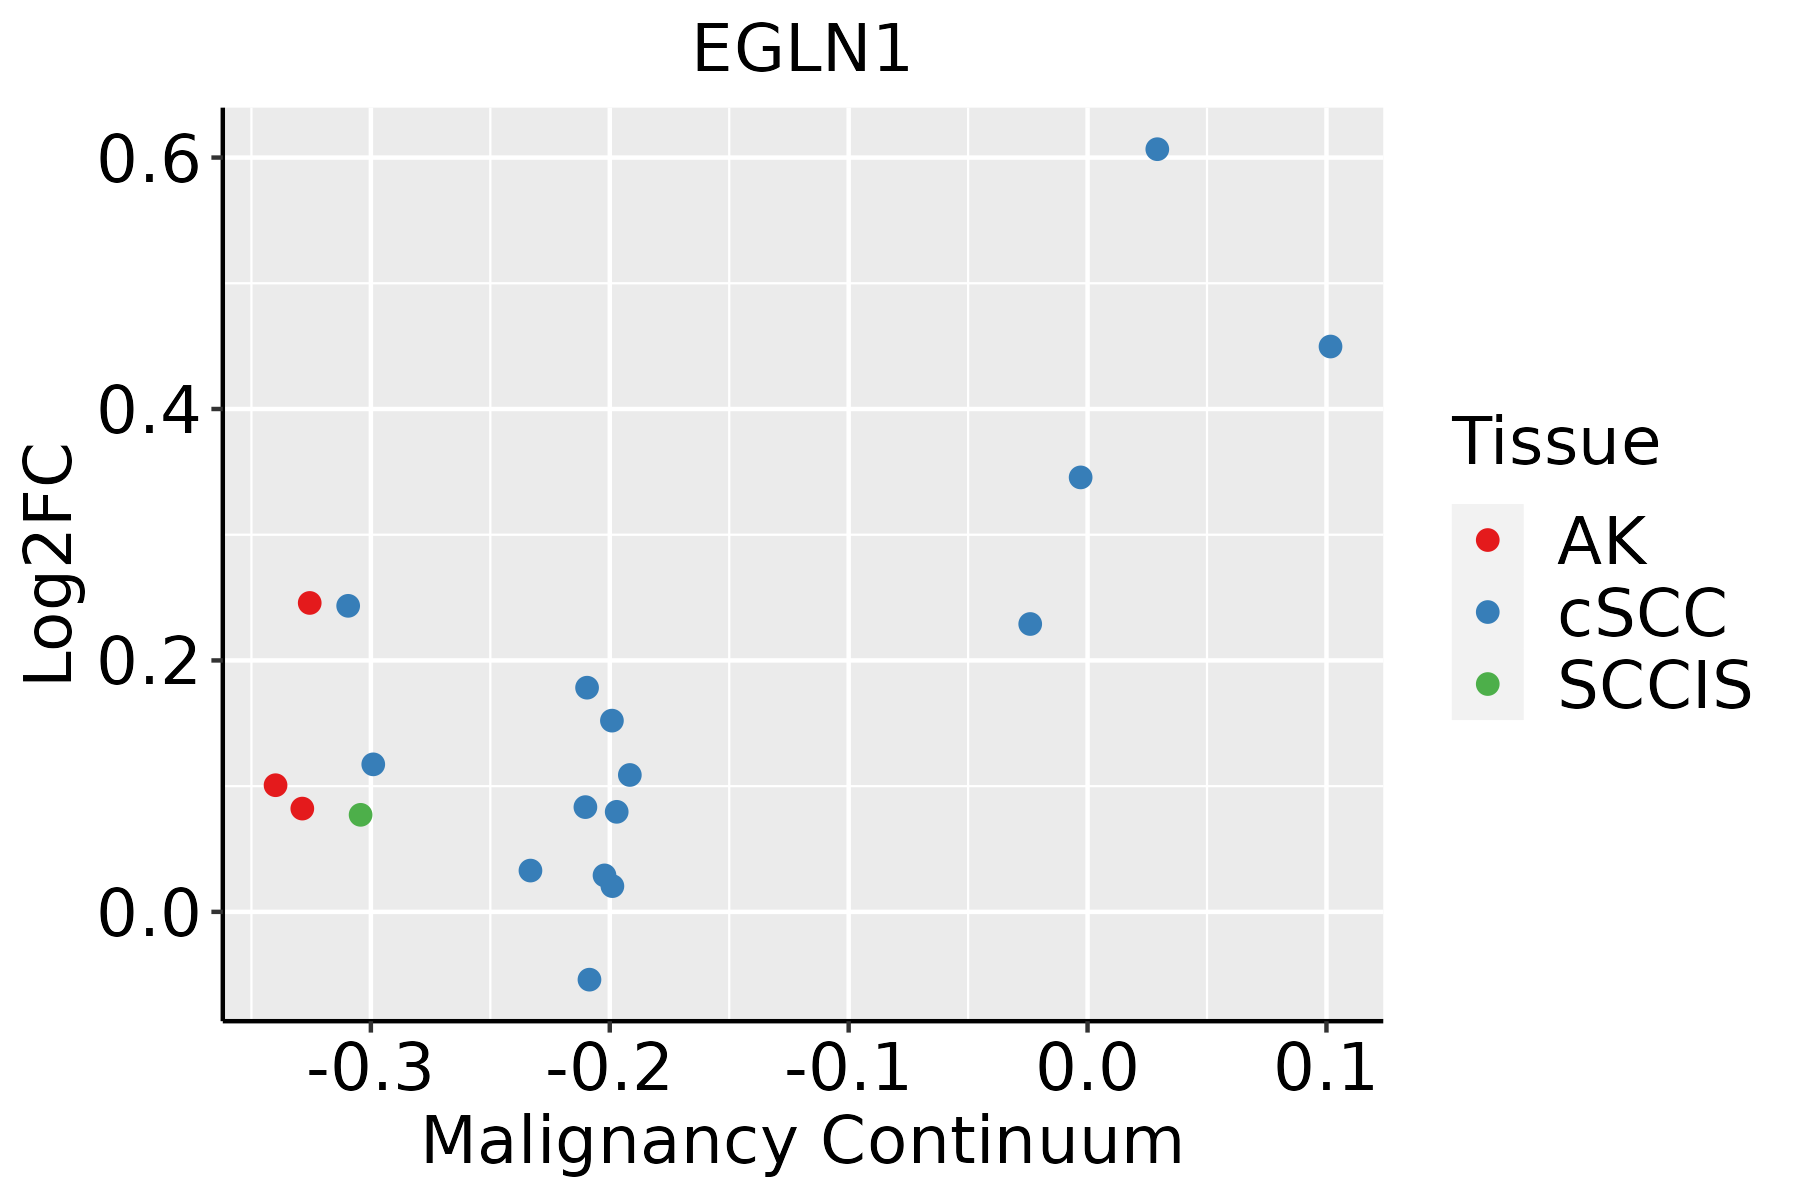 | AK: Actinic keratosis |
| cSCC: Cutaneous squamous cell carcinoma | ||
| SCCIS:squamous cell carcinoma in situ | ||
| Thyroid | 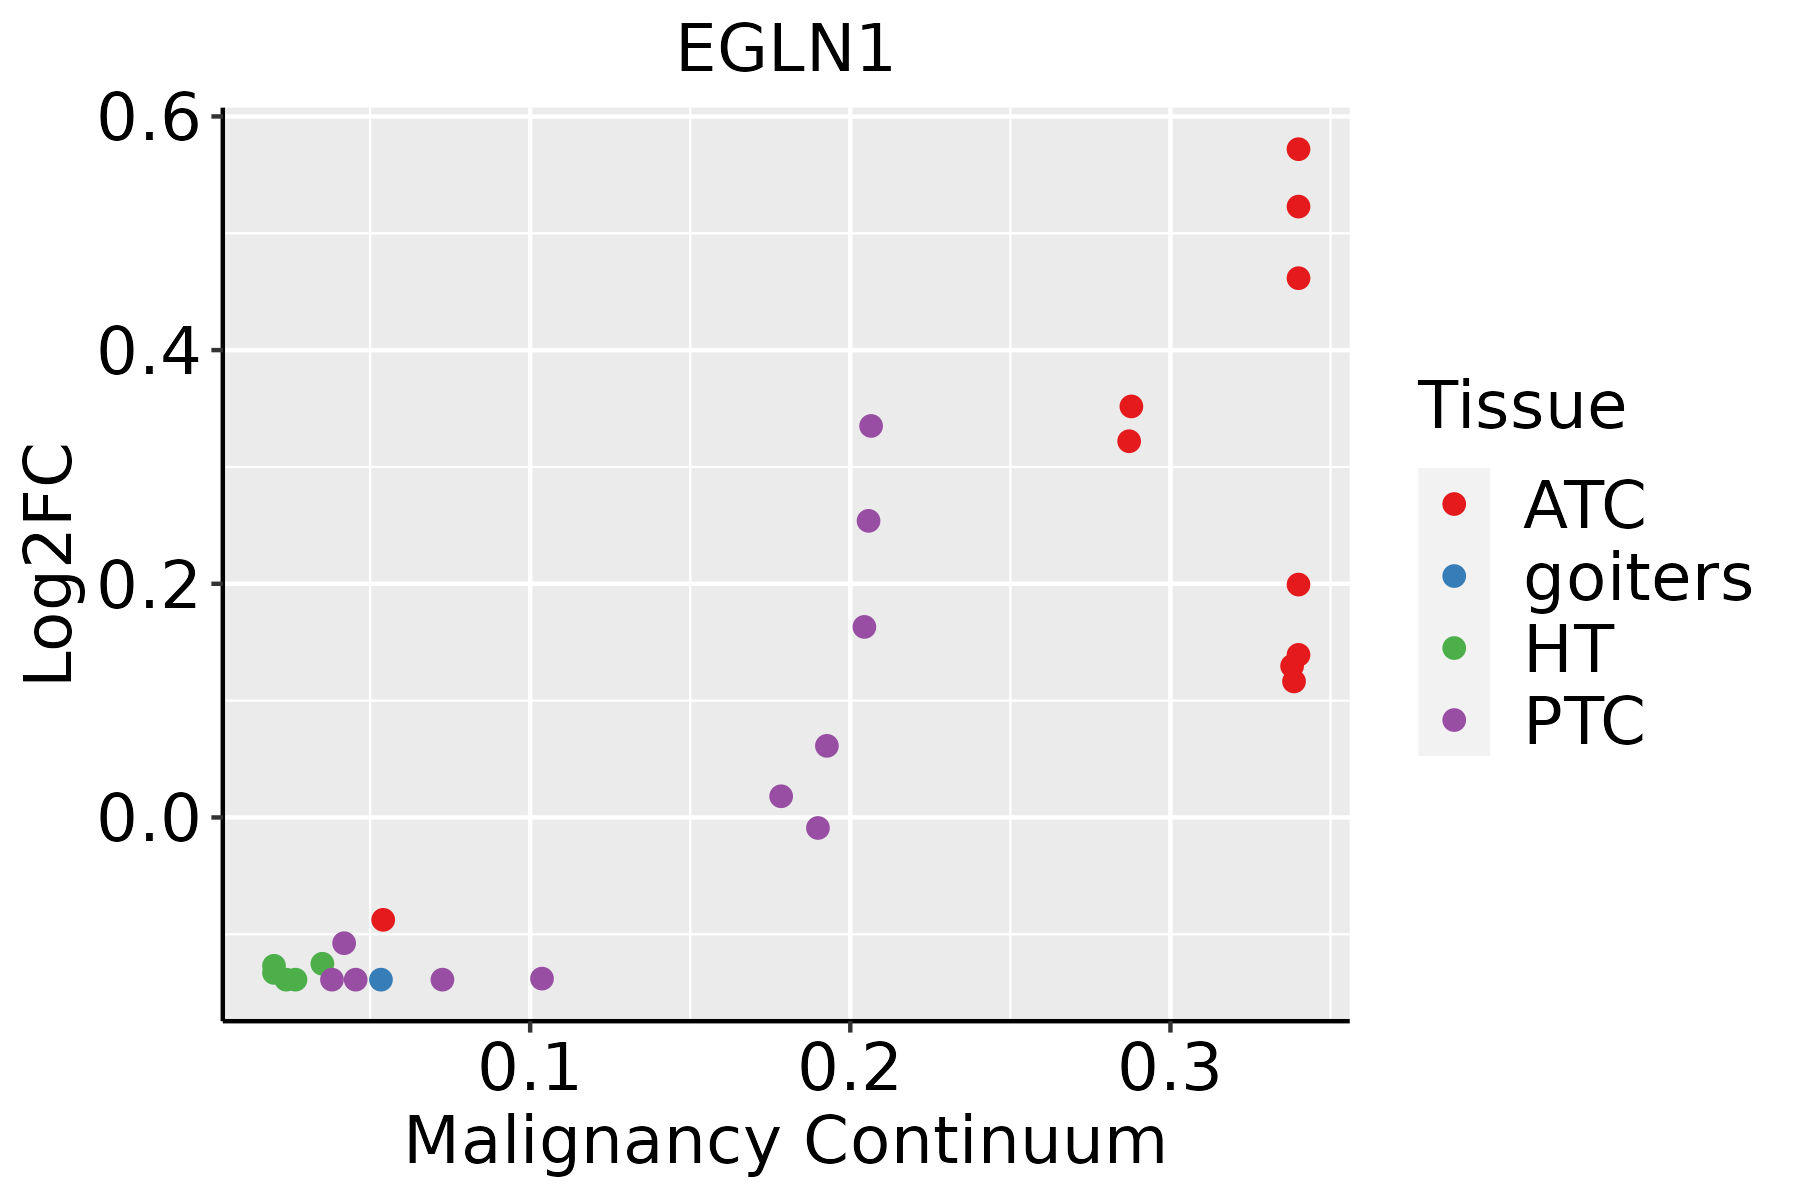 | ATC: Anaplastic thyroid cancer |
| HT: Hashimoto's thyroiditis | ||
| PTC: Papillary thyroid cancer |
| ∗log2FC in expression of this searched gene in stem-like cells from each diseased tissue sample relative to stem-like cells in normal samples in each tissue plotted against the malignancy continuum. Samples are colored based on if they are from different disease stage. |
Top |
Malignant transformation related pathway analysis |
| Find out the enriched GO biological processes and KEGG pathways involved in transition from healthy to precancer to cancer |
| Tissue | Disease Stage | Enriched GO biological Processes |
| Colorectum | AD |  |
| Colorectum | SER |  |
| Colorectum | MSS |  |
| Colorectum | MSI-H |  |
| Colorectum | FAP |  |
| ∗Top 15 enriched GO BP terms are showed in the bar plot of each disease state in each tissue. Each row represents a significant GO biological process which is colored according to the -log10(p.adjust). |
| Page: 1 2 3 4 5 6 7 8 9 |
| GO ID | Tissue | Disease Stage | Description | Gene Ratio | Bg Ratio | pvalue | p.adjust | Count |
| GO:0070482111 | Esophagus | ESCC | response to oxygen levels | 218/8552 | 347/18723 | 6.91e-11 | 2.17e-09 | 218 |
| GO:0036293111 | Esophagus | ESCC | response to decreased oxygen levels | 201/8552 | 322/18723 | 8.37e-10 | 2.04e-08 | 201 |
| GO:0001666111 | Esophagus | ESCC | response to hypoxia | 192/8552 | 307/18723 | 1.59e-09 | 3.69e-08 | 192 |
| GO:001820816 | Esophagus | ESCC | peptidyl-proline modification | 46/8552 | 58/18723 | 1.59e-07 | 2.51e-06 | 46 |
| GO:0071453110 | Esophagus | ESCC | cellular response to oxygen levels | 114/8552 | 177/18723 | 3.63e-07 | 5.06e-06 | 114 |
| GO:0036294110 | Esophagus | ESCC | cellular response to decreased oxygen levels | 105/8552 | 161/18723 | 4.20e-07 | 5.73e-06 | 105 |
| GO:00510908 | Esophagus | ESCC | regulation of DNA-binding transcription factor activity | 252/8552 | 440/18723 | 5.22e-07 | 6.97e-06 | 252 |
| GO:007145616 | Esophagus | ESCC | cellular response to hypoxia | 97/8552 | 151/18723 | 3.12e-06 | 3.51e-05 | 97 |
| GO:00181263 | Esophagus | ESCC | protein hydroxylation | 23/8552 | 27/18723 | 2.60e-05 | 2.19e-04 | 23 |
| GO:0051346110 | Esophagus | ESCC | negative regulation of hydrolase activity | 208/8552 | 379/18723 | 1.76e-04 | 1.14e-03 | 208 |
| GO:00195114 | Esophagus | ESCC | peptidyl-proline hydroxylation | 13/8552 | 15/18723 | 1.31e-03 | 6.26e-03 | 13 |
| GO:00434332 | Esophagus | ESCC | negative regulation of DNA-binding transcription factor activity | 103/8552 | 185/18723 | 3.86e-03 | 1.57e-02 | 103 |
| GO:00184014 | Esophagus | ESCC | peptidyl-proline hydroxylation to 4-hydroxy-L-proline | 9/8552 | 10/18723 | 5.09e-03 | 1.92e-02 | 9 |
| GO:00513467 | Liver | NAFLD | negative regulation of hydrolase activity | 62/1882 | 379/18723 | 8.11e-05 | 1.66e-03 | 62 |
| GO:0051342 | Liver | NAFLD | regulation of cyclic-nucleotide phosphodiesterase activity | 5/1882 | 10/18723 | 1.67e-03 | 1.74e-02 | 5 |
| GO:0071731 | Liver | NAFLD | response to nitric oxide | 7/1882 | 20/18723 | 2.44e-03 | 2.27e-02 | 7 |
| GO:005134612 | Liver | Cirrhotic | negative regulation of hydrolase activity | 139/4634 | 379/18723 | 1.24e-07 | 3.42e-06 | 139 |
| GO:00704827 | Liver | Cirrhotic | response to oxygen levels | 125/4634 | 347/18723 | 1.55e-06 | 3.02e-05 | 125 |
| GO:00362937 | Liver | Cirrhotic | response to decreased oxygen levels | 113/4634 | 322/18723 | 1.87e-05 | 2.52e-04 | 113 |
| GO:00016667 | Liver | Cirrhotic | response to hypoxia | 108/4634 | 307/18723 | 2.51e-05 | 3.26e-04 | 108 |
| Page: 1 2 3 4 5 6 |
| Pathway ID | Tissue | Disease Stage | Description | Gene Ratio | Bg Ratio | pvalue | p.adjust | qvalue | Count |
| hsa0521118 | Esophagus | ESCC | Renal cell carcinoma | 51/4205 | 69/8465 | 3.29e-05 | 1.53e-04 | 7.83e-05 | 51 |
| hsa0406629 | Esophagus | ESCC | HIF-1 signaling pathway | 75/4205 | 109/8465 | 3.66e-05 | 1.68e-04 | 8.60e-05 | 75 |
| hsa0521119 | Esophagus | ESCC | Renal cell carcinoma | 51/4205 | 69/8465 | 3.29e-05 | 1.53e-04 | 7.83e-05 | 51 |
| hsa04066113 | Esophagus | ESCC | HIF-1 signaling pathway | 75/4205 | 109/8465 | 3.66e-05 | 1.68e-04 | 8.60e-05 | 75 |
| hsa052116 | Liver | Cirrhotic | Renal cell carcinoma | 33/2530 | 69/8465 | 1.24e-03 | 6.64e-03 | 4.09e-03 | 33 |
| hsa0406612 | Liver | Cirrhotic | HIF-1 signaling pathway | 46/2530 | 109/8465 | 4.00e-03 | 1.59e-02 | 9.78e-03 | 46 |
| hsa0521111 | Liver | Cirrhotic | Renal cell carcinoma | 33/2530 | 69/8465 | 1.24e-03 | 6.64e-03 | 4.09e-03 | 33 |
| hsa0406613 | Liver | Cirrhotic | HIF-1 signaling pathway | 46/2530 | 109/8465 | 4.00e-03 | 1.59e-02 | 9.78e-03 | 46 |
| hsa0521121 | Liver | HCC | Renal cell carcinoma | 51/4020 | 69/8465 | 6.76e-06 | 5.53e-05 | 3.07e-05 | 51 |
| hsa0406622 | Liver | HCC | HIF-1 signaling pathway | 70/4020 | 109/8465 | 2.96e-04 | 1.36e-03 | 7.57e-04 | 70 |
| hsa0521131 | Liver | HCC | Renal cell carcinoma | 51/4020 | 69/8465 | 6.76e-06 | 5.53e-05 | 3.07e-05 | 51 |
| hsa0406632 | Liver | HCC | HIF-1 signaling pathway | 70/4020 | 109/8465 | 2.96e-04 | 1.36e-03 | 7.57e-04 | 70 |
| hsa0521116 | Oral cavity | OSCC | Renal cell carcinoma | 51/3704 | 69/8465 | 3.30e-07 | 2.05e-06 | 1.04e-06 | 51 |
| hsa0406627 | Oral cavity | OSCC | HIF-1 signaling pathway | 68/3704 | 109/8465 | 6.30e-05 | 2.48e-04 | 1.26e-04 | 68 |
| hsa0521117 | Oral cavity | OSCC | Renal cell carcinoma | 51/3704 | 69/8465 | 3.30e-07 | 2.05e-06 | 1.04e-06 | 51 |
| hsa04066112 | Oral cavity | OSCC | HIF-1 signaling pathway | 68/3704 | 109/8465 | 6.30e-05 | 2.48e-04 | 1.26e-04 | 68 |
| hsa0521141 | Oral cavity | EOLP | Renal cell carcinoma | 25/1218 | 69/8465 | 4.96e-06 | 3.27e-05 | 1.93e-05 | 25 |
| hsa0406643 | Oral cavity | EOLP | HIF-1 signaling pathway | 33/1218 | 109/8465 | 1.48e-05 | 8.08e-05 | 4.76e-05 | 33 |
| hsa0521151 | Oral cavity | EOLP | Renal cell carcinoma | 25/1218 | 69/8465 | 4.96e-06 | 3.27e-05 | 1.93e-05 | 25 |
| hsa0406653 | Oral cavity | EOLP | HIF-1 signaling pathway | 33/1218 | 109/8465 | 1.48e-05 | 8.08e-05 | 4.76e-05 | 33 |
| Page: 1 2 |
Top |
Cell-cell communication analysis |
| Identification of potential cell-cell interactions between two cell types and their ligand-receptor pairs for different disease states |
| Ligand | Receptor | LRpair | Pathway | Tissue | Disease Stage |
| Page: 1 |
Top |
Single-cell gene regulatory network inference analysis |
| Find out the significant the regulons (TFs) and the target genes of each regulon across cell types for different disease states |
| TF | Cell Type | Tissue | Disease Stage | Target Gene | RSS | Regulon Activity |
| ∗The dot plots of a searched regulon are shown for all cell subpopulations in each disease state of each tissue based on the regulon specific score inferred using pySCENIC and by calculating the average expression. |
| Page: 1 |
Top |
Somatic mutation of malignant transformation related genes |
| Annotation of somatic variants for genes involved in malignant transformation |
| Hugo Symbol | Variant Class | Variant Classification | dbSNP RS | HGVSc | HGVSp | HGVSp Short | SWISSPROT | BIOTYPE | SIFT | PolyPhen | Tumor Sample Barcode | Tissue | Histology | Sex | Age | Stage | Therapy Types | Drugs | Outcome |
| EGLN1 | SNV | Missense_Mutation | novel | c.911N>T | p.Pro304Leu | p.P304L | Q9GZT9 | protein_coding | deleterious(0) | probably_damaging(0.991) | TCGA-5L-AAT1-01 | Breast | breast invasive carcinoma | Female | <65 | III/IV | Hormone Therapy | letrozol | SD |
| EGLN1 | SNV | Missense_Mutation | novel | c.1205A>C | p.Lys402Thr | p.K402T | Q9GZT9 | protein_coding | deleterious(0) | possibly_damaging(0.866) | TCGA-AN-A046-01 | Breast | breast invasive carcinoma | Female | >=65 | I/II | Unknown | Unknown | SD |
| EGLN1 | SNV | Missense_Mutation | c.943N>A | p.Asp315Asn | p.D315N | Q9GZT9 | protein_coding | deleterious(0) | probably_damaging(0.981) | TCGA-GM-A2DH-01 | Breast | breast invasive carcinoma | Female | <65 | I/II | Chemotherapy | taxol | CR | |
| EGLN1 | insertion | Nonsense_Mutation | novel | c.694_695insAACCATGCAATTAG | p.Thr232LysfsTer5 | p.T232Kfs*5 | Q9GZT9 | protein_coding | TCGA-BH-A0B1-01 | Breast | breast invasive carcinoma | Female | >=65 | I/II | Chemotherapy | adriamycin | SD | ||
| EGLN1 | SNV | Missense_Mutation | c.880N>A | p.Gly294Ser | p.G294S | Q9GZT9 | protein_coding | deleterious(0) | benign(0.333) | TCGA-DS-A0VM-01 | Cervix | cervical & endocervical cancer | Female | <65 | I/II | Chemotherapy | cisplatin | PD | |
| EGLN1 | SNV | Missense_Mutation | c.827N>C | p.Met276Thr | p.M276T | Q9GZT9 | protein_coding | deleterious(0) | benign(0.092) | TCGA-AA-3815-01 | Colorectum | colon adenocarcinoma | Female | >=65 | I/II | Unknown | Unknown | SD | |
| EGLN1 | SNV | Missense_Mutation | rs147839743 | c.1259C>T | p.Ser420Leu | p.S420L | Q9GZT9 | protein_coding | deleterious_low_confidence(0.05) | benign(0.338) | TCGA-AA-A00N-01 | Colorectum | colon adenocarcinoma | Male | >=65 | I/II | Unknown | Unknown | PD |
| EGLN1 | SNV | Missense_Mutation | c.1031G>A | p.Arg344Gln | p.R344Q | Q9GZT9 | protein_coding | tolerated(0.18) | possibly_damaging(0.898) | TCGA-AZ-4315-01 | Colorectum | colon adenocarcinoma | Male | <65 | I/II | Unknown | Unknown | SD | |
| EGLN1 | SNV | Missense_Mutation | c.772N>C | p.Trp258Arg | p.W258R | Q9GZT9 | protein_coding | deleterious(0) | probably_damaging(1) | TCGA-CA-6718-01 | Colorectum | colon adenocarcinoma | Male | <65 | I/II | Unknown | Unknown | PD | |
| EGLN1 | SNV | Missense_Mutation | c.682N>A | p.Ala228Thr | p.A228T | Q9GZT9 | protein_coding | tolerated(0.13) | benign(0.017) | TCGA-G4-6588-01 | Colorectum | colon adenocarcinoma | Female | <65 | I/II | Unknown | Unknown | SD |
| Page: 1 2 3 4 |
Top |
Related drugs of malignant transformation related genes |
| Identification of chemicals and drugs interact with genes involved in malignant transfromation |
| (DGIdb 4.0) |
| Entrez ID | Symbol | Category | Interaction Types | Drug Claim Name | Drug Name | PMIDs |
| 54583 | EGLN1 | ENZYME, CLINICALLY ACTIONABLE, DRUGGABLE GENOME | L-4-THIOPROLINE | CHEMBL1800368 | 21665470 | |
| 54583 | EGLN1 | ENZYME, CLINICALLY ACTIONABLE, DRUGGABLE GENOME | US8921389, 22 | |||
| 54583 | EGLN1 | ENZYME, CLINICALLY ACTIONABLE, DRUGGABLE GENOME | FG-2216 | |||
| 54583 | EGLN1 | ENZYME, CLINICALLY ACTIONABLE, DRUGGABLE GENOME | US10149841, Compound 19 | |||
| 54583 | EGLN1 | ENZYME, CLINICALLY ACTIONABLE, DRUGGABLE GENOME | US10100051, Compound 1 | |||
| 54583 | EGLN1 | ENZYME, CLINICALLY ACTIONABLE, DRUGGABLE GENOME | US9409892, 148 | |||
| 54583 | EGLN1 | ENZYME, CLINICALLY ACTIONABLE, DRUGGABLE GENOME | US10149841, Compound 5 | |||
| 54583 | EGLN1 | ENZYME, CLINICALLY ACTIONABLE, DRUGGABLE GENOME | US9409892, 19 | |||
| 54583 | EGLN1 | ENZYME, CLINICALLY ACTIONABLE, DRUGGABLE GENOME | US9422240, 1-282 | |||
| 54583 | EGLN1 | ENZYME, CLINICALLY ACTIONABLE, DRUGGABLE GENOME | US9340511, 7 |
| Page: 1 2 3 4 5 |

Copyright 2023-Present -The University of Texas Health Science Center at Houston |