
|
|||||
|
 | |
| |
| |
| |
| |
| |
|
Gene: EGFL6 |
Gene summary for EGFL6 |
| Gene information | Species | Human | Gene symbol | EGFL6 | Gene ID | 25975 |
| Gene name | EGF like domain multiple 6 | |
| Gene Alias | MAEG | |
| Cytomap | Xp22.2 | |
| Gene Type | protein-coding | GO ID | GO:0007155 | UniProtAcc | Q8IUX8 |
Top |
Malignant transformation analysis |
| Identification of the aberrant gene expression in precancerous and cancerous lesions by comparing the gene expression of stem-like cells in diseased tissues with normal stem cells |
| Entrez ID | Symbol | Replicates | Species | Organ | Tissue | Adj P-value | Log2FC | Malignancy |
| 25975 | EGFL6 | LZE4T | Human | Esophagus | ESCC | 6.35e-03 | 1.81e-01 | 0.0811 |
| 25975 | EGFL6 | LZE8T | Human | Esophagus | ESCC | 4.02e-05 | 2.10e-01 | 0.067 |
| 25975 | EGFL6 | LZE20T | Human | Esophagus | ESCC | 3.16e-03 | 1.63e-01 | 0.0662 |
| 25975 | EGFL6 | LZE22T | Human | Esophagus | ESCC | 1.57e-02 | 2.50e-01 | 0.068 |
| 25975 | EGFL6 | P1T-E | Human | Esophagus | ESCC | 1.09e-04 | 2.76e-01 | 0.0875 |
| 25975 | EGFL6 | P4T-E | Human | Esophagus | ESCC | 2.45e-12 | 3.44e-01 | 0.1323 |
| 25975 | EGFL6 | P5T-E | Human | Esophagus | ESCC | 1.78e-03 | 3.12e-01 | 0.1327 |
| 25975 | EGFL6 | P8T-E | Human | Esophagus | ESCC | 1.77e-22 | 4.14e-01 | 0.0889 |
| 25975 | EGFL6 | P9T-E | Human | Esophagus | ESCC | 6.74e-06 | 3.66e-01 | 0.1131 |
| 25975 | EGFL6 | P23T-E | Human | Esophagus | ESCC | 6.93e-10 | 7.42e-01 | 0.108 |
| 25975 | EGFL6 | P26T-E | Human | Esophagus | ESCC | 3.97e-04 | 2.12e-01 | 0.1276 |
| 25975 | EGFL6 | P27T-E | Human | Esophagus | ESCC | 2.86e-20 | 3.95e-01 | 0.1055 |
| 25975 | EGFL6 | P28T-E | Human | Esophagus | ESCC | 1.78e-03 | 1.99e-01 | 0.1149 |
| 25975 | EGFL6 | P37T-E | Human | Esophagus | ESCC | 2.31e-05 | 4.02e-01 | 0.1371 |
| 25975 | EGFL6 | P42T-E | Human | Esophagus | ESCC | 8.55e-05 | 1.05e+00 | 0.1175 |
| 25975 | EGFL6 | P44T-E | Human | Esophagus | ESCC | 1.88e-05 | 6.37e-01 | 0.1096 |
| 25975 | EGFL6 | P47T-E | Human | Esophagus | ESCC | 1.88e-11 | 4.12e-01 | 0.1067 |
| 25975 | EGFL6 | P54T-E | Human | Esophagus | ESCC | 6.60e-44 | 9.56e-01 | 0.0975 |
| 25975 | EGFL6 | P61T-E | Human | Esophagus | ESCC | 5.99e-03 | 1.08e-01 | 0.099 |
| 25975 | EGFL6 | P62T-E | Human | Esophagus | ESCC | 2.57e-02 | 9.44e-02 | 0.1302 |
| Page: 1 2 |
| Tissue | Expression Dynamics | Abbreviation |
| Esophagus | 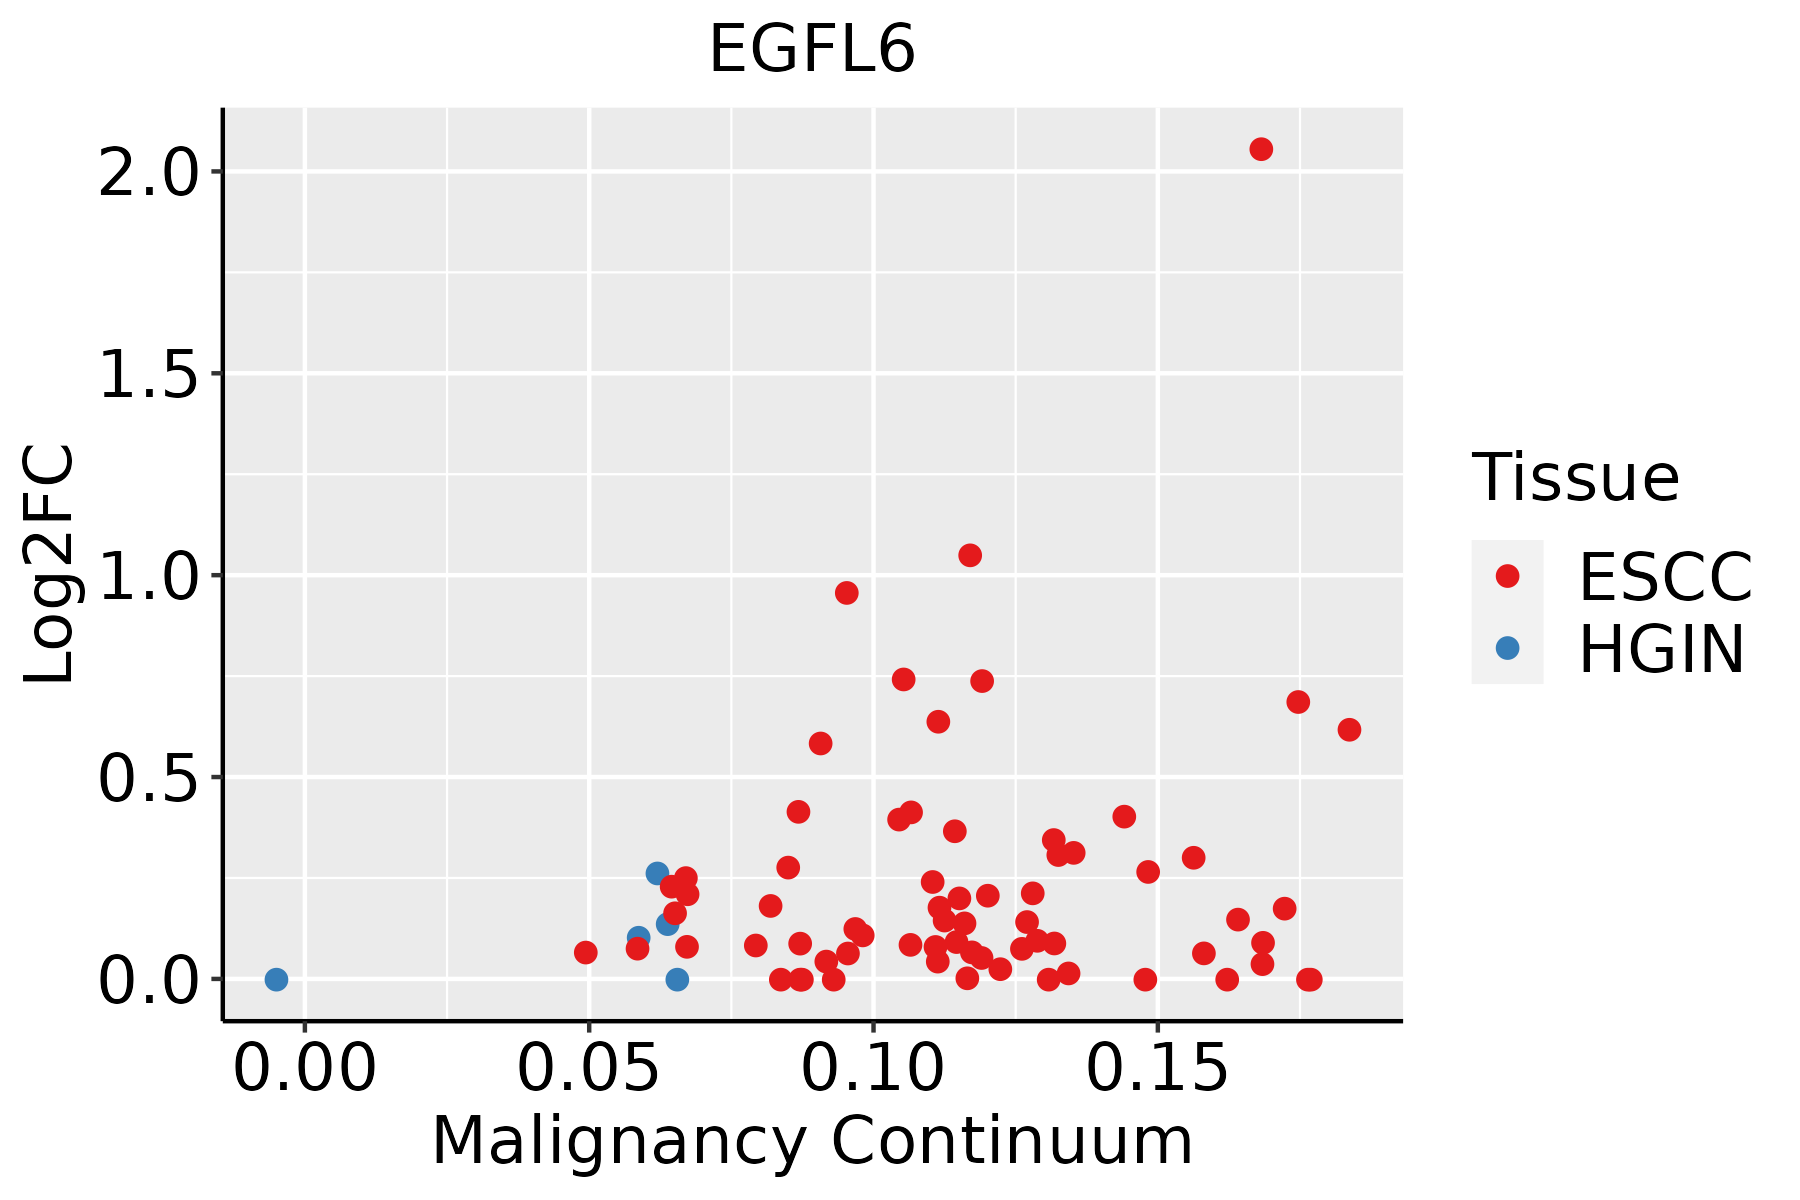 | ESCC: Esophageal squamous cell carcinoma |
| HGIN: High-grade intraepithelial neoplasias | ||
| LGIN: Low-grade intraepithelial neoplasias |
| ∗log2FC in expression of this searched gene in stem-like cells from each diseased tissue sample relative to stem-like cells in normal samples in each tissue plotted against the malignancy continuum. Samples are colored based on if they are from different disease stage. |
Top |
Malignant transformation related pathway analysis |
| Find out the enriched GO biological processes and KEGG pathways involved in transition from healthy to precancer to cancer |
| Tissue | Disease Stage | Enriched GO biological Processes |
| Colorectum | AD |  |
| Colorectum | SER |  |
| Colorectum | MSS |  |
| Colorectum | MSI-H |  |
| Colorectum | FAP |  |
| ∗Top 15 enriched GO BP terms are showed in the bar plot of each disease state in each tissue. Each row represents a significant GO biological process which is colored according to the -log10(p.adjust). |
| Page: 1 2 3 4 5 6 7 8 9 |
| GO ID | Tissue | Disease Stage | Description | Gene Ratio | Bg Ratio | pvalue | p.adjust | Count |
| GO:003158919 | Esophagus | ESCC | cell-substrate adhesion | 221/8552 | 363/18723 | 3.06e-09 | 6.62e-08 | 221 |
| GO:001081020 | Esophagus | ESCC | regulation of cell-substrate adhesion | 144/8552 | 221/18723 | 3.55e-09 | 7.45e-08 | 144 |
| GO:004578527 | Esophagus | ESCC | positive regulation of cell adhesion | 255/8552 | 437/18723 | 5.07e-08 | 9.11e-07 | 255 |
| GO:001081126 | Esophagus | ESCC | positive regulation of cell-substrate adhesion | 84/8552 | 123/18723 | 3.18e-07 | 4.50e-06 | 84 |
| GO:00301984 | Esophagus | ESCC | extracellular matrix organization | 171/8552 | 301/18723 | 6.08e-05 | 4.67e-04 | 171 |
| GO:00430624 | Esophagus | ESCC | extracellular structure organization | 171/8552 | 302/18723 | 7.73e-05 | 5.76e-04 | 171 |
| GO:00452294 | Esophagus | ESCC | external encapsulating structure organization | 172/8552 | 304/18723 | 7.80e-05 | 5.80e-04 | 172 |
| Page: 1 |
| Pathway ID | Tissue | Disease Stage | Description | Gene Ratio | Bg Ratio | pvalue | p.adjust | qvalue | Count |
| Page: 1 |
Top |
Cell-cell communication analysis |
| Identification of potential cell-cell interactions between two cell types and their ligand-receptor pairs for different disease states |
| Ligand | Receptor | LRpair | Pathway | Tissue | Disease Stage |
| Page: 1 |
Top |
Single-cell gene regulatory network inference analysis |
| Find out the significant the regulons (TFs) and the target genes of each regulon across cell types for different disease states |
| TF | Cell Type | Tissue | Disease Stage | Target Gene | RSS | Regulon Activity |
| ∗The dot plots of a searched regulon are shown for all cell subpopulations in each disease state of each tissue based on the regulon specific score inferred using pySCENIC and by calculating the average expression. |
| Page: 1 |
Top |
Somatic mutation of malignant transformation related genes |
| Annotation of somatic variants for genes involved in malignant transformation |
| Hugo Symbol | Variant Class | Variant Classification | dbSNP RS | HGVSc | HGVSp | HGVSp Short | SWISSPROT | BIOTYPE | SIFT | PolyPhen | Tumor Sample Barcode | Tissue | Histology | Sex | Age | Stage | Therapy Types | Drugs | Outcome |
| EGFL6 | SNV | Missense_Mutation | novel | c.1199N>G | p.Ser400Trp | p.S400W | Q8IUX8 | protein_coding | tolerated(0.06) | possibly_damaging(0.888) | TCGA-3C-AALI-01 | Breast | breast invasive carcinoma | Female | <65 | I/II | Unspecific | Poly E | Complete Response |
| EGFL6 | SNV | Missense_Mutation | novel | c.904N>A | p.Glu302Lys | p.E302K | Q8IUX8 | protein_coding | deleterious(0.03) | benign(0.15) | TCGA-5L-AAT1-01 | Breast | breast invasive carcinoma | Female | <65 | III/IV | Hormone Therapy | letrozol | SD |
| EGFL6 | SNV | Missense_Mutation | rs771187397 | c.300N>T | p.Met100Ile | p.M100I | Q8IUX8 | protein_coding | tolerated(0.1) | benign(0) | TCGA-AC-A5XS-01 | Breast | breast invasive carcinoma | Female | >=65 | I/II | Hormone Therapy | femara | SD |
| EGFL6 | SNV | Missense_Mutation | novel | c.1415C>G | p.Ala472Gly | p.A472G | Q8IUX8 | protein_coding | deleterious(0) | benign(0.359) | TCGA-AN-A0G0-01 | Breast | breast invasive carcinoma | Female | <65 | I/II | Unknown | Unknown | SD |
| EGFL6 | SNV | Missense_Mutation | c.715N>G | p.Thr239Ala | p.T239A | Q8IUX8 | protein_coding | deleterious(0.02) | probably_damaging(0.997) | TCGA-D8-A1XK-01 | Breast | breast invasive carcinoma | Female | <65 | I/II | Chemotherapy | doxorubicine+cyclophosphamide | SD | |
| EGFL6 | deletion | In_Frame_Del | c.550_552delATC | p.Ile184del | p.I184del | Q8IUX8 | protein_coding | TCGA-A8-A06X-01 | Breast | breast invasive carcinoma | Female | >=65 | I/II | Unknown | Unknown | SD | |||
| EGFL6 | deletion | Frame_Shift_Del | novel | c.358delT | p.Cys120AlafsTer14 | p.C120Afs*14 | Q8IUX8 | protein_coding | TCGA-D8-A27V-01 | Breast | breast invasive carcinoma | Female | <65 | I/II | Hormone Therapy | tamoxiphen | SD | ||
| EGFL6 | deletion | Frame_Shift_Del | novel | c.1446delT | p.Phe482LeufsTer2 | p.F482Lfs*2 | Q8IUX8 | protein_coding | TCGA-D8-A27V-01 | Breast | breast invasive carcinoma | Female | <65 | I/II | Hormone Therapy | tamoxiphen | SD | ||
| EGFL6 | SNV | Missense_Mutation | c.1079N>A | p.Arg360Gln | p.R360Q | Q8IUX8 | protein_coding | tolerated(1) | benign(0.001) | TCGA-DG-A2KH-01 | Cervix | cervical & endocervical cancer | Female | <65 | I/II | Unknown | Unknown | SD | |
| EGFL6 | SNV | Missense_Mutation | novel | c.770N>A | p.Arg257Gln | p.R257Q | Q8IUX8 | protein_coding | tolerated(0.95) | benign(0) | TCGA-A6-2672-01 | Colorectum | colon adenocarcinoma | Female | >=65 | III/IV | Unknown | Unknown | SD |
| Page: 1 2 3 4 5 6 7 |
Top |
Related drugs of malignant transformation related genes |
| Identification of chemicals and drugs interact with genes involved in malignant transfromation |
| (DGIdb 4.0) |
| Entrez ID | Symbol | Category | Interaction Types | Drug Claim Name | Drug Name | PMIDs |
| Page: 1 |

Copyright 2023-Present -The University of Texas Health Science Center at Houston |