
|
|||||
|
 | |
| |
| |
| |
| |
| |
|
Gene: EFTUD2 |
Gene summary for EFTUD2 |
| Gene information | Species | Human | Gene symbol | EFTUD2 | Gene ID | 9343 |
| Gene name | elongation factor Tu GTP binding domain containing 2 | |
| Gene Alias | MFDGA | |
| Cytomap | 17q21.31 | |
| Gene Type | protein-coding | GO ID | GO:0000375 | UniProtAcc | B3KX19 |
Top |
Malignant transformation analysis |
| Identification of the aberrant gene expression in precancerous and cancerous lesions by comparing the gene expression of stem-like cells in diseased tissues with normal stem cells |
| Entrez ID | Symbol | Replicates | Species | Organ | Tissue | Adj P-value | Log2FC | Malignancy |
| 9343 | EFTUD2 | HTA11_347_2000001011 | Human | Colorectum | AD | 3.19e-04 | 2.88e-01 | -0.1954 |
| 9343 | EFTUD2 | HTA11_1391_2000001011 | Human | Colorectum | AD | 1.17e-02 | 3.93e-01 | -0.059 |
| 9343 | EFTUD2 | HTA11_866_3004761011 | Human | Colorectum | AD | 2.79e-02 | 2.85e-01 | 0.096 |
| 9343 | EFTUD2 | HTA11_7696_3000711011 | Human | Colorectum | AD | 7.62e-05 | 2.98e-01 | 0.0674 |
| 9343 | EFTUD2 | HTA11_99999970781_79442 | Human | Colorectum | MSS | 1.78e-02 | 2.22e-01 | 0.294 |
| 9343 | EFTUD2 | HTA11_99999965062_69753 | Human | Colorectum | MSI-H | 5.70e-04 | 9.15e-01 | 0.3487 |
| 9343 | EFTUD2 | HTA11_99999971662_82457 | Human | Colorectum | MSS | 9.51e-09 | 5.74e-01 | 0.3859 |
| 9343 | EFTUD2 | HTA11_99999974143_84620 | Human | Colorectum | MSS | 2.55e-08 | 4.22e-01 | 0.3005 |
| 9343 | EFTUD2 | A015-C-203 | Human | Colorectum | FAP | 7.38e-04 | -1.00e-01 | -0.1294 |
| 9343 | EFTUD2 | A002-C-205 | Human | Colorectum | FAP | 1.11e-02 | -1.03e-01 | -0.1236 |
| 9343 | EFTUD2 | A015-C-104 | Human | Colorectum | FAP | 4.04e-04 | -9.54e-02 | -0.1899 |
| 9343 | EFTUD2 | A002-C-116 | Human | Colorectum | FAP | 3.90e-03 | -1.14e-01 | -0.0452 |
| 9343 | EFTUD2 | LZE4T | Human | Esophagus | ESCC | 3.87e-13 | 2.18e-01 | 0.0811 |
| 9343 | EFTUD2 | LZE5T | Human | Esophagus | ESCC | 1.84e-04 | 1.72e-01 | 0.0514 |
| 9343 | EFTUD2 | LZE7T | Human | Esophagus | ESCC | 7.14e-13 | 7.02e-01 | 0.0667 |
| 9343 | EFTUD2 | LZE20T | Human | Esophagus | ESCC | 3.59e-02 | 5.60e-02 | 0.0662 |
| 9343 | EFTUD2 | LZE24T | Human | Esophagus | ESCC | 7.28e-17 | 3.81e-01 | 0.0596 |
| 9343 | EFTUD2 | LZE21T | Human | Esophagus | ESCC | 1.41e-03 | 3.61e-01 | 0.0655 |
| 9343 | EFTUD2 | LZE6T | Human | Esophagus | ESCC | 1.35e-04 | 3.29e-01 | 0.0845 |
| 9343 | EFTUD2 | P1T-E | Human | Esophagus | ESCC | 7.66e-14 | 3.71e-01 | 0.0875 |
| Page: 1 2 3 4 5 6 7 |
| Tissue | Expression Dynamics | Abbreviation |
| Colorectum (GSE201348) |  | FAP: Familial adenomatous polyposis |
| CRC: Colorectal cancer | ||
| Colorectum (HTA11) |  | AD: Adenomas |
| SER: Sessile serrated lesions | ||
| MSI-H: Microsatellite-high colorectal cancer | ||
| MSS: Microsatellite stable colorectal cancer | ||
| Esophagus | 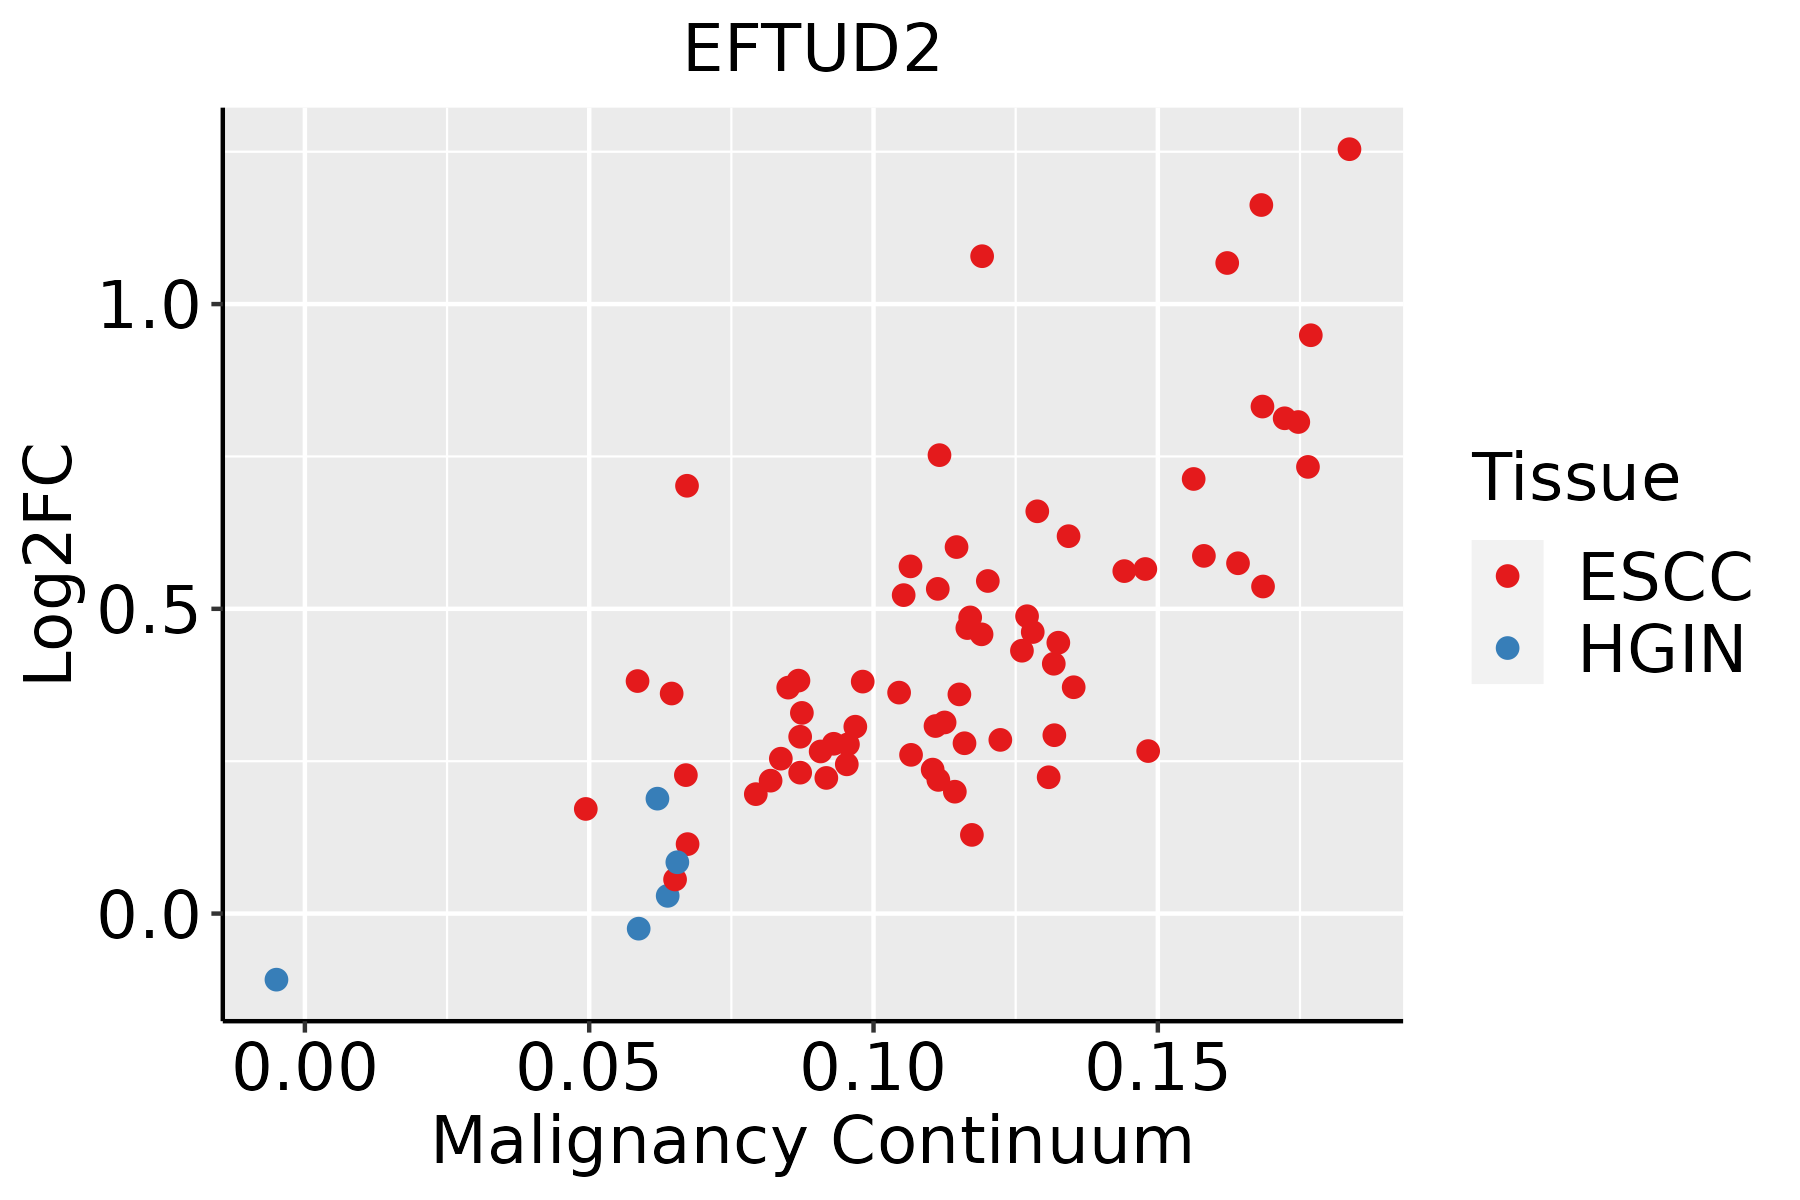 | ESCC: Esophageal squamous cell carcinoma |
| HGIN: High-grade intraepithelial neoplasias | ||
| LGIN: Low-grade intraepithelial neoplasias | ||
| Liver |  | HCC: Hepatocellular carcinoma |
| NAFLD: Non-alcoholic fatty liver disease | ||
| Oral Cavity | 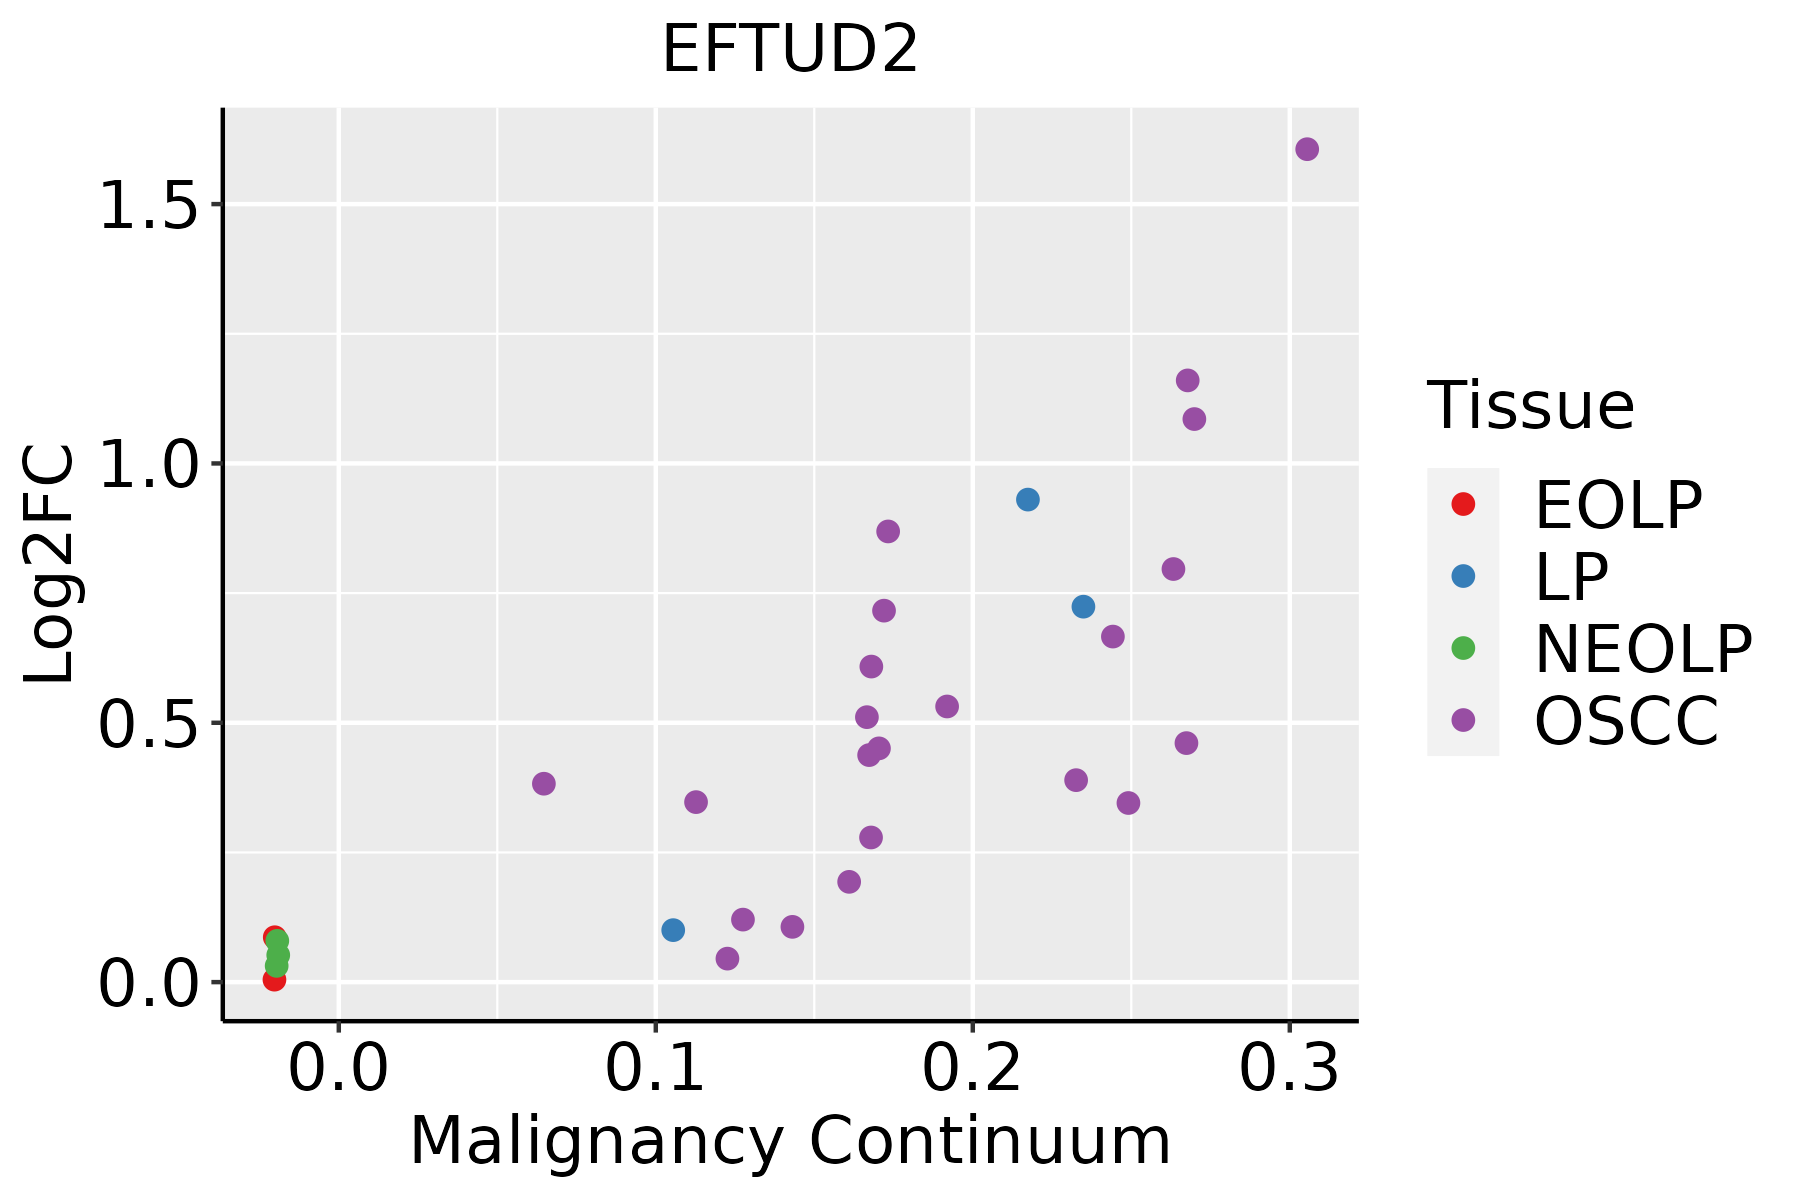 | EOLP: Erosive Oral lichen planus |
| LP: leukoplakia | ||
| NEOLP: Non-erosive oral lichen planus | ||
| OSCC: Oral squamous cell carcinoma | ||
| Skin |  | AK: Actinic keratosis |
| cSCC: Cutaneous squamous cell carcinoma | ||
| SCCIS:squamous cell carcinoma in situ | ||
| Thyroid | 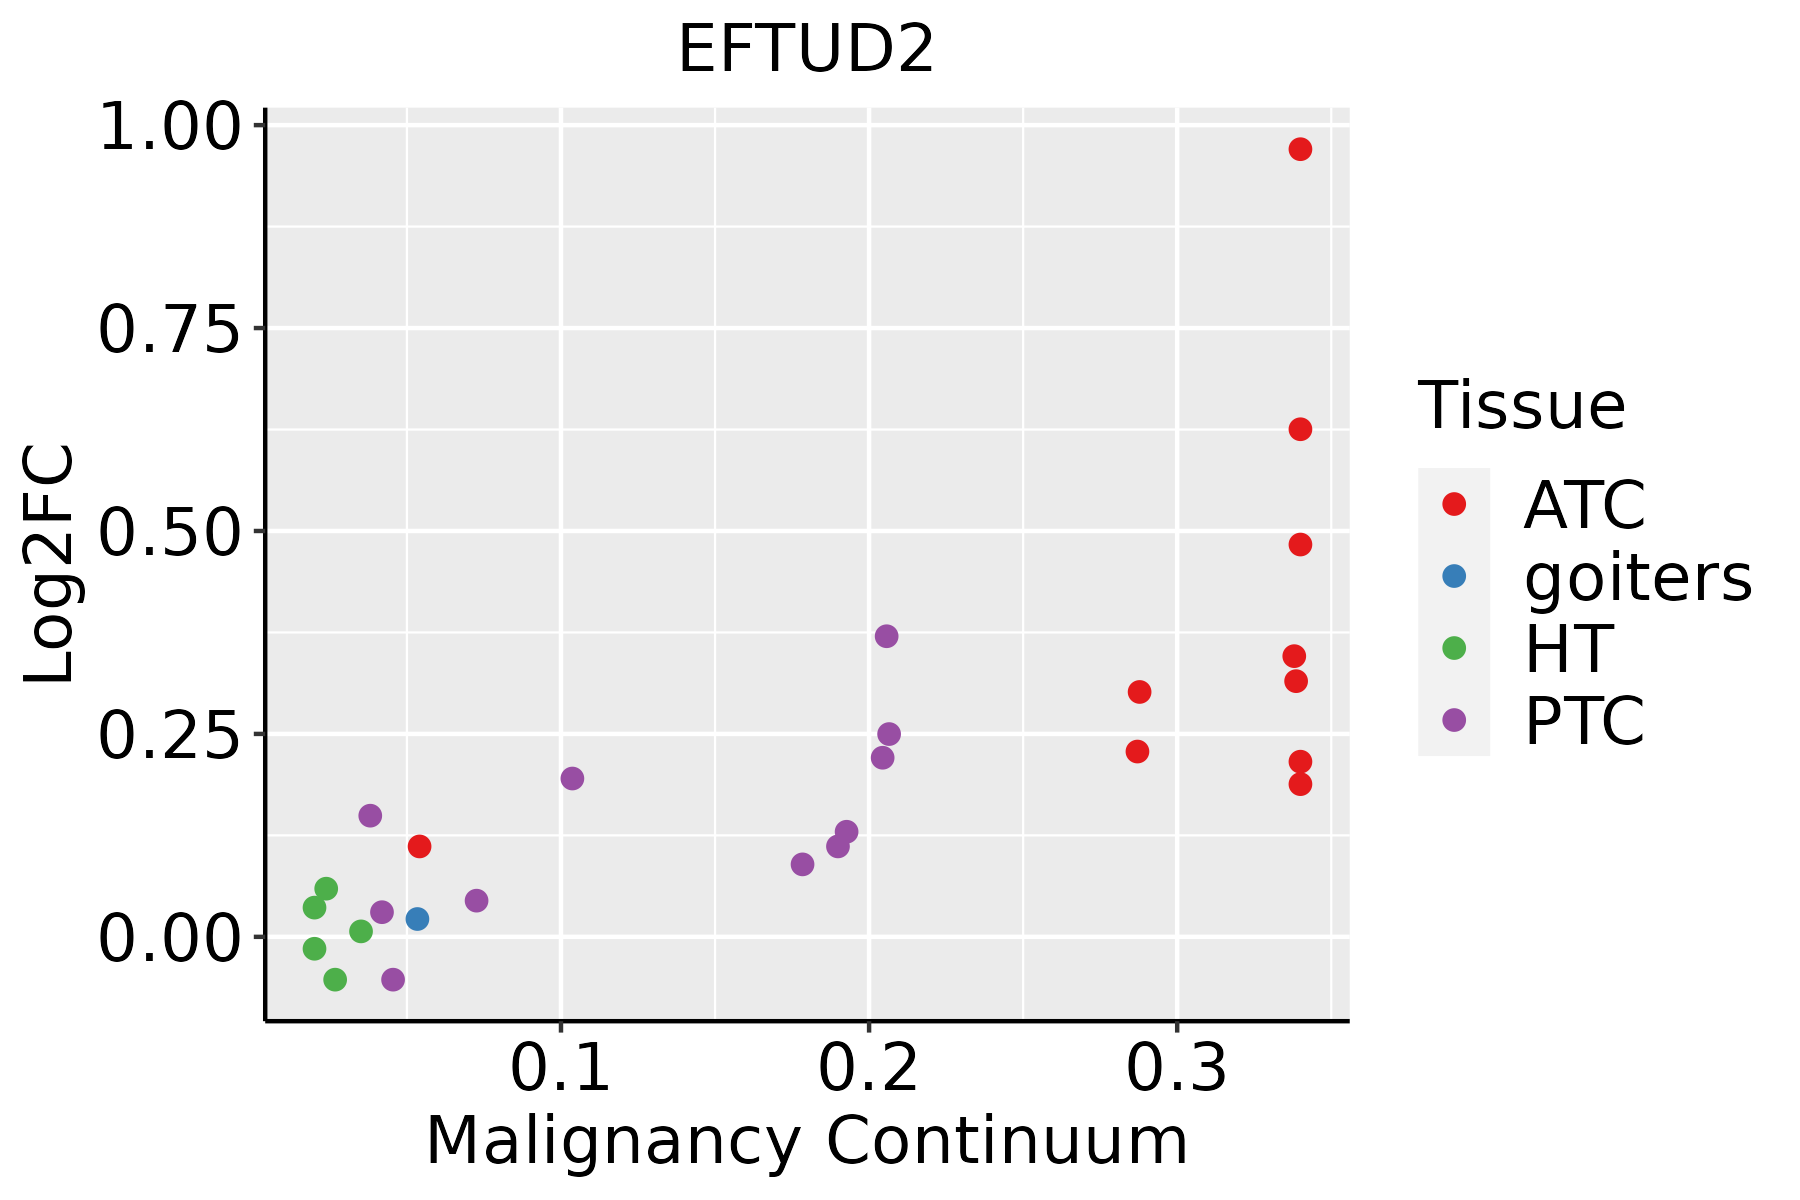 | ATC: Anaplastic thyroid cancer |
| HT: Hashimoto's thyroiditis | ||
| PTC: Papillary thyroid cancer |
| ∗log2FC in expression of this searched gene in stem-like cells from each diseased tissue sample relative to stem-like cells in normal samples in each tissue plotted against the malignancy continuum. Samples are colored based on if they are from different disease stage. |
Top |
Malignant transformation related pathway analysis |
| Find out the enriched GO biological processes and KEGG pathways involved in transition from healthy to precancer to cancer |
| Tissue | Disease Stage | Enriched GO biological Processes |
| Colorectum | AD |  |
| Colorectum | SER |  |
| Colorectum | MSS |  |
| Colorectum | MSI-H |  |
| Colorectum | FAP |  |
| ∗Top 15 enriched GO BP terms are showed in the bar plot of each disease state in each tissue. Each row represents a significant GO biological process which is colored according to the -log10(p.adjust). |
| Page: 1 2 3 4 5 6 7 8 9 |
| GO ID | Tissue | Disease Stage | Description | Gene Ratio | Bg Ratio | pvalue | p.adjust | Count |
| GO:0008380 | Colorectum | AD | RNA splicing | 169/3918 | 434/18723 | 3.59e-18 | 2.04e-15 | 169 |
| GO:0000377 | Colorectum | AD | RNA splicing, via transesterification reactions with bulged adenosine as nucleophile | 130/3918 | 320/18723 | 5.88e-16 | 2.16e-13 | 130 |
| GO:0000398 | Colorectum | AD | mRNA splicing, via spliceosome | 130/3918 | 320/18723 | 5.88e-16 | 2.16e-13 | 130 |
| GO:0000375 | Colorectum | AD | RNA splicing, via transesterification reactions | 131/3918 | 324/18723 | 7.11e-16 | 2.22e-13 | 131 |
| GO:0009410 | Colorectum | AD | response to xenobiotic stimulus | 128/3918 | 462/18723 | 2.69e-04 | 3.31e-03 | 128 |
| GO:00083802 | Colorectum | MSS | RNA splicing | 159/3467 | 434/18723 | 1.75e-19 | 1.22e-16 | 159 |
| GO:00003772 | Colorectum | MSS | RNA splicing, via transesterification reactions with bulged adenosine as nucleophile | 121/3467 | 320/18723 | 2.52e-16 | 8.27e-14 | 121 |
| GO:00003982 | Colorectum | MSS | mRNA splicing, via spliceosome | 121/3467 | 320/18723 | 2.52e-16 | 8.27e-14 | 121 |
| GO:00003752 | Colorectum | MSS | RNA splicing, via transesterification reactions | 122/3467 | 324/18723 | 2.75e-16 | 8.58e-14 | 122 |
| GO:00094101 | Colorectum | MSS | response to xenobiotic stimulus | 110/3467 | 462/18723 | 2.36e-03 | 1.92e-02 | 110 |
| GO:00083803 | Colorectum | MSI-H | RNA splicing | 82/1319 | 434/18723 | 1.22e-16 | 4.53e-14 | 82 |
| GO:00003753 | Colorectum | MSI-H | RNA splicing, via transesterification reactions | 67/1319 | 324/18723 | 7.99e-16 | 2.61e-13 | 67 |
| GO:00003773 | Colorectum | MSI-H | RNA splicing, via transesterification reactions with bulged adenosine as nucleophile | 66/1319 | 320/18723 | 1.51e-15 | 4.41e-13 | 66 |
| GO:00003983 | Colorectum | MSI-H | mRNA splicing, via spliceosome | 66/1319 | 320/18723 | 1.51e-15 | 4.41e-13 | 66 |
| GO:00083804 | Colorectum | FAP | RNA splicing | 108/2622 | 434/18723 | 7.90e-10 | 1.86e-07 | 108 |
| GO:00003754 | Colorectum | FAP | RNA splicing, via transesterification reactions | 84/2622 | 324/18723 | 8.06e-09 | 1.10e-06 | 84 |
| GO:00003774 | Colorectum | FAP | RNA splicing, via transesterification reactions with bulged adenosine as nucleophile | 83/2622 | 320/18723 | 9.66e-09 | 1.23e-06 | 83 |
| GO:00003984 | Colorectum | FAP | mRNA splicing, via spliceosome | 83/2622 | 320/18723 | 9.66e-09 | 1.23e-06 | 83 |
| GO:00094102 | Colorectum | FAP | response to xenobiotic stimulus | 87/2622 | 462/18723 | 2.15e-03 | 1.77e-02 | 87 |
| GO:0008380111 | Esophagus | ESCC | RNA splicing | 336/8552 | 434/18723 | 1.74e-42 | 3.67e-39 | 336 |
| Page: 1 2 3 4 |
| Pathway ID | Tissue | Disease Stage | Description | Gene Ratio | Bg Ratio | pvalue | p.adjust | qvalue | Count |
| hsa03040 | Colorectum | AD | Spliceosome | 73/2092 | 217/8465 | 1.73e-03 | 9.68e-03 | 6.18e-03 | 73 |
| hsa030401 | Colorectum | AD | Spliceosome | 73/2092 | 217/8465 | 1.73e-03 | 9.68e-03 | 6.18e-03 | 73 |
| hsa030402 | Colorectum | MSS | Spliceosome | 66/1875 | 217/8465 | 2.58e-03 | 1.27e-02 | 7.81e-03 | 66 |
| hsa030403 | Colorectum | MSS | Spliceosome | 66/1875 | 217/8465 | 2.58e-03 | 1.27e-02 | 7.81e-03 | 66 |
| hsa030404 | Colorectum | MSI-H | Spliceosome | 37/797 | 217/8465 | 2.49e-04 | 3.23e-03 | 2.70e-03 | 37 |
| hsa030405 | Colorectum | MSI-H | Spliceosome | 37/797 | 217/8465 | 2.49e-04 | 3.23e-03 | 2.70e-03 | 37 |
| hsa0304027 | Esophagus | ESCC | Spliceosome | 128/4205 | 217/8465 | 3.31e-03 | 8.79e-03 | 4.50e-03 | 128 |
| hsa0304037 | Esophagus | ESCC | Spliceosome | 128/4205 | 217/8465 | 3.31e-03 | 8.79e-03 | 4.50e-03 | 128 |
| hsa0304022 | Liver | HCC | Spliceosome | 122/4020 | 217/8465 | 5.55e-03 | 1.60e-02 | 8.91e-03 | 122 |
| hsa0304032 | Liver | HCC | Spliceosome | 122/4020 | 217/8465 | 5.55e-03 | 1.60e-02 | 8.91e-03 | 122 |
| hsa0304016 | Oral cavity | OSCC | Spliceosome | 123/3704 | 217/8465 | 7.21e-05 | 2.74e-04 | 1.40e-04 | 123 |
| hsa0304017 | Oral cavity | OSCC | Spliceosome | 123/3704 | 217/8465 | 7.21e-05 | 2.74e-04 | 1.40e-04 | 123 |
| hsa0304026 | Oral cavity | LP | Spliceosome | 106/2418 | 217/8465 | 1.30e-10 | 2.40e-09 | 1.55e-09 | 106 |
| hsa0304036 | Oral cavity | LP | Spliceosome | 106/2418 | 217/8465 | 1.30e-10 | 2.40e-09 | 1.55e-09 | 106 |
| Page: 1 |
Top |
Cell-cell communication analysis |
| Identification of potential cell-cell interactions between two cell types and their ligand-receptor pairs for different disease states |
| Ligand | Receptor | LRpair | Pathway | Tissue | Disease Stage |
| Page: 1 |
Top |
Single-cell gene regulatory network inference analysis |
| Find out the significant the regulons (TFs) and the target genes of each regulon across cell types for different disease states |
| TF | Cell Type | Tissue | Disease Stage | Target Gene | RSS | Regulon Activity |
| ∗The dot plots of a searched regulon are shown for all cell subpopulations in each disease state of each tissue based on the regulon specific score inferred using pySCENIC and by calculating the average expression. |
| Page: 1 |
Top |
Somatic mutation of malignant transformation related genes |
| Annotation of somatic variants for genes involved in malignant transformation |
| Hugo Symbol | Variant Class | Variant Classification | dbSNP RS | HGVSc | HGVSp | HGVSp Short | SWISSPROT | BIOTYPE | SIFT | PolyPhen | Tumor Sample Barcode | Tissue | Histology | Sex | Age | Stage | Therapy Types | Drugs | Outcome |
| EFTUD2 | SNV | Missense_Mutation | c.2869N>G | p.Met957Val | p.M957V | Q15029 | protein_coding | deleterious(0.02) | possibly_damaging(0.643) | TCGA-A7-A3RF-01 | Breast | breast invasive carcinoma | Female | >=65 | I/II | Hormone Therapy | anastrozole | PD | |
| EFTUD2 | SNV | Missense_Mutation | novel | c.2244T>A | p.Asp748Glu | p.D748E | Q15029 | protein_coding | deleterious(0.03) | probably_damaging(0.993) | TCGA-A8-A07Z-01 | Breast | breast invasive carcinoma | Female | >=65 | I/II | Unspecific | Exemestane | SD |
| EFTUD2 | SNV | Missense_Mutation | c.2103N>C | p.Glu701Asp | p.E701D | Q15029 | protein_coding | tolerated(0.07) | probably_damaging(0.994) | TCGA-AC-A23H-01 | Breast | breast invasive carcinoma | Female | >=65 | I/II | Unknown | Unknown | PD | |
| EFTUD2 | SNV | Missense_Mutation | novel | c.2882N>G | p.Leu961Arg | p.L961R | Q15029 | protein_coding | deleterious(0) | probably_damaging(0.996) | TCGA-AC-A62Y-01 | Breast | breast invasive carcinoma | Female | >=65 | I/II | Unknown | Unknown | SD |
| EFTUD2 | SNV | Missense_Mutation | novel | c.300N>T | p.Lys100Asn | p.K100N | Q15029 | protein_coding | tolerated(0.08) | benign(0.007) | TCGA-AN-A046-01 | Breast | breast invasive carcinoma | Female | >=65 | I/II | Unknown | Unknown | SD |
| EFTUD2 | SNV | Missense_Mutation | c.1555G>A | p.Glu519Lys | p.E519K | Q15029 | protein_coding | deleterious(0.01) | probably_damaging(0.981) | TCGA-B6-A0RG-01 | Breast | breast invasive carcinoma | Female | <65 | I/II | Unknown | Unknown | SD | |
| EFTUD2 | SNV | Missense_Mutation | rs765291549 | c.137G>T | p.Gly46Val | p.G46V | Q15029 | protein_coding | tolerated(0.28) | benign(0) | TCGA-BH-A0W4-01 | Breast | breast invasive carcinoma | Female | <65 | I/II | Unknown | Unknown | SD |
| EFTUD2 | SNV | Missense_Mutation | c.2755N>T | p.Arg919Cys | p.R919C | Q15029 | protein_coding | deleterious(0) | probably_damaging(0.953) | TCGA-E2-A15E-01 | Breast | breast invasive carcinoma | Female | <65 | I/II | Chemotherapy | doxorubicin | SD | |
| EFTUD2 | SNV | Missense_Mutation | c.2188N>T | p.Arg730Cys | p.R730C | Q15029 | protein_coding | deleterious(0) | probably_damaging(0.993) | TCGA-LL-A8F5-01 | Breast | breast invasive carcinoma | Female | <65 | I/II | Chemotherapy | cyclophosphamide | SD | |
| EFTUD2 | insertion | Frame_Shift_Ins | novel | c.2149_2150insGGGGAACCAGGGAGGGCCCCCTCTGTGA | p.Phe717TrpfsTer31 | p.F717Wfs*31 | Q15029 | protein_coding | TCGA-A7-A0CJ-01 | Breast | breast invasive carcinoma | Female | <65 | I/II | Chemotherapy | cytoxan | SD |
| Page: 1 2 3 4 5 6 7 8 9 10 11 12 |
Top |
Related drugs of malignant transformation related genes |
| Identification of chemicals and drugs interact with genes involved in malignant transfromation |
| (DGIdb 4.0) |
| Entrez ID | Symbol | Category | Interaction Types | Drug Claim Name | Drug Name | PMIDs |
| Page: 1 |

Copyright 2023-Present -The University of Texas Health Science Center at Houston |