
|
|||||
|
 | |
| |
| |
| |
| |
| |
|
Gene: EFNB2 |
Gene summary for EFNB2 |
| Gene information | Species | Human | Gene symbol | EFNB2 | Gene ID | 1948 |
| Gene name | ephrin B2 | |
| Gene Alias | EPLG5 | |
| Cytomap | 13q33.3 | |
| Gene Type | protein-coding | GO ID | GO:0000902 | UniProtAcc | P52799 |
Top |
Malignant transformation analysis |
| Identification of the aberrant gene expression in precancerous and cancerous lesions by comparing the gene expression of stem-like cells in diseased tissues with normal stem cells |
| Entrez ID | Symbol | Replicates | Species | Organ | Tissue | Adj P-value | Log2FC | Malignancy |
| 1948 | EFNB2 | HTA11_3410_2000001011 | Human | Colorectum | AD | 3.66e-09 | -4.58e-01 | 0.0155 |
| 1948 | EFNB2 | HTA11_347_2000001011 | Human | Colorectum | AD | 1.79e-02 | 3.08e-01 | -0.1954 |
| 1948 | EFNB2 | HTA11_866_3004761011 | Human | Colorectum | AD | 4.47e-04 | -4.09e-01 | 0.096 |
| 1948 | EFNB2 | HTA11_99999970781_79442 | Human | Colorectum | MSS | 4.15e-04 | -3.86e-01 | 0.294 |
| 1948 | EFNB2 | HTA11_99999973899_84307 | Human | Colorectum | MSS | 9.24e-03 | -5.06e-01 | 0.2585 |
| 1948 | EFNB2 | HTA11_99999974143_84620 | Human | Colorectum | MSS | 1.42e-18 | -5.65e-01 | 0.3005 |
| 1948 | EFNB2 | A002-C-010 | Human | Colorectum | FAP | 4.77e-03 | -2.37e-01 | 0.242 |
| 1948 | EFNB2 | A001-C-207 | Human | Colorectum | FAP | 7.15e-03 | -2.58e-01 | 0.1278 |
| 1948 | EFNB2 | A015-C-203 | Human | Colorectum | FAP | 2.20e-22 | -4.29e-01 | -0.1294 |
| 1948 | EFNB2 | A015-C-204 | Human | Colorectum | FAP | 5.68e-03 | -1.78e-01 | -0.0228 |
| 1948 | EFNB2 | A014-C-040 | Human | Colorectum | FAP | 5.03e-04 | -5.42e-01 | -0.1184 |
| 1948 | EFNB2 | A002-C-201 | Human | Colorectum | FAP | 7.56e-10 | -3.59e-01 | 0.0324 |
| 1948 | EFNB2 | A002-C-203 | Human | Colorectum | FAP | 5.86e-08 | -3.21e-01 | 0.2786 |
| 1948 | EFNB2 | A001-C-119 | Human | Colorectum | FAP | 1.14e-07 | -4.34e-01 | -0.1557 |
| 1948 | EFNB2 | A001-C-108 | Human | Colorectum | FAP | 2.88e-15 | -3.93e-01 | -0.0272 |
| 1948 | EFNB2 | A002-C-205 | Human | Colorectum | FAP | 1.07e-19 | -5.08e-01 | -0.1236 |
| 1948 | EFNB2 | A001-C-104 | Human | Colorectum | FAP | 2.38e-06 | -3.67e-01 | 0.0184 |
| 1948 | EFNB2 | A015-C-005 | Human | Colorectum | FAP | 4.01e-05 | -3.64e-01 | -0.0336 |
| 1948 | EFNB2 | A015-C-006 | Human | Colorectum | FAP | 3.75e-12 | -4.91e-01 | -0.0994 |
| 1948 | EFNB2 | A015-C-106 | Human | Colorectum | FAP | 7.64e-07 | -2.35e-01 | -0.0511 |
| Page: 1 2 3 4 5 6 |
| Tissue | Expression Dynamics | Abbreviation |
| Colorectum (GSE201348) |  | FAP: Familial adenomatous polyposis |
| CRC: Colorectal cancer | ||
| Colorectum (HTA11) |  | AD: Adenomas |
| SER: Sessile serrated lesions | ||
| MSI-H: Microsatellite-high colorectal cancer | ||
| MSS: Microsatellite stable colorectal cancer | ||
| Esophagus | 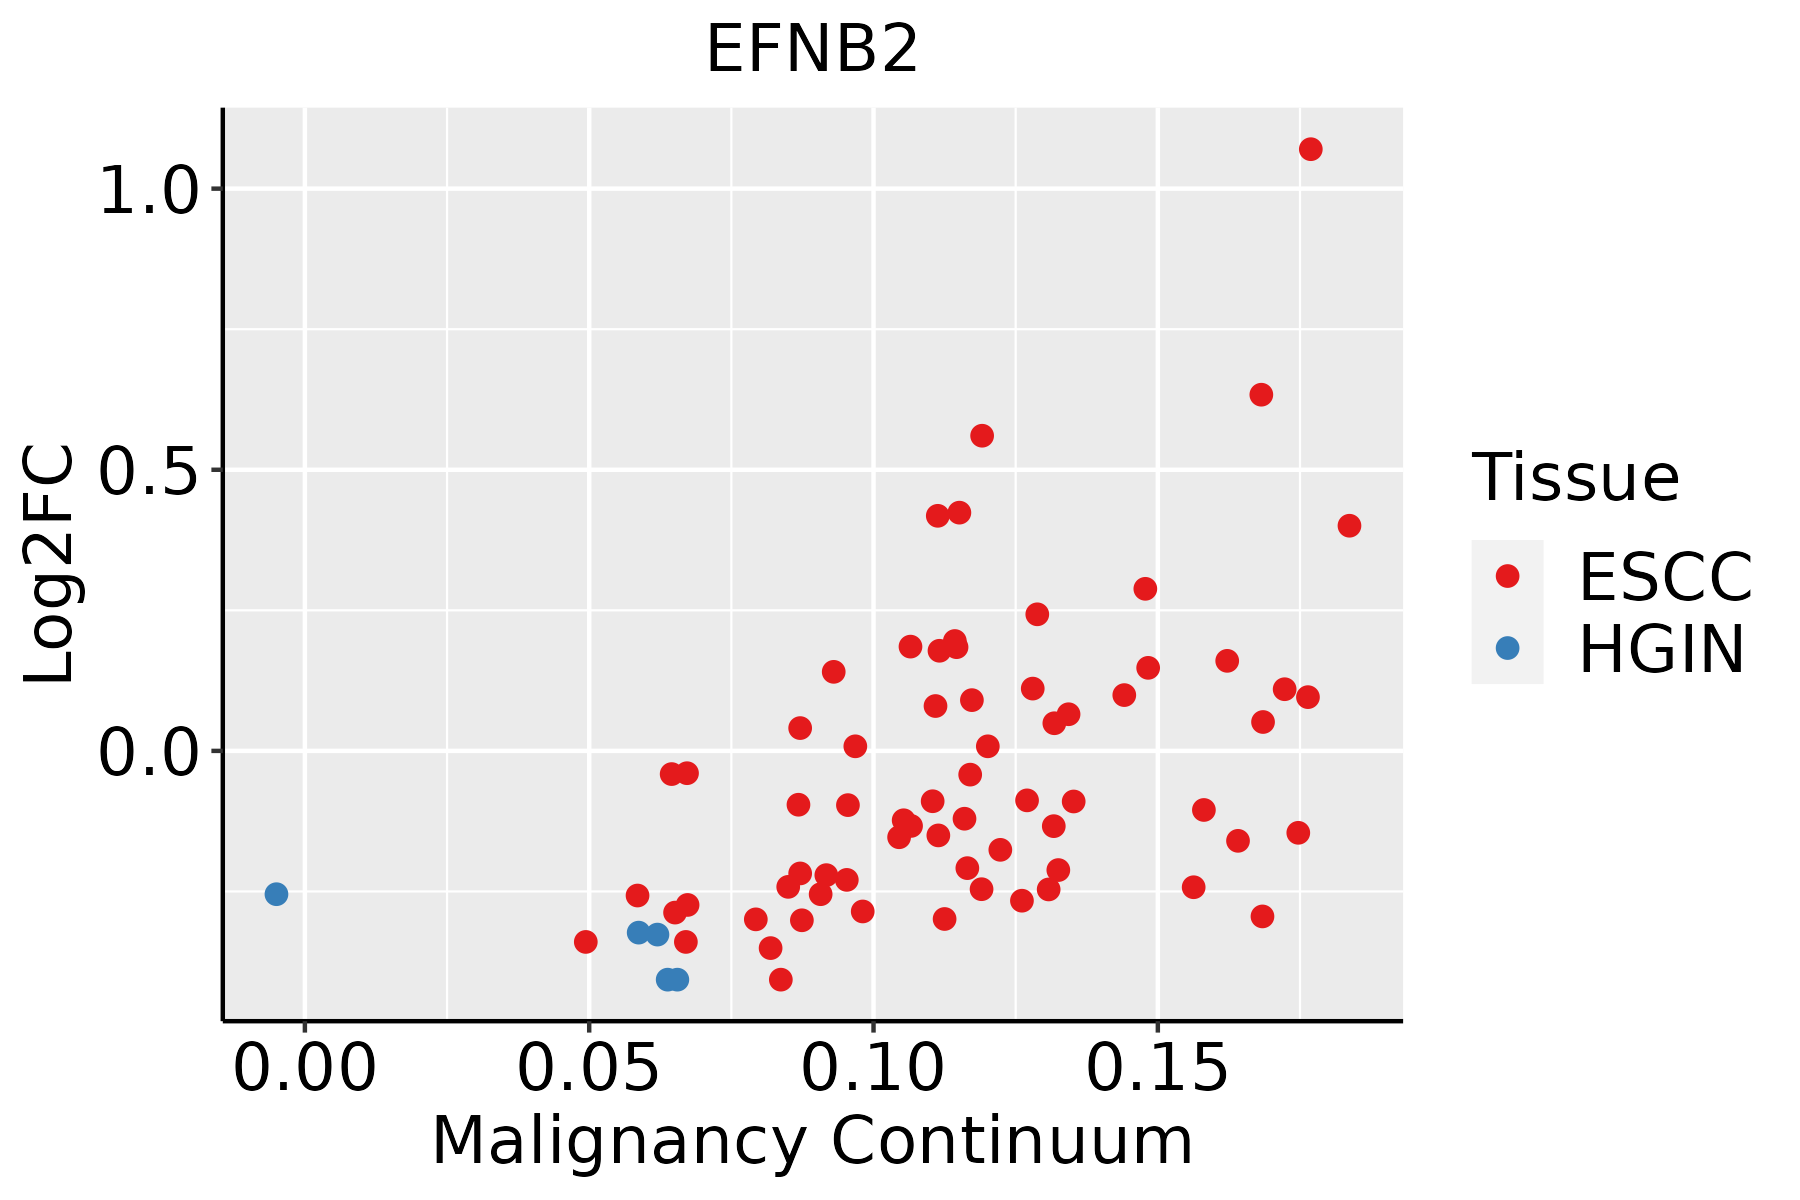 | ESCC: Esophageal squamous cell carcinoma |
| HGIN: High-grade intraepithelial neoplasias | ||
| LGIN: Low-grade intraepithelial neoplasias | ||
| Oral Cavity | 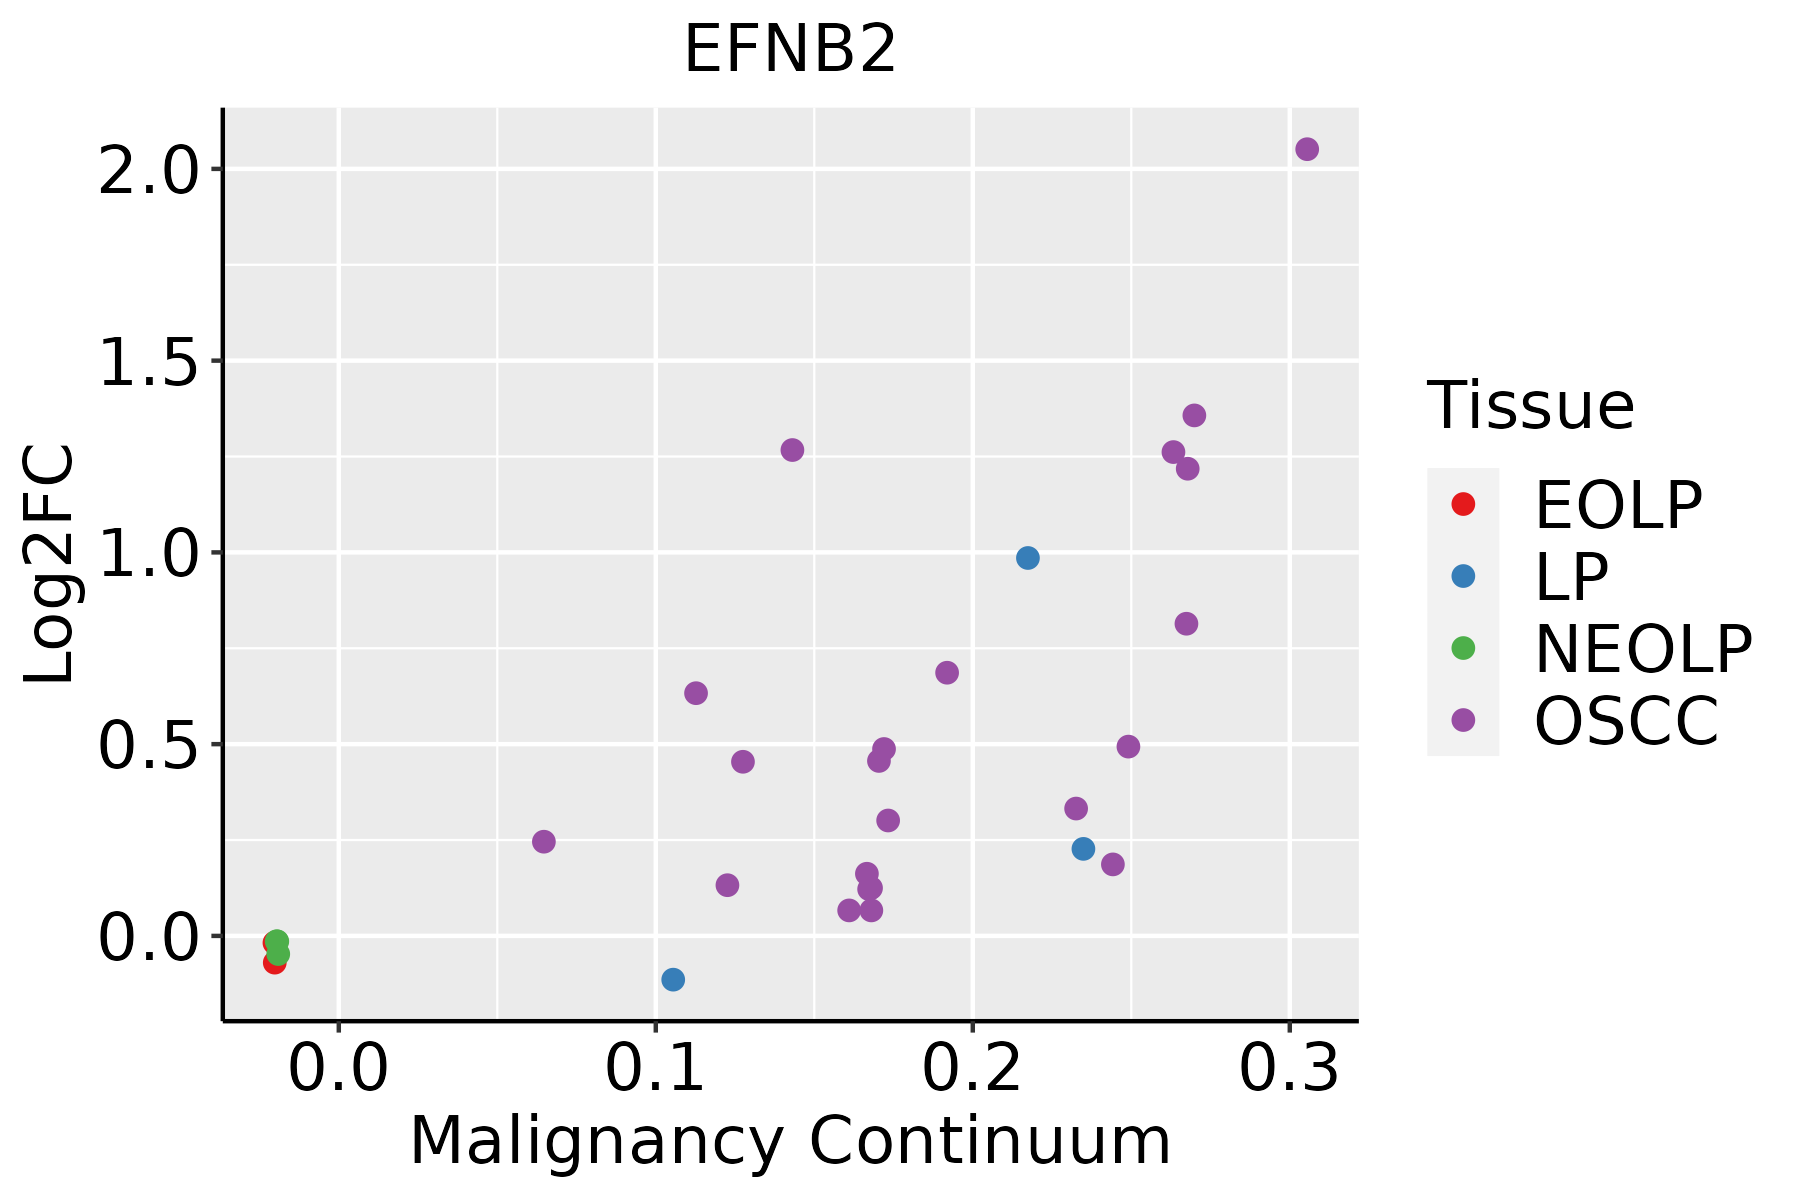 | EOLP: Erosive Oral lichen planus |
| LP: leukoplakia | ||
| NEOLP: Non-erosive oral lichen planus | ||
| OSCC: Oral squamous cell carcinoma | ||
| Prostate | 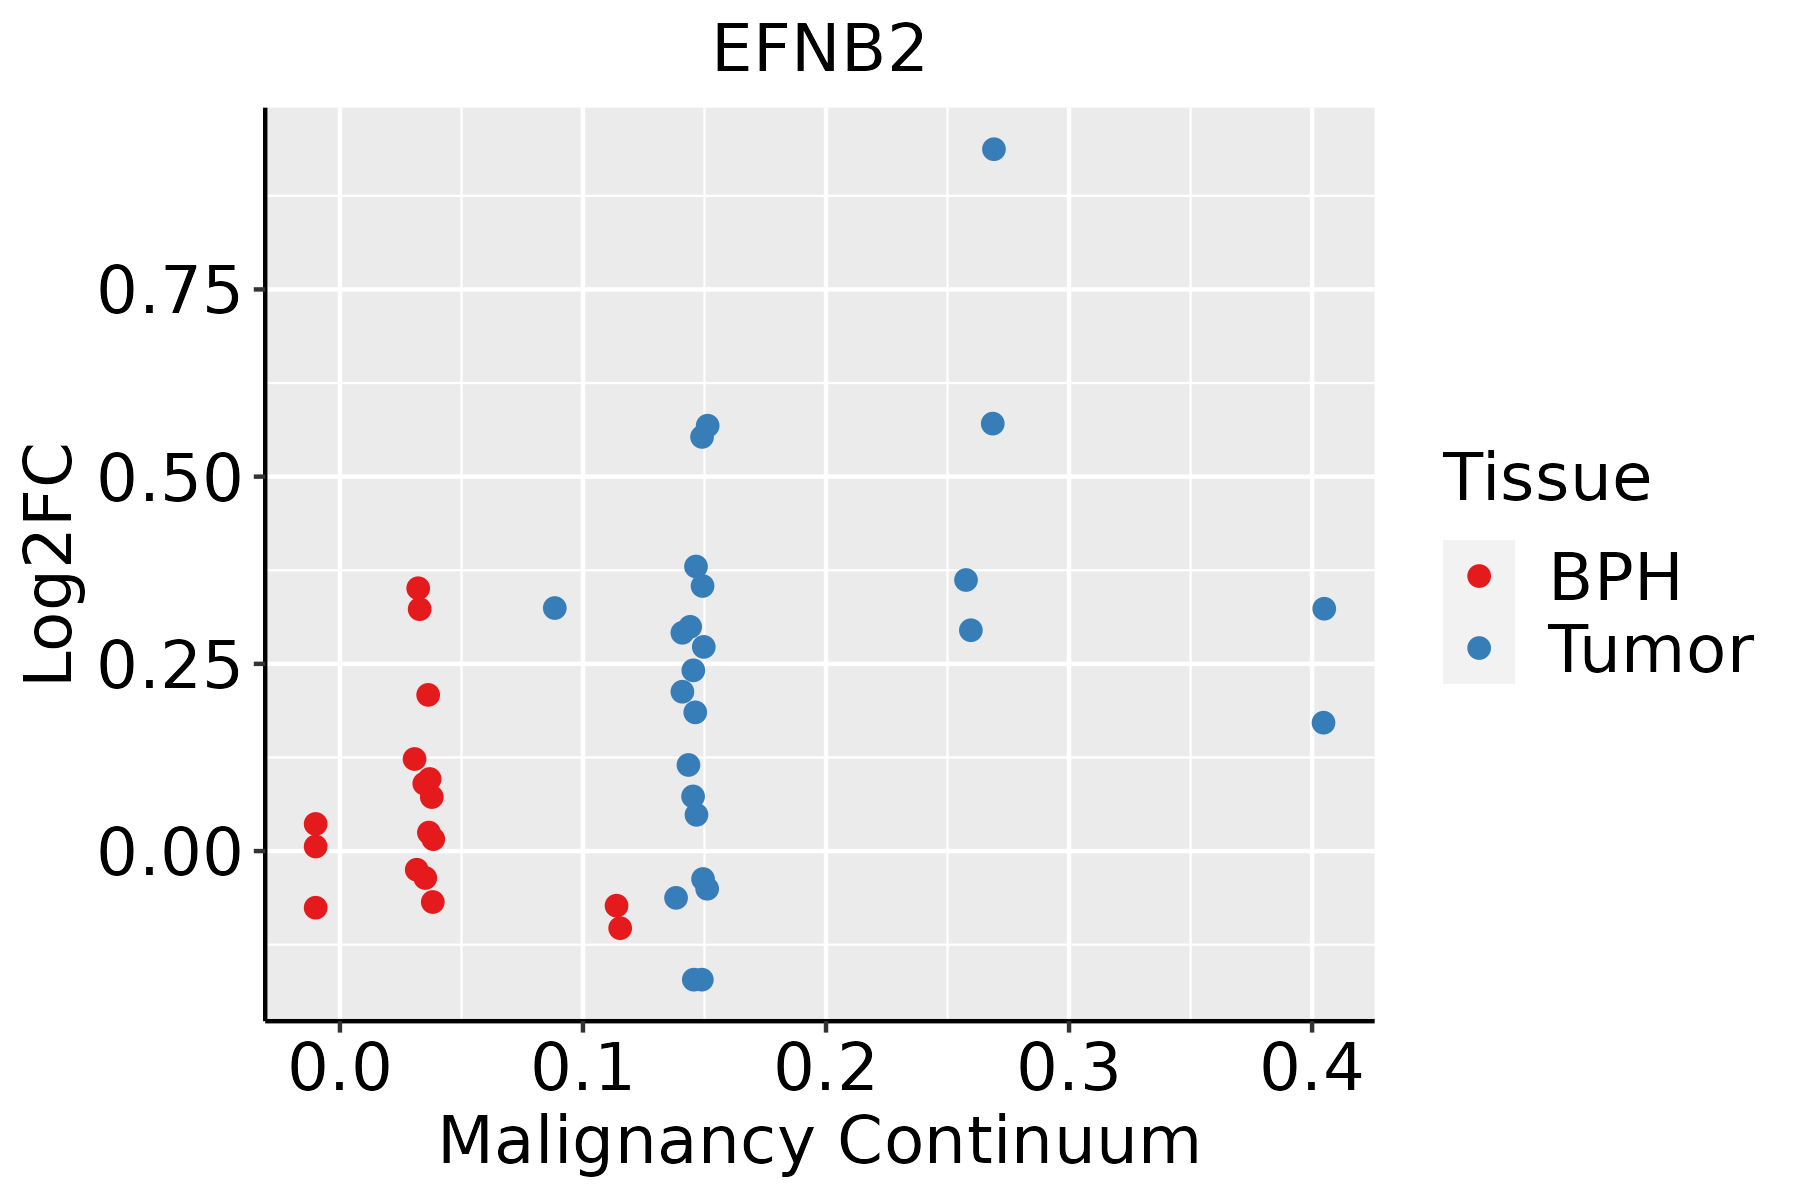 | BPH: Benign Prostatic Hyperplasia |
| Skin | 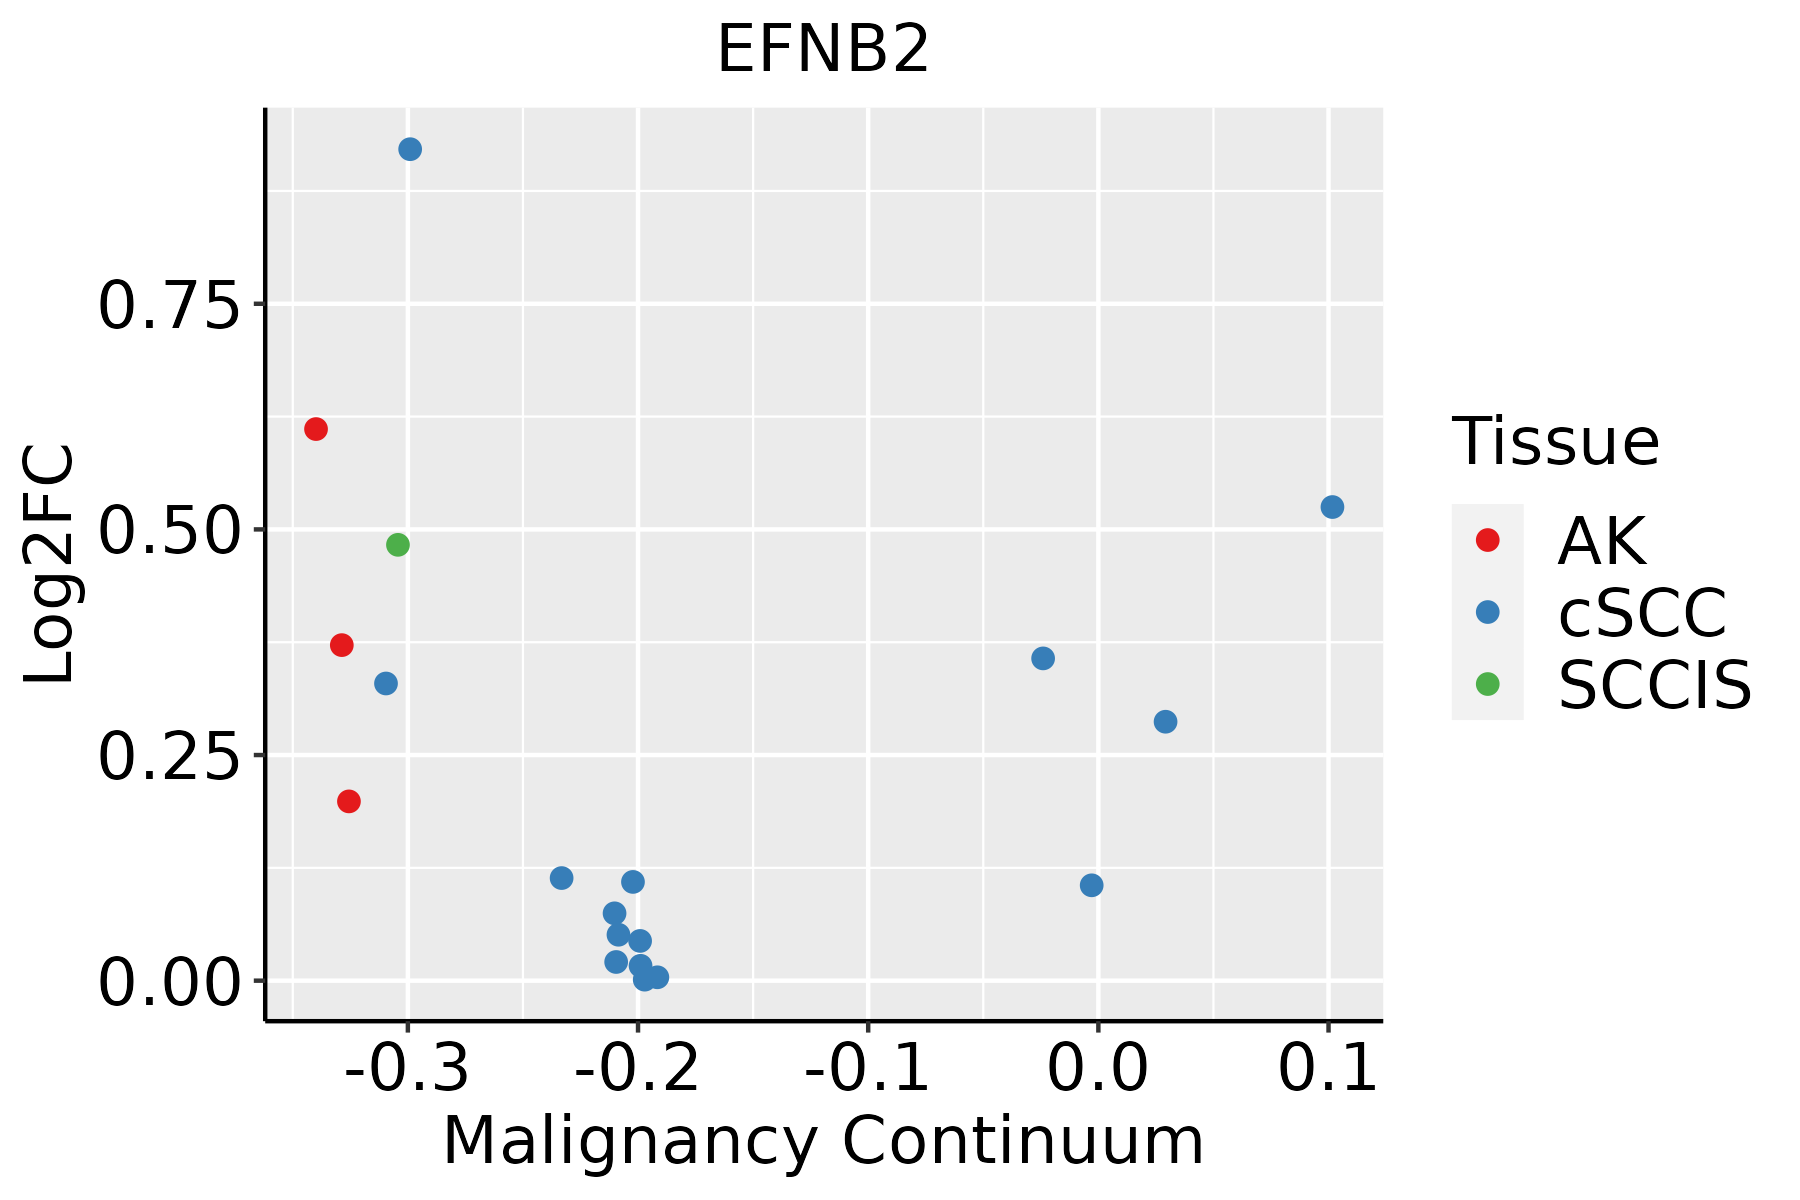 | AK: Actinic keratosis |
| cSCC: Cutaneous squamous cell carcinoma | ||
| SCCIS:squamous cell carcinoma in situ | ||
| Thyroid | 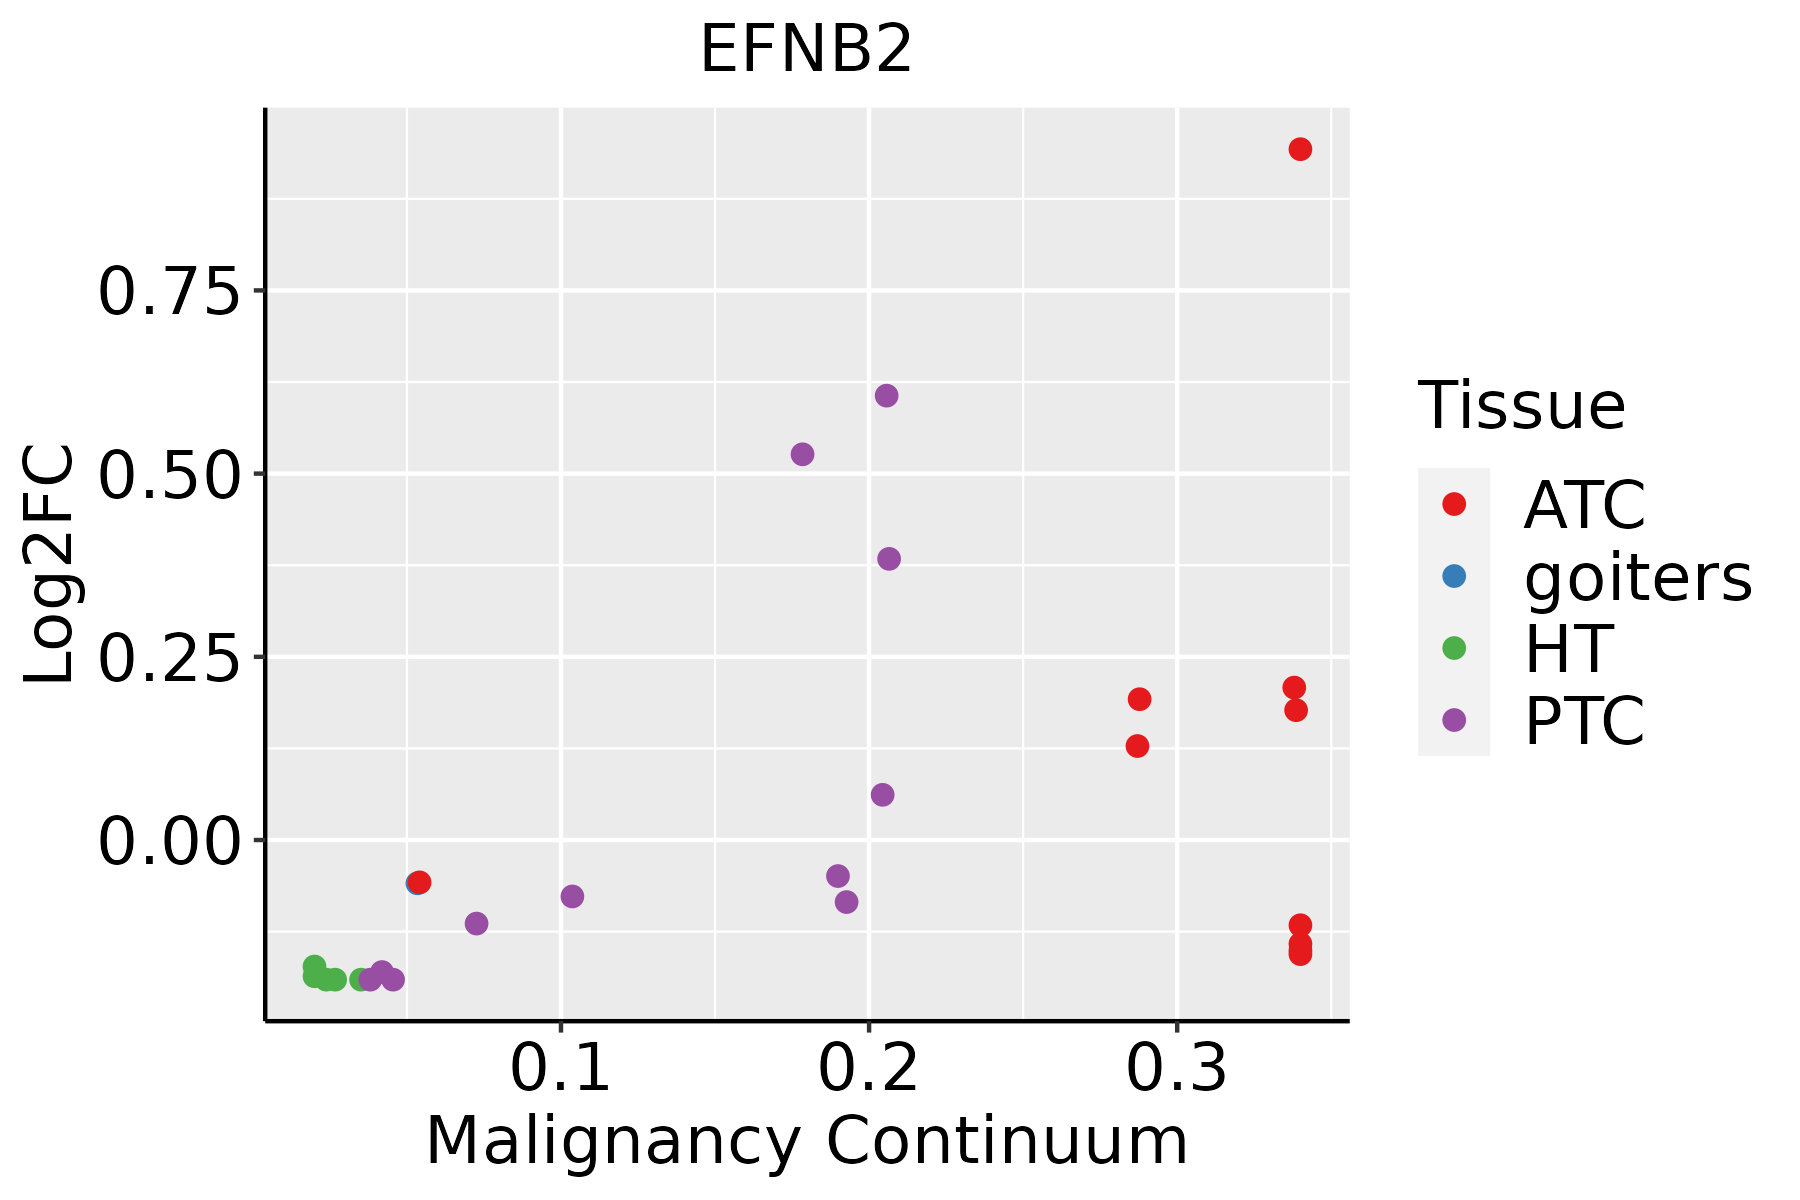 | ATC: Anaplastic thyroid cancer |
| HT: Hashimoto's thyroiditis | ||
| PTC: Papillary thyroid cancer |
| ∗log2FC in expression of this searched gene in stem-like cells from each diseased tissue sample relative to stem-like cells in normal samples in each tissue plotted against the malignancy continuum. Samples are colored based on if they are from different disease stage. |
Top |
Malignant transformation related pathway analysis |
| Find out the enriched GO biological processes and KEGG pathways involved in transition from healthy to precancer to cancer |
| Tissue | Disease Stage | Enriched GO biological Processes |
| Colorectum | AD |  |
| Colorectum | SER |  |
| Colorectum | MSS |  |
| Colorectum | MSI-H |  |
| Colorectum | FAP |  |
| ∗Top 15 enriched GO BP terms are showed in the bar plot of each disease state in each tissue. Each row represents a significant GO biological process which is colored according to the -log10(p.adjust). |
| Page: 1 2 3 4 5 6 7 8 9 |
| GO ID | Tissue | Disease Stage | Description | Gene Ratio | Bg Ratio | pvalue | p.adjust | Count |
| GO:0016032 | Colorectum | AD | viral process | 168/3918 | 415/18723 | 4.67e-20 | 3.66e-17 | 168 |
| GO:0019058 | Colorectum | AD | viral life cycle | 119/3918 | 317/18723 | 6.18e-12 | 8.23e-10 | 119 |
| GO:0034329 | Colorectum | AD | cell junction assembly | 136/3918 | 420/18723 | 2.02e-08 | 1.15e-06 | 136 |
| GO:0044403 | Colorectum | AD | biological process involved in symbiotic interaction | 99/3918 | 290/18723 | 1.02e-07 | 4.93e-06 | 99 |
| GO:0051701 | Colorectum | AD | biological process involved in interaction with host | 73/3918 | 203/18723 | 5.08e-07 | 1.88e-05 | 73 |
| GO:0070997 | Colorectum | AD | neuron death | 114/3918 | 361/18723 | 1.13e-06 | 3.72e-05 | 114 |
| GO:0052126 | Colorectum | AD | movement in host environment | 63/3918 | 175/18723 | 2.85e-06 | 8.11e-05 | 63 |
| GO:1901214 | Colorectum | AD | regulation of neuron death | 99/3918 | 319/18723 | 1.26e-05 | 2.76e-04 | 99 |
| GO:0001667 | Colorectum | AD | ameboidal-type cell migration | 137/3918 | 475/18723 | 2.17e-05 | 4.33e-04 | 137 |
| GO:0010975 | Colorectum | AD | regulation of neuron projection development | 129/3918 | 445/18723 | 2.88e-05 | 5.37e-04 | 129 |
| GO:0007409 | Colorectum | AD | axonogenesis | 122/3918 | 418/18723 | 3.36e-05 | 6.15e-04 | 122 |
| GO:0046718 | Colorectum | AD | viral entry into host cell | 51/3918 | 144/18723 | 3.99e-05 | 7.16e-04 | 51 |
| GO:0061564 | Colorectum | AD | axon development | 132/3918 | 467/18723 | 8.40e-05 | 1.31e-03 | 132 |
| GO:0090132 | Colorectum | AD | epithelium migration | 105/3918 | 360/18723 | 1.18e-04 | 1.73e-03 | 105 |
| GO:0010631 | Colorectum | AD | epithelial cell migration | 104/3918 | 357/18723 | 1.33e-04 | 1.90e-03 | 104 |
| GO:0044409 | Colorectum | AD | entry into host | 51/3918 | 151/18723 | 1.60e-04 | 2.21e-03 | 51 |
| GO:0090130 | Colorectum | AD | tissue migration | 105/3918 | 365/18723 | 2.10e-04 | 2.77e-03 | 105 |
| GO:0031345 | Colorectum | AD | negative regulation of cell projection organization | 58/3918 | 186/18723 | 6.37e-04 | 6.58e-03 | 58 |
| GO:0010977 | Colorectum | AD | negative regulation of neuron projection development | 43/3918 | 137/18723 | 2.60e-03 | 1.97e-02 | 43 |
| GO:0043542 | Colorectum | AD | endothelial cell migration | 78/3918 | 279/18723 | 2.97e-03 | 2.22e-02 | 78 |
| Page: 1 2 3 4 5 6 7 8 9 10 11 12 13 14 15 16 |
| Pathway ID | Tissue | Disease Stage | Description | Gene Ratio | Bg Ratio | pvalue | p.adjust | qvalue | Count |
| hsa04360 | Colorectum | AD | Axon guidance | 61/2092 | 182/8465 | 4.36e-03 | 2.17e-02 | 1.38e-02 | 61 |
| hsa043601 | Colorectum | AD | Axon guidance | 61/2092 | 182/8465 | 4.36e-03 | 2.17e-02 | 1.38e-02 | 61 |
| hsa043602 | Colorectum | MSS | Axon guidance | 54/1875 | 182/8465 | 1.03e-02 | 3.69e-02 | 2.26e-02 | 54 |
| hsa043603 | Colorectum | MSS | Axon guidance | 54/1875 | 182/8465 | 1.03e-02 | 3.69e-02 | 2.26e-02 | 54 |
| hsa043604 | Colorectum | FAP | Axon guidance | 47/1404 | 182/8465 | 9.09e-04 | 5.20e-03 | 3.16e-03 | 47 |
| hsa043605 | Colorectum | FAP | Axon guidance | 47/1404 | 182/8465 | 9.09e-04 | 5.20e-03 | 3.16e-03 | 47 |
| hsa043606 | Colorectum | CRC | Axon guidance | 43/1091 | 182/8465 | 4.38e-05 | 8.70e-04 | 5.90e-04 | 43 |
| hsa043607 | Colorectum | CRC | Axon guidance | 43/1091 | 182/8465 | 4.38e-05 | 8.70e-04 | 5.90e-04 | 43 |
| hsa0436016 | Esophagus | ESCC | Axon guidance | 108/4205 | 182/8465 | 5.13e-03 | 1.30e-02 | 6.67e-03 | 108 |
| hsa0436017 | Esophagus | ESCC | Axon guidance | 108/4205 | 182/8465 | 5.13e-03 | 1.30e-02 | 6.67e-03 | 108 |
| hsa0436014 | Oral cavity | OSCC | Axon guidance | 97/3704 | 182/8465 | 5.59e-03 | 1.33e-02 | 6.76e-03 | 97 |
| hsa0436015 | Oral cavity | OSCC | Axon guidance | 97/3704 | 182/8465 | 5.59e-03 | 1.33e-02 | 6.76e-03 | 97 |
| Page: 1 |
Top |
Cell-cell communication analysis |
| Identification of potential cell-cell interactions between two cell types and their ligand-receptor pairs for different disease states |
| Ligand | Receptor | LRpair | Pathway | Tissue | Disease Stage |
| EFNB2 | EPHB1 | EFNB2_EPHB1 | EPHB | Breast | DCIS |
| EFNB2 | EPHB1 | EFNB2_EPHB1 | EPHB | Breast | Healthy |
| EFNB2 | EPHA4 | EFNB2_EPHA4 | EPHB | Cervix | CC |
| EFNB2 | EPHB2 | EFNB2_EPHB2 | EPHB | Cervix | CC |
| EFNB2 | EPHA4 | EFNB2_EPHA4 | EPHB | CRC | AD |
| EFNB2 | EPHB2 | EFNB2_EPHB2 | EPHB | CRC | AD |
| EFNB2 | EPHA4 | EFNB2_EPHA4 | EPHB | CRC | ADJ |
| EFNB2 | EPHB2 | EFNB2_EPHB2 | EPHB | CRC | ADJ |
| EFNB2 | EPHB2 | EFNB2_EPHB2 | EPHB | CRC | CRC |
| EFNB2 | EPHA4 | EFNB2_EPHA4 | EPHB | CRC | FAP |
| EFNB2 | EPHB2 | EFNB2_EPHB2 | EPHB | CRC | FAP |
| EFNB2 | EPHA4 | EFNB2_EPHA4 | EPHB | CRC | Healthy |
| EFNB2 | EPHB2 | EFNB2_EPHB2 | EPHB | CRC | Healthy |
| EFNB2 | EPHA4 | EFNB2_EPHA4 | EPHB | CRC | MSI-H |
| EFNB2 | EPHB2 | EFNB2_EPHB2 | EPHB | CRC | MSI-H |
| EFNB2 | EPHB3 | EFNB2_EPHB3 | EPHB | CRC | MSI-H |
| EFNB2 | EPHB4 | EFNB2_EPHB4 | EPHB | CRC | MSI-H |
| EFNB2 | EPHB2 | EFNB2_EPHB2 | EPHB | CRC | MSS |
| EFNB2 | EPHB3 | EFNB2_EPHB3 | EPHB | CRC | MSS |
| EFNB2 | EPHB4 | EFNB2_EPHB4 | EPHB | CRC | MSS |
| Page: 1 2 3 4 |
Top |
Single-cell gene regulatory network inference analysis |
| Find out the significant the regulons (TFs) and the target genes of each regulon across cell types for different disease states |
| TF | Cell Type | Tissue | Disease Stage | Target Gene | RSS | Regulon Activity |
| ∗The dot plots of a searched regulon are shown for all cell subpopulations in each disease state of each tissue based on the regulon specific score inferred using pySCENIC and by calculating the average expression. |
| Page: 1 |
Top |
Somatic mutation of malignant transformation related genes |
| Annotation of somatic variants for genes involved in malignant transformation |
| Hugo Symbol | Variant Class | Variant Classification | dbSNP RS | HGVSc | HGVSp | HGVSp Short | SWISSPROT | BIOTYPE | SIFT | PolyPhen | Tumor Sample Barcode | Tissue | Histology | Sex | Age | Stage | Therapy Types | Drugs | Outcome |
| EFNB2 | SNV | Missense_Mutation | c.932A>G | p.Tyr311Cys | p.Y311C | P52799 | protein_coding | deleterious(0) | probably_damaging(0.999) | TCGA-A8-A09Z-01 | Breast | breast invasive carcinoma | Female | >=65 | I/II | Unknown | Unknown | SD | |
| EFNB2 | SNV | Missense_Mutation | c.782N>T | p.Pro261Leu | p.P261L | P52799 | protein_coding | tolerated(0.09) | benign(0.312) | TCGA-AR-A24O-01 | Breast | breast invasive carcinoma | Female | <65 | III/IV | Chemotherapy | cytoxan | PD | |
| EFNB2 | SNV | Missense_Mutation | c.467G>A | p.Arg156Lys | p.R156K | P52799 | protein_coding | tolerated(0.86) | benign(0.001) | TCGA-C5-A7CL-01 | Cervix | cervical & endocervical cancer | Female | <65 | III/IV | Chemotherapy | cisplatin | PD | |
| EFNB2 | SNV | Missense_Mutation | c.670N>A | p.Glu224Lys | p.E224K | P52799 | protein_coding | tolerated(1) | benign(0.007) | TCGA-VS-A9U5-01 | Cervix | cervical & endocervical cancer | Female | <65 | I/II | Chemotherapy | cisplatin | CR | |
| EFNB2 | SNV | Missense_Mutation | rs770833245 | c.895N>A | p.Val299Ile | p.V299I | P52799 | protein_coding | tolerated(0.46) | benign(0.079) | TCGA-WS-AB45-01 | Colorectum | colon adenocarcinoma | Female | <65 | I/II | Unknown | Unknown | SD |
| EFNB2 | SNV | Missense_Mutation | novel | c.586A>G | p.Thr196Ala | p.T196A | P52799 | protein_coding | tolerated(0.98) | benign(0.048) | TCGA-AG-A002-01 | Colorectum | rectum adenocarcinoma | Male | <65 | I/II | Unknown | Unknown | SD |
| EFNB2 | SNV | Missense_Mutation | novel | c.581N>T | p.Ser194Leu | p.S194L | P52799 | protein_coding | tolerated(0.07) | benign(0.027) | TCGA-EI-6917-01 | Colorectum | rectum adenocarcinoma | Male | <65 | III/IV | Chemotherapy | 5fluorouracil+oxaciplatina+l-folinian | SD |
| EFNB2 | SNV | Missense_Mutation | novel | c.91N>A | p.Glu31Lys | p.E31K | P52799 | protein_coding | deleterious(0.01) | possibly_damaging(0.671) | TCGA-A5-A0GG-01 | Endometrium | uterine corpus endometrioid carcinoma | Female | >=65 | I/II | Unknown | Unknown | SD |
| EFNB2 | SNV | Missense_Mutation | novel | c.509C>A | p.Ser170Tyr | p.S170Y | P52799 | protein_coding | tolerated(0.12) | benign(0.142) | TCGA-A5-A2K5-01 | Endometrium | uterine corpus endometrioid carcinoma | Female | >=65 | I/II | Unknown | Unknown | SD |
| EFNB2 | SNV | Missense_Mutation | c.835N>A | p.Gly279Ser | p.G279S | P52799 | protein_coding | tolerated(0.5) | benign(0.153) | TCGA-AP-A059-01 | Endometrium | uterine corpus endometrioid carcinoma | Female | >=65 | I/II | Unknown | Unknown | SD |
| Page: 1 2 3 4 |
Top |
Related drugs of malignant transformation related genes |
| Identification of chemicals and drugs interact with genes involved in malignant transfromation |
| (DGIdb 4.0) |
| Entrez ID | Symbol | Category | Interaction Types | Drug Claim Name | Drug Name | PMIDs |
| Page: 1 |

Copyright 2023-Present -The University of Texas Health Science Center at Houston |