
|
|||||
|
 | |
| |
| |
| |
| |
| |
|
Gene: EFNB1 |
Gene summary for EFNB1 |
| Gene information | Species | Human | Gene symbol | EFNB1 | Gene ID | 1947 |
| Gene name | ephrin B1 | |
| Gene Alias | CFND | |
| Cytomap | Xq13.1 | |
| Gene Type | protein-coding | GO ID | GO:0000902 | UniProtAcc | P98172 |
Top |
Malignant transformation analysis |
| Identification of the aberrant gene expression in precancerous and cancerous lesions by comparing the gene expression of stem-like cells in diseased tissues with normal stem cells |
| Entrez ID | Symbol | Replicates | Species | Organ | Tissue | Adj P-value | Log2FC | Malignancy |
| 1947 | EFNB1 | HTA11_3410_2000001011 | Human | Colorectum | AD | 1.16e-07 | 1.59e-01 | 0.0155 |
| 1947 | EFNB1 | HTA11_2487_2000001011 | Human | Colorectum | SER | 1.27e-16 | 6.37e-01 | -0.1808 |
| 1947 | EFNB1 | HTA11_1938_2000001011 | Human | Colorectum | AD | 3.79e-11 | 5.05e-01 | -0.0811 |
| 1947 | EFNB1 | HTA11_78_2000001011 | Human | Colorectum | AD | 1.28e-04 | 3.07e-01 | -0.1088 |
| 1947 | EFNB1 | HTA11_347_2000001011 | Human | Colorectum | AD | 9.33e-25 | 6.30e-01 | -0.1954 |
| 1947 | EFNB1 | HTA11_411_2000001011 | Human | Colorectum | SER | 1.68e-09 | 1.11e+00 | -0.2602 |
| 1947 | EFNB1 | HTA11_3361_2000001011 | Human | Colorectum | AD | 4.50e-03 | 2.89e-01 | -0.1207 |
| 1947 | EFNB1 | HTA11_83_2000001011 | Human | Colorectum | SER | 2.44e-07 | 4.85e-01 | -0.1526 |
| 1947 | EFNB1 | HTA11_696_2000001011 | Human | Colorectum | AD | 4.95e-18 | 5.11e-01 | -0.1464 |
| 1947 | EFNB1 | HTA11_866_2000001011 | Human | Colorectum | AD | 6.92e-08 | 2.77e-01 | -0.1001 |
| 1947 | EFNB1 | HTA11_1391_2000001011 | Human | Colorectum | AD | 7.80e-15 | 6.14e-01 | -0.059 |
| 1947 | EFNB1 | HTA11_5212_2000001011 | Human | Colorectum | AD | 6.90e-06 | 5.58e-01 | -0.2061 |
| 1947 | EFNB1 | HTA11_9341_2000001011 | Human | Colorectum | SER | 2.58e-04 | 5.50e-01 | -0.00410000000000005 |
| 1947 | EFNB1 | HTA11_7862_2000001011 | Human | Colorectum | AD | 4.51e-07 | 4.17e-01 | -0.0179 |
| 1947 | EFNB1 | HTA11_866_3004761011 | Human | Colorectum | AD | 1.59e-09 | 3.62e-01 | 0.096 |
| 1947 | EFNB1 | HTA11_7663_2000001011 | Human | Colorectum | SER | 1.84e-02 | 4.10e-01 | 0.0131 |
| 1947 | EFNB1 | HTA11_6801_2000001011 | Human | Colorectum | SER | 4.71e-05 | 4.62e-01 | 0.0171 |
| 1947 | EFNB1 | HTA11_10711_2000001011 | Human | Colorectum | AD | 1.60e-02 | 3.02e-01 | 0.0338 |
| 1947 | EFNB1 | HTA11_7696_3000711011 | Human | Colorectum | AD | 1.27e-05 | 3.28e-01 | 0.0674 |
| 1947 | EFNB1 | HTA11_6818_2000001011 | Human | Colorectum | AD | 4.38e-02 | 3.31e-01 | 0.0112 |
| Page: 1 2 3 4 5 6 |
| Tissue | Expression Dynamics | Abbreviation |
| Colorectum (GSE201348) |  | FAP: Familial adenomatous polyposis |
| CRC: Colorectal cancer | ||
| Colorectum (HTA11) |  | AD: Adenomas |
| SER: Sessile serrated lesions | ||
| MSI-H: Microsatellite-high colorectal cancer | ||
| MSS: Microsatellite stable colorectal cancer | ||
| Esophagus |  | ESCC: Esophageal squamous cell carcinoma |
| HGIN: High-grade intraepithelial neoplasias | ||
| LGIN: Low-grade intraepithelial neoplasias | ||
| Liver | 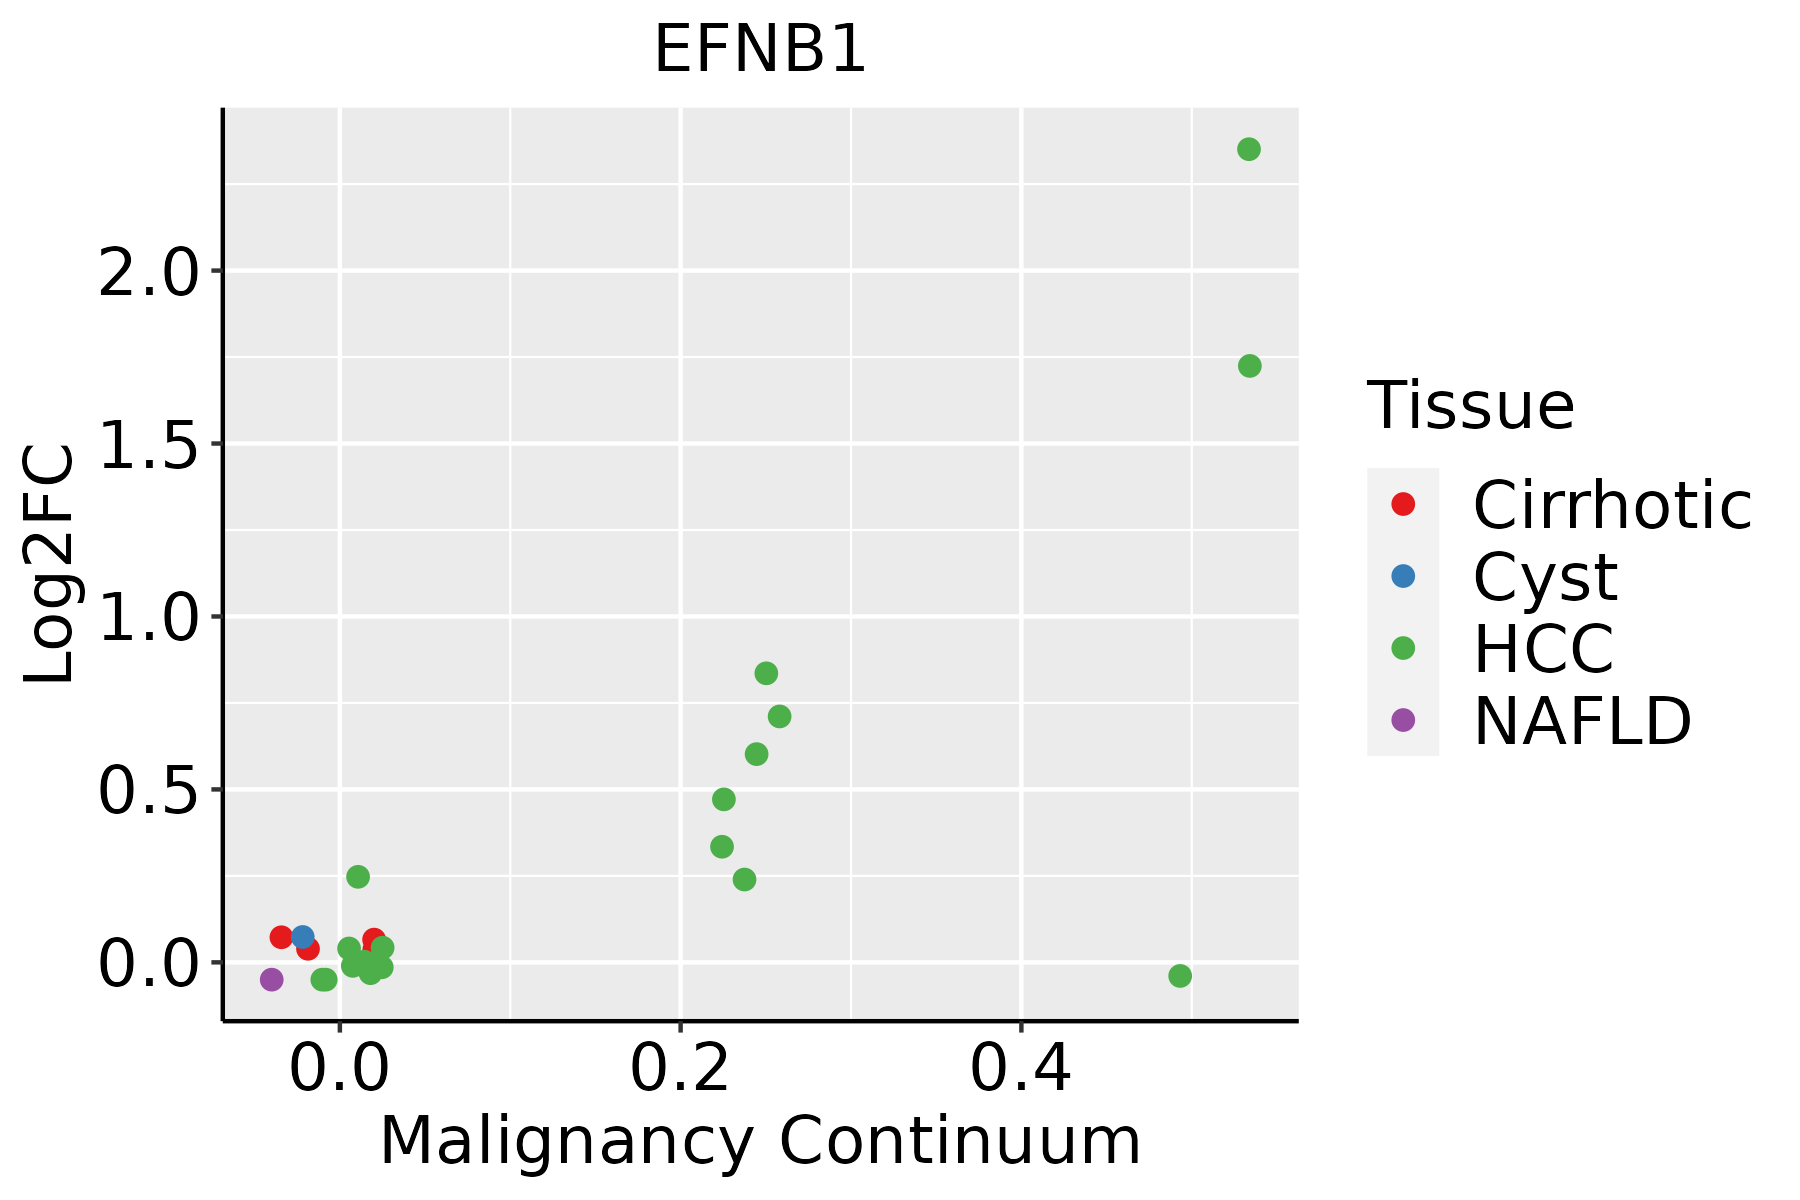 | HCC: Hepatocellular carcinoma |
| NAFLD: Non-alcoholic fatty liver disease | ||
| Oral Cavity | 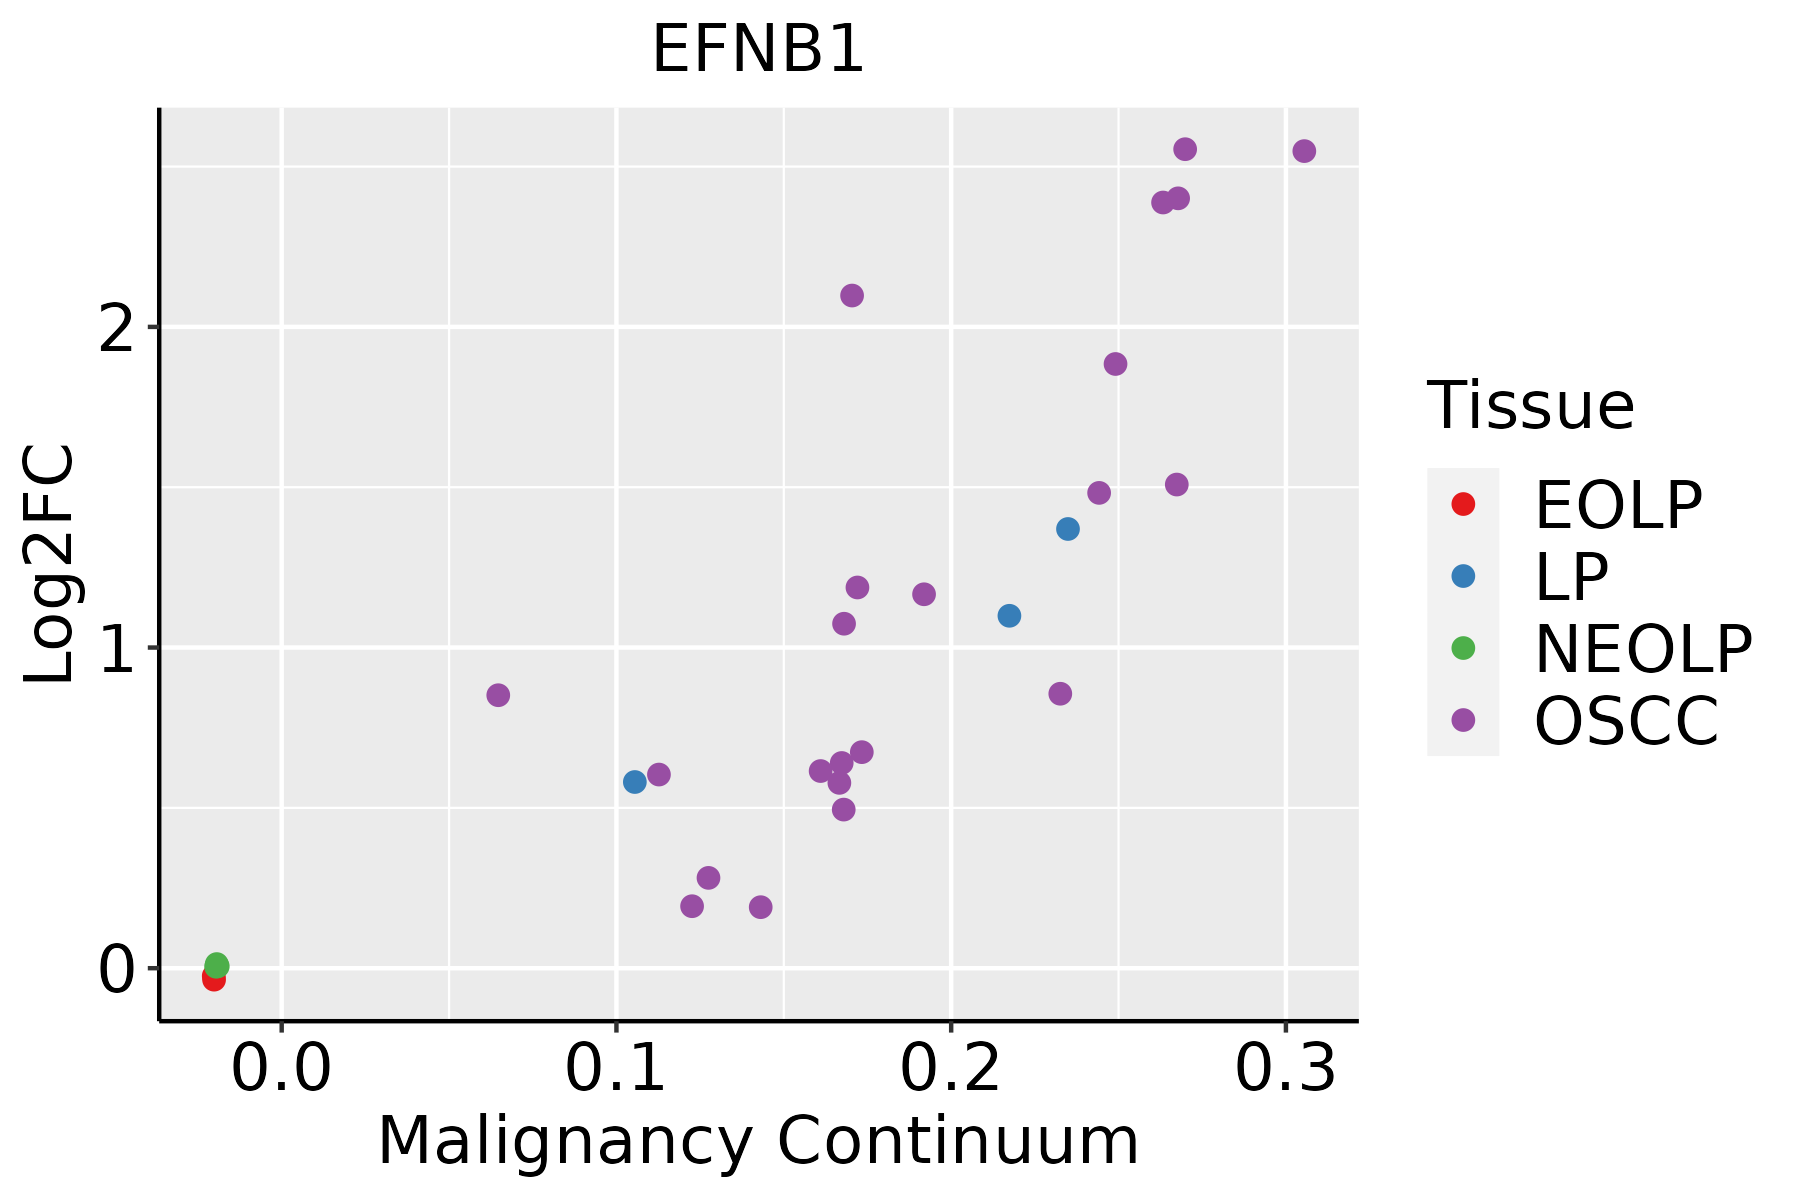 | EOLP: Erosive Oral lichen planus |
| LP: leukoplakia | ||
| NEOLP: Non-erosive oral lichen planus | ||
| OSCC: Oral squamous cell carcinoma | ||
| Skin |  | AK: Actinic keratosis |
| cSCC: Cutaneous squamous cell carcinoma | ||
| SCCIS:squamous cell carcinoma in situ |
| ∗log2FC in expression of this searched gene in stem-like cells from each diseased tissue sample relative to stem-like cells in normal samples in each tissue plotted against the malignancy continuum. Samples are colored based on if they are from different disease stage. |
Top |
Malignant transformation related pathway analysis |
| Find out the enriched GO biological processes and KEGG pathways involved in transition from healthy to precancer to cancer |
| Tissue | Disease Stage | Enriched GO biological Processes |
| Colorectum | AD |  |
| Colorectum | SER |  |
| Colorectum | MSS |  |
| Colorectum | MSI-H |  |
| Colorectum | FAP |  |
| ∗Top 15 enriched GO BP terms are showed in the bar plot of each disease state in each tissue. Each row represents a significant GO biological process which is colored according to the -log10(p.adjust). |
| Page: 1 2 3 4 5 6 7 8 9 |
| GO ID | Tissue | Disease Stage | Description | Gene Ratio | Bg Ratio | pvalue | p.adjust | Count |
| GO:0001667 | Colorectum | AD | ameboidal-type cell migration | 137/3918 | 475/18723 | 2.17e-05 | 4.33e-04 | 137 |
| GO:0007409 | Colorectum | AD | axonogenesis | 122/3918 | 418/18723 | 3.36e-05 | 6.15e-04 | 122 |
| GO:0061564 | Colorectum | AD | axon development | 132/3918 | 467/18723 | 8.40e-05 | 1.31e-03 | 132 |
| GO:0045785 | Colorectum | AD | positive regulation of cell adhesion | 122/3918 | 437/18723 | 2.65e-04 | 3.28e-03 | 122 |
| GO:0007411 | Colorectum | AD | axon guidance | 64/3918 | 227/18723 | 5.41e-03 | 3.55e-02 | 64 |
| GO:0097485 | Colorectum | AD | neuron projection guidance | 64/3918 | 228/18723 | 6.02e-03 | 3.78e-02 | 64 |
| GO:00016671 | Colorectum | SER | ameboidal-type cell migration | 105/2897 | 475/18723 | 6.97e-05 | 1.59e-03 | 105 |
| GO:00457851 | Colorectum | SER | positive regulation of cell adhesion | 93/2897 | 437/18723 | 6.78e-04 | 9.04e-03 | 93 |
| GO:00074111 | Colorectum | SER | axon guidance | 51/2897 | 227/18723 | 3.29e-03 | 2.82e-02 | 51 |
| GO:00974851 | Colorectum | SER | neuron projection guidance | 51/2897 | 228/18723 | 3.61e-03 | 3.03e-02 | 51 |
| GO:00615641 | Colorectum | SER | axon development | 94/2897 | 467/18723 | 3.78e-03 | 3.13e-02 | 94 |
| GO:00074091 | Colorectum | SER | axonogenesis | 84/2897 | 418/18723 | 6.20e-03 | 4.49e-02 | 84 |
| GO:00016672 | Colorectum | MSS | ameboidal-type cell migration | 120/3467 | 475/18723 | 1.37e-04 | 2.05e-03 | 120 |
| GO:00457852 | Colorectum | MSS | positive regulation of cell adhesion | 110/3467 | 437/18723 | 2.94e-04 | 3.87e-03 | 110 |
| GO:00074092 | Colorectum | MSS | axonogenesis | 105/3467 | 418/18723 | 4.32e-04 | 5.23e-03 | 105 |
| GO:00615642 | Colorectum | MSS | axon development | 115/3467 | 467/18723 | 5.33e-04 | 6.00e-03 | 115 |
| GO:0048762 | Colorectum | MSS | mesenchymal cell differentiation | 59/3467 | 236/18723 | 7.79e-03 | 4.84e-02 | 59 |
| GO:0048013 | Colorectum | MSS | ephrin receptor signaling pathway | 17/3467 | 51/18723 | 8.28e-03 | 4.99e-02 | 17 |
| GO:004578527 | Esophagus | ESCC | positive regulation of cell adhesion | 255/8552 | 437/18723 | 5.07e-08 | 9.11e-07 | 255 |
| GO:00488638 | Esophagus | ESCC | stem cell differentiation | 122/8552 | 206/18723 | 5.95e-05 | 4.59e-04 | 122 |
| Page: 1 2 3 |
| Pathway ID | Tissue | Disease Stage | Description | Gene Ratio | Bg Ratio | pvalue | p.adjust | qvalue | Count |
| hsa04360 | Colorectum | AD | Axon guidance | 61/2092 | 182/8465 | 4.36e-03 | 2.17e-02 | 1.38e-02 | 61 |
| hsa043601 | Colorectum | AD | Axon guidance | 61/2092 | 182/8465 | 4.36e-03 | 2.17e-02 | 1.38e-02 | 61 |
| hsa043602 | Colorectum | MSS | Axon guidance | 54/1875 | 182/8465 | 1.03e-02 | 3.69e-02 | 2.26e-02 | 54 |
| hsa043603 | Colorectum | MSS | Axon guidance | 54/1875 | 182/8465 | 1.03e-02 | 3.69e-02 | 2.26e-02 | 54 |
| hsa0436016 | Esophagus | ESCC | Axon guidance | 108/4205 | 182/8465 | 5.13e-03 | 1.30e-02 | 6.67e-03 | 108 |
| hsa0436017 | Esophagus | ESCC | Axon guidance | 108/4205 | 182/8465 | 5.13e-03 | 1.30e-02 | 6.67e-03 | 108 |
| hsa0436014 | Oral cavity | OSCC | Axon guidance | 97/3704 | 182/8465 | 5.59e-03 | 1.33e-02 | 6.76e-03 | 97 |
| hsa0436015 | Oral cavity | OSCC | Axon guidance | 97/3704 | 182/8465 | 5.59e-03 | 1.33e-02 | 6.76e-03 | 97 |
| Page: 1 |
Top |
Cell-cell communication analysis |
| Identification of potential cell-cell interactions between two cell types and their ligand-receptor pairs for different disease states |
| Ligand | Receptor | LRpair | Pathway | Tissue | Disease Stage |
| EFNB1 | EPHB1 | EFNB1_EPHB1 | EPHB | Breast | Healthy |
| EFNB1 | EPHA4 | EFNB1_EPHA4 | EPHB | Cervix | CC |
| EFNB1 | EPHB2 | EFNB1_EPHB2 | EPHB | Cervix | CC |
| EFNB1 | EPHA4 | EFNB1_EPHA4 | EPHB | CRC | AD |
| EFNB1 | EPHB2 | EFNB1_EPHB2 | EPHB | CRC | AD |
| EFNB1 | EPHB4 | EFNB1_EPHB4 | EPHB | CRC | AD |
| EFNB1 | EPHA4 | EFNB1_EPHA4 | EPHB | CRC | ADJ |
| EFNB1 | EPHB2 | EFNB1_EPHB2 | EPHB | CRC | ADJ |
| EFNB1 | EPHA4 | EFNB1_EPHA4 | EPHB | CRC | MSI-H |
| EFNB1 | EPHB2 | EFNB1_EPHB2 | EPHB | CRC | MSI-H |
| EFNB1 | EPHB3 | EFNB1_EPHB3 | EPHB | CRC | MSI-H |
| EFNB1 | EPHB4 | EFNB1_EPHB4 | EPHB | CRC | MSI-H |
| EFNB1 | EPHB2 | EFNB1_EPHB2 | EPHB | CRC | MSS |
| EFNB1 | EPHB3 | EFNB1_EPHB3 | EPHB | CRC | MSS |
| EFNB1 | EPHB4 | EFNB1_EPHB4 | EPHB | CRC | MSS |
| EFNB1 | EPHA4 | EFNB1_EPHA4 | EPHB | CRC | SER |
| EFNB1 | EPHB2 | EFNB1_EPHB2 | EPHB | CRC | SER |
| EFNB1 | EPHB3 | EFNB1_EPHB3 | EPHB | CRC | SER |
| EFNB1 | EPHB4 | EFNB1_EPHB4 | EPHB | CRC | SER |
| EFNB1 | EPHA4 | EFNB1_EPHA4 | EPHB | Endometrium | EEC |
| Page: 1 2 3 |
Top |
Single-cell gene regulatory network inference analysis |
| Find out the significant the regulons (TFs) and the target genes of each regulon across cell types for different disease states |
| TF | Cell Type | Tissue | Disease Stage | Target Gene | RSS | Regulon Activity |
| ∗The dot plots of a searched regulon are shown for all cell subpopulations in each disease state of each tissue based on the regulon specific score inferred using pySCENIC and by calculating the average expression. |
| Page: 1 |
Top |
Somatic mutation of malignant transformation related genes |
| Annotation of somatic variants for genes involved in malignant transformation |
| Hugo Symbol | Variant Class | Variant Classification | dbSNP RS | HGVSc | HGVSp | HGVSp Short | SWISSPROT | BIOTYPE | SIFT | PolyPhen | Tumor Sample Barcode | Tissue | Histology | Sex | Age | Stage | Therapy Types | Drugs | Outcome |
| EFNB1 | SNV | Missense_Mutation | rs754504608 | c.796C>T | p.Arg266Cys | p.R266C | P98172 | protein_coding | deleterious(0) | probably_damaging(0.994) | TCGA-A2-A04R-01 | Breast | breast invasive carcinoma | Female | <65 | I/II | Chemotherapy | taxol | SD |
| EFNB1 | SNV | Missense_Mutation | novel | c.497N>G | p.Gln166Arg | p.Q166R | P98172 | protein_coding | deleterious(0.01) | possibly_damaging(0.726) | TCGA-A6-5665-01 | Colorectum | colon adenocarcinoma | Female | >=65 | I/II | Unknown | Unknown | PD |
| EFNB1 | SNV | Missense_Mutation | rs367996552 | c.211N>T | p.Arg71Trp | p.R71W | P98172 | protein_coding | deleterious(0.01) | possibly_damaging(0.828) | TCGA-AA-3672-01 | Colorectum | colon adenocarcinoma | Female | >=65 | III/IV | Unknown | Unknown | SD |
| EFNB1 | SNV | Missense_Mutation | rs767055938 | c.212N>A | p.Arg71Gln | p.R71Q | P98172 | protein_coding | tolerated(0.46) | benign(0.024) | TCGA-AA-3864-01 | Colorectum | colon adenocarcinoma | Male | >=65 | I/II | Unknown | Unknown | SD |
| EFNB1 | SNV | Missense_Mutation | c.575N>T | p.Ala192Val | p.A192V | P98172 | protein_coding | tolerated(0.42) | benign(0) | TCGA-AA-A010-01 | Colorectum | colon adenocarcinoma | Female | <65 | I/II | Chemotherapy | folinic | CR | |
| EFNB1 | SNV | Missense_Mutation | novel | c.758N>A | p.Leu253His | p.L253H | P98172 | protein_coding | deleterious(0) | probably_damaging(0.997) | TCGA-AM-5820-01 | Colorectum | colon adenocarcinoma | Female | <65 | I/II | Unknown | Unknown | SD |
| EFNB1 | SNV | Missense_Mutation | c.920N>A | p.Arg307Gln | p.R307Q | P98172 | protein_coding | deleterious(0) | probably_damaging(0.996) | TCGA-AY-5543-01 | Colorectum | colon adenocarcinoma | Female | >=65 | I/II | Chemotherapy | oxaliplatin | SD | |
| EFNB1 | insertion | In_Frame_Ins | novel | c.756_757insGTT | p.Leu252_Leu253insVal | p.L252_L253insV | P98172 | protein_coding | TCGA-AM-5820-01 | Colorectum | colon adenocarcinoma | Female | <65 | I/II | Unknown | Unknown | SD | ||
| EFNB1 | deletion | Frame_Shift_Del | c.872delG | p.Gly291AlafsTer30 | p.G291Afs*30 | P98172 | protein_coding | TCGA-G4-6586-01 | Colorectum | colon adenocarcinoma | Female | >=65 | I/II | Unknown | Unknown | SD | |||
| EFNB1 | deletion | Frame_Shift_Del | c.707_714delNNNNNNNN | p.Ser236CysfsTer80 | p.S236Cfs*80 | P98172 | protein_coding | TCGA-G4-6628-01 | Colorectum | colon adenocarcinoma | Male | >=65 | I/II | Unknown | Unknown | SD |
| Page: 1 2 3 4 5 |
Top |
Related drugs of malignant transformation related genes |
| Identification of chemicals and drugs interact with genes involved in malignant transfromation |
| (DGIdb 4.0) |
| Entrez ID | Symbol | Category | Interaction Types | Drug Claim Name | Drug Name | PMIDs |
| Page: 1 |

Copyright 2023-Present -The University of Texas Health Science Center at Houston |