
|
|||||
|
 | |
| |
| |
| |
| |
| |
|
Gene: EFNA4 |
Gene summary for EFNA4 |
| Gene information | Species | Human | Gene symbol | EFNA4 | Gene ID | 1945 |
| Gene name | ephrin A4 | |
| Gene Alias | EFL4 | |
| Cytomap | 1q21.3 | |
| Gene Type | protein-coding | GO ID | GO:0000902 | UniProtAcc | P52798 |
Top |
Malignant transformation analysis |
| Identification of the aberrant gene expression in precancerous and cancerous lesions by comparing the gene expression of stem-like cells in diseased tissues with normal stem cells |
| Entrez ID | Symbol | Replicates | Species | Organ | Tissue | Adj P-value | Log2FC | Malignancy |
| 1945 | EFNA4 | LZE4T | Human | Esophagus | ESCC | 7.81e-08 | 2.29e-01 | 0.0811 |
| 1945 | EFNA4 | LZE7T | Human | Esophagus | ESCC | 2.42e-06 | 3.61e-01 | 0.0667 |
| 1945 | EFNA4 | LZE8T | Human | Esophagus | ESCC | 1.77e-02 | 1.67e-01 | 0.067 |
| 1945 | EFNA4 | LZE20T | Human | Esophagus | ESCC | 5.83e-03 | 1.75e-01 | 0.0662 |
| 1945 | EFNA4 | LZE22T | Human | Esophagus | ESCC | 1.66e-06 | 4.43e-01 | 0.068 |
| 1945 | EFNA4 | LZE24T | Human | Esophagus | ESCC | 2.69e-11 | 2.88e-01 | 0.0596 |
| 1945 | EFNA4 | LZE6T | Human | Esophagus | ESCC | 2.02e-03 | 2.88e-01 | 0.0845 |
| 1945 | EFNA4 | P1T-E | Human | Esophagus | ESCC | 5.09e-05 | 3.08e-01 | 0.0875 |
| 1945 | EFNA4 | P2T-E | Human | Esophagus | ESCC | 4.35e-35 | 6.60e-01 | 0.1177 |
| 1945 | EFNA4 | P4T-E | Human | Esophagus | ESCC | 3.03e-23 | 5.37e-01 | 0.1323 |
| 1945 | EFNA4 | P5T-E | Human | Esophagus | ESCC | 3.74e-12 | 3.06e-01 | 0.1327 |
| 1945 | EFNA4 | P8T-E | Human | Esophagus | ESCC | 1.60e-05 | 1.26e-01 | 0.0889 |
| 1945 | EFNA4 | P9T-E | Human | Esophagus | ESCC | 5.17e-13 | 3.04e-01 | 0.1131 |
| 1945 | EFNA4 | P10T-E | Human | Esophagus | ESCC | 1.35e-21 | 4.46e-01 | 0.116 |
| 1945 | EFNA4 | P11T-E | Human | Esophagus | ESCC | 4.08e-11 | 3.67e-01 | 0.1426 |
| 1945 | EFNA4 | P12T-E | Human | Esophagus | ESCC | 1.16e-14 | 3.45e-01 | 0.1122 |
| 1945 | EFNA4 | P15T-E | Human | Esophagus | ESCC | 2.72e-33 | 6.48e-01 | 0.1149 |
| 1945 | EFNA4 | P16T-E | Human | Esophagus | ESCC | 2.09e-32 | 5.79e-01 | 0.1153 |
| 1945 | EFNA4 | P17T-E | Human | Esophagus | ESCC | 2.06e-06 | 2.92e-01 | 0.1278 |
| 1945 | EFNA4 | P20T-E | Human | Esophagus | ESCC | 2.69e-22 | 4.46e-01 | 0.1124 |
| Page: 1 2 3 4 5 |
| Tissue | Expression Dynamics | Abbreviation |
| Esophagus | 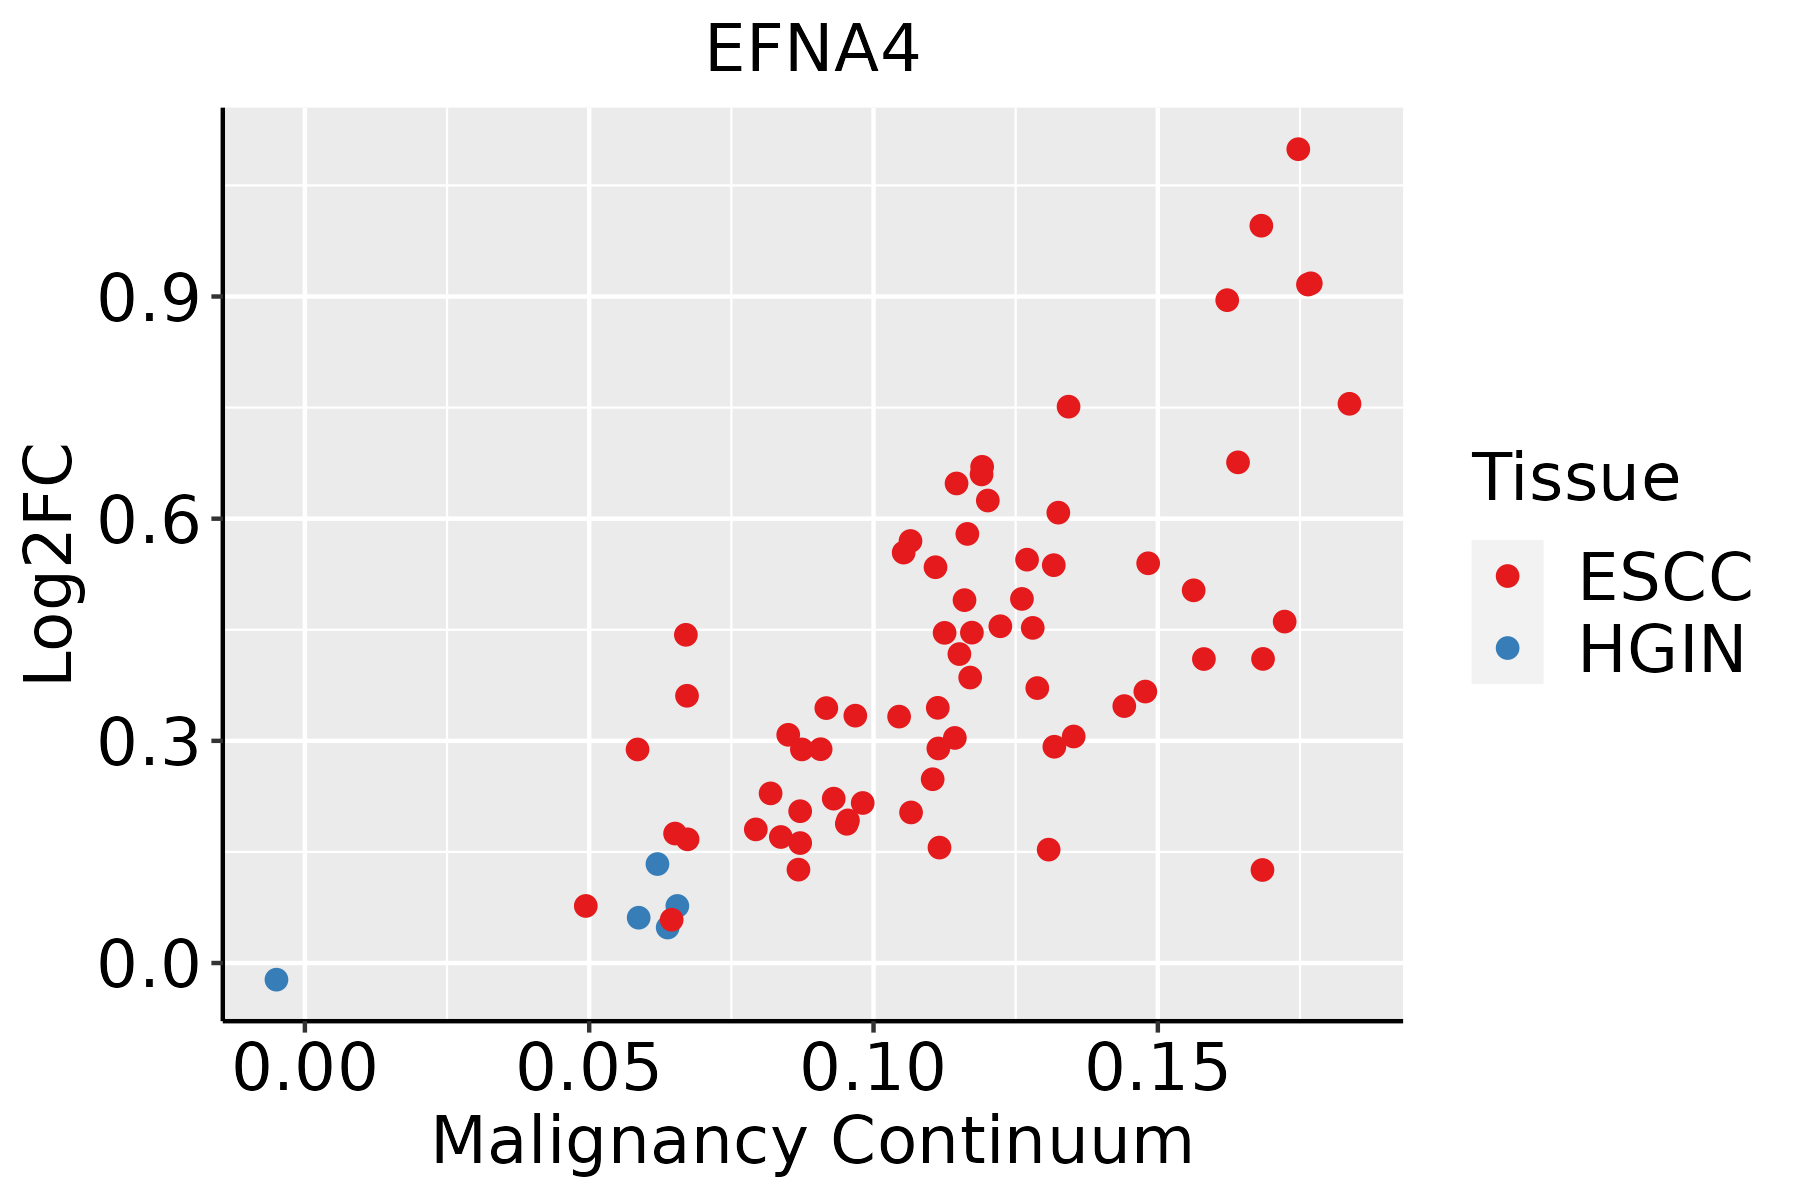 | ESCC: Esophageal squamous cell carcinoma |
| HGIN: High-grade intraepithelial neoplasias | ||
| LGIN: Low-grade intraepithelial neoplasias | ||
| Oral Cavity | 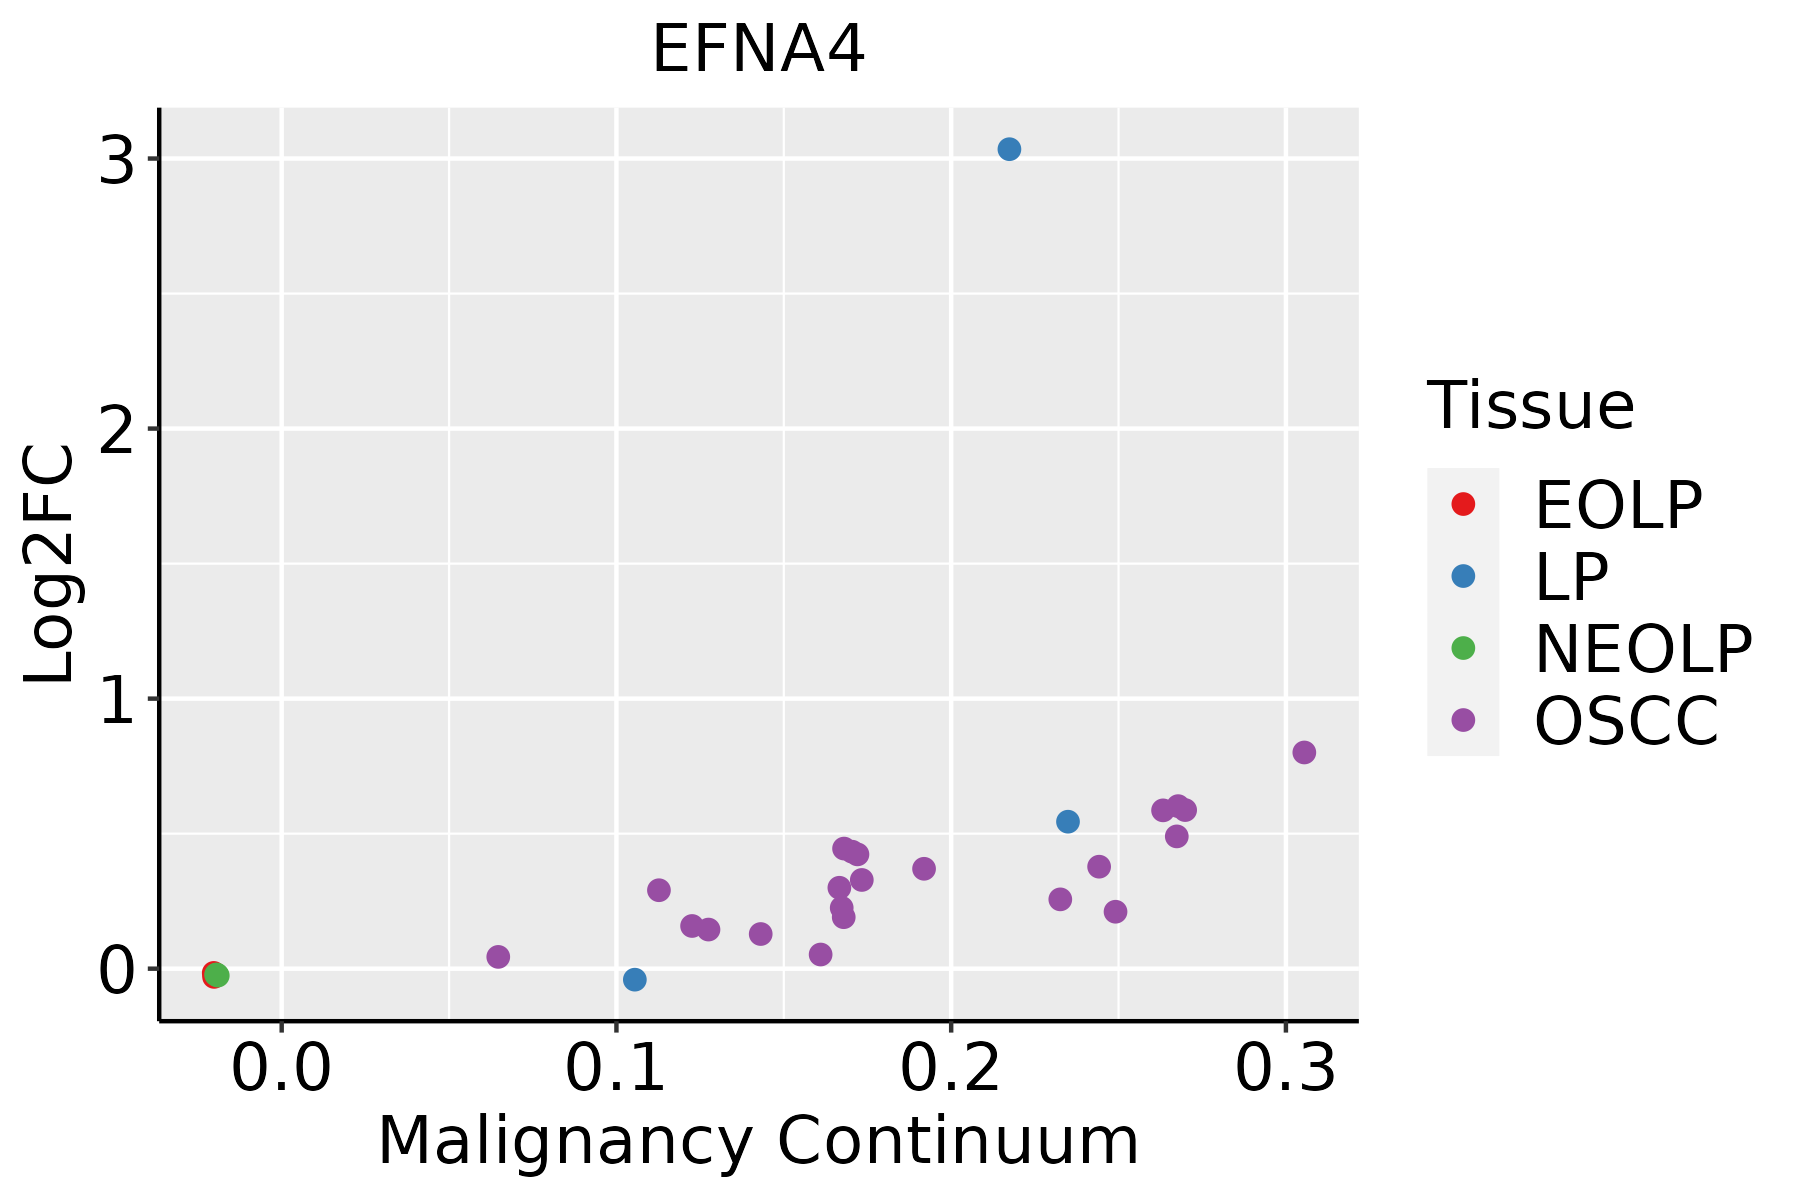 | EOLP: Erosive Oral lichen planus |
| LP: leukoplakia | ||
| NEOLP: Non-erosive oral lichen planus | ||
| OSCC: Oral squamous cell carcinoma | ||
| Skin |  | AK: Actinic keratosis |
| cSCC: Cutaneous squamous cell carcinoma | ||
| SCCIS:squamous cell carcinoma in situ |
| ∗log2FC in expression of this searched gene in stem-like cells from each diseased tissue sample relative to stem-like cells in normal samples in each tissue plotted against the malignancy continuum. Samples are colored based on if they are from different disease stage. |
Top |
Malignant transformation related pathway analysis |
| Find out the enriched GO biological processes and KEGG pathways involved in transition from healthy to precancer to cancer |
| Tissue | Disease Stage | Enriched GO biological Processes |
| Colorectum | AD |  |
| Colorectum | SER |  |
| Colorectum | MSS |  |
| Colorectum | MSI-H |  |
| Colorectum | FAP |  |
| ∗Top 15 enriched GO BP terms are showed in the bar plot of each disease state in each tissue. Each row represents a significant GO biological process which is colored according to the -log10(p.adjust). |
| Page: 1 2 3 4 5 6 7 8 9 |
| GO ID | Tissue | Disease Stage | Description | Gene Ratio | Bg Ratio | pvalue | p.adjust | Count |
| GO:006156415 | Esophagus | ESCC | axon development | 251/8552 | 467/18723 | 2.41e-04 | 1.49e-03 | 251 |
| GO:000740915 | Esophagus | ESCC | axonogenesis | 219/8552 | 418/18723 | 3.14e-03 | 1.31e-02 | 219 |
| GO:00480133 | Esophagus | ESCC | ephrin receptor signaling pathway | 33/8552 | 51/18723 | 4.77e-03 | 1.85e-02 | 33 |
| GO:00480132 | Oral cavity | OSCC | ephrin receptor signaling pathway | 29/7305 | 51/18723 | 7.33e-03 | 2.71e-02 | 29 |
| GO:006156410 | Oral cavity | OSCC | axon development | 207/7305 | 467/18723 | 1.01e-02 | 3.51e-02 | 207 |
| GO:004801321 | Skin | cSCC | ephrin receptor signaling pathway | 23/4864 | 51/18723 | 2.41e-03 | 1.38e-02 | 23 |
| GO:006156422 | Skin | cSCC | axon development | 146/4864 | 467/18723 | 5.50e-03 | 2.73e-02 | 146 |
| Page: 1 |
| Pathway ID | Tissue | Disease Stage | Description | Gene Ratio | Bg Ratio | pvalue | p.adjust | qvalue | Count |
| hsa0436016 | Esophagus | ESCC | Axon guidance | 108/4205 | 182/8465 | 5.13e-03 | 1.30e-02 | 6.67e-03 | 108 |
| hsa041517 | Esophagus | ESCC | PI3K-Akt signaling pathway | 197/4205 | 354/8465 | 1.24e-02 | 2.83e-02 | 1.45e-02 | 197 |
| hsa0436017 | Esophagus | ESCC | Axon guidance | 108/4205 | 182/8465 | 5.13e-03 | 1.30e-02 | 6.67e-03 | 108 |
| hsa0415114 | Esophagus | ESCC | PI3K-Akt signaling pathway | 197/4205 | 354/8465 | 1.24e-02 | 2.83e-02 | 1.45e-02 | 197 |
| hsa0401014 | Oral cavity | OSCC | MAPK signaling pathway | 165/3704 | 302/8465 | 7.11e-05 | 2.74e-04 | 1.40e-04 | 165 |
| hsa041516 | Oral cavity | OSCC | PI3K-Akt signaling pathway | 185/3704 | 354/8465 | 6.26e-04 | 1.86e-03 | 9.49e-04 | 185 |
| hsa0436014 | Oral cavity | OSCC | Axon guidance | 97/3704 | 182/8465 | 5.59e-03 | 1.33e-02 | 6.76e-03 | 97 |
| hsa0401518 | Oral cavity | OSCC | Rap1 signaling pathway | 107/3704 | 210/8465 | 2.01e-02 | 4.34e-02 | 2.21e-02 | 107 |
| hsa0401015 | Oral cavity | OSCC | MAPK signaling pathway | 165/3704 | 302/8465 | 7.11e-05 | 2.74e-04 | 1.40e-04 | 165 |
| hsa0415113 | Oral cavity | OSCC | PI3K-Akt signaling pathway | 185/3704 | 354/8465 | 6.26e-04 | 1.86e-03 | 9.49e-04 | 185 |
| hsa0436015 | Oral cavity | OSCC | Axon guidance | 97/3704 | 182/8465 | 5.59e-03 | 1.33e-02 | 6.76e-03 | 97 |
| hsa0401519 | Oral cavity | OSCC | Rap1 signaling pathway | 107/3704 | 210/8465 | 2.01e-02 | 4.34e-02 | 2.21e-02 | 107 |
| Page: 1 |
Top |
Cell-cell communication analysis |
| Identification of potential cell-cell interactions between two cell types and their ligand-receptor pairs for different disease states |
| Ligand | Receptor | LRpair | Pathway | Tissue | Disease Stage |
| EFNA4 | EPHA2 | EFNA4_EPHA2 | EPHA | Esophagus | ESCC |
| EFNA4 | EPHA3 | EFNA4_EPHA3 | EPHA | Esophagus | ESCC |
| EFNA4 | EPHA4 | EFNA4_EPHA4 | EPHA | Esophagus | ESCC |
| EFNA4 | EPHA1 | EFNA4_EPHA1 | EPHA | HNSCC | OSCC |
| EFNA4 | EPHA2 | EFNA4_EPHA2 | EPHA | HNSCC | OSCC |
| EFNA4 | EPHA4 | EFNA4_EPHA4 | EPHA | HNSCC | OSCC |
| EFNA4 | EPHA1 | EFNA4_EPHA1 | EPHA | HNSCC | Precancer |
| EFNA4 | EPHA2 | EFNA4_EPHA2 | EPHA | HNSCC | Precancer |
| EFNA4 | EPHA4 | EFNA4_EPHA4 | EPHA | HNSCC | Precancer |
| EFNA4 | EPHA3 | EFNA4_EPHA3 | EPHA | THCA | Cancer |
| Page: 1 |
Top |
Single-cell gene regulatory network inference analysis |
| Find out the significant the regulons (TFs) and the target genes of each regulon across cell types for different disease states |
| TF | Cell Type | Tissue | Disease Stage | Target Gene | RSS | Regulon Activity |
| ∗The dot plots of a searched regulon are shown for all cell subpopulations in each disease state of each tissue based on the regulon specific score inferred using pySCENIC and by calculating the average expression. |
| Page: 1 |
Top |
Somatic mutation of malignant transformation related genes |
| Annotation of somatic variants for genes involved in malignant transformation |
| Hugo Symbol | Variant Class | Variant Classification | dbSNP RS | HGVSc | HGVSp | HGVSp Short | SWISSPROT | BIOTYPE | SIFT | PolyPhen | Tumor Sample Barcode | Tissue | Histology | Sex | Age | Stage | Therapy Types | Drugs | Outcome |
| EFNA4 | SNV | Missense_Mutation | c.505G>C | p.Gly169Arg | p.G169R | P52798 | protein_coding | tolerated(0.17) | benign(0.003) | TCGA-AC-A23H-01 | Breast | breast invasive carcinoma | Female | >=65 | I/II | Unknown | Unknown | PD | |
| EFNA4 | SNV | Missense_Mutation | c.80N>T | p.Arg27Leu | p.R27L | P52798 | protein_coding | deleterious(0) | probably_damaging(0.953) | TCGA-D8-A4Z1-01 | Breast | breast invasive carcinoma | Female | >=65 | I/II | Hormone Therapy | tamoxiphen | SD | |
| EFNA4 | SNV | Missense_Mutation | novel | c.464A>T | p.Glu155Val | p.E155V | P52798 | protein_coding | deleterious(0.02) | possibly_damaging(0.844) | TCGA-JL-A3YW-01 | Breast | breast invasive carcinoma | Female | <65 | I/II | Unknown | Unknown | SD |
| EFNA4 | SNV | Missense_Mutation | novel | c.554N>T | p.Gly185Val | p.G185V | P52798 | protein_coding | tolerated_low_confidence(0.11) | possibly_damaging(0.714) | TCGA-VS-A9UI-01 | Cervix | cervical & endocervical cancer | Female | >=65 | I/II | Unknown | Unknown | SD |
| EFNA4 | SNV | Missense_Mutation | c.569A>G | p.Glu190Gly | p.E190G | P52798 | protein_coding | deleterious_low_confidence(0.01) | benign(0.04) | TCGA-AA-3864-01 | Colorectum | colon adenocarcinoma | Male | >=65 | I/II | Unknown | Unknown | SD | |
| EFNA4 | SNV | Missense_Mutation | c.615N>G | p.Ile205Met | p.I205M | P52798 | protein_coding | deleterious_low_confidence(0) | benign(0.181) | TCGA-F4-6570-01 | Colorectum | colon adenocarcinoma | Female | >=65 | I/II | Unknown | Unknown | SD | |
| EFNA4 | SNV | Missense_Mutation | c.36G>T | p.Trp12Cys | p.W12C | P52798 | protein_coding | deleterious(0) | probably_damaging(0.971) | TCGA-WS-AB45-01 | Colorectum | colon adenocarcinoma | Female | <65 | I/II | Unknown | Unknown | SD | |
| EFNA4 | SNV | Missense_Mutation | c.241C>A | p.Pro81Thr | p.P81T | P52798 | protein_coding | tolerated(0.09) | benign(0.053) | TCGA-AH-6644-01 | Colorectum | rectum adenocarcinoma | Male | >=65 | III/IV | Unknown | Unknown | SD | |
| EFNA4 | SNV | Missense_Mutation | novel | c.564N>A | p.Met188Ile | p.M188I | P52798 | protein_coding | tolerated_low_confidence(0.06) | benign(0) | TCGA-AP-A1DK-01 | Endometrium | uterine corpus endometrioid carcinoma | Female | <65 | I/II | Unknown | Unknown | SD |
| EFNA4 | SNV | Missense_Mutation | novel | c.430N>A | p.Cys144Ser | p.C144S | P52798 | protein_coding | deleterious(0) | probably_damaging(0.985) | TCGA-BG-A222-01 | Endometrium | uterine corpus endometrioid carcinoma | Female | <65 | I/II | Unknown | Unknown | SD |
| Page: 1 2 |
Top |
Related drugs of malignant transformation related genes |
| Identification of chemicals and drugs interact with genes involved in malignant transfromation |
| (DGIdb 4.0) |
| Entrez ID | Symbol | Category | Interaction Types | Drug Claim Name | Drug Name | PMIDs |
| Page: 1 |

Copyright 2023-Present -The University of Texas Health Science Center at Houston |