
|
|||||
|
 | |
| |
| |
| |
| |
| |
|
Gene: EFNA3 |
Gene summary for EFNA3 |
| Gene information | Species | Human | Gene symbol | EFNA3 | Gene ID | 1944 |
| Gene name | ephrin A3 | |
| Gene Alias | EFL2 | |
| Cytomap | 1q21.3 | |
| Gene Type | protein-coding | GO ID | GO:0000902 | UniProtAcc | P52797 |
Top |
Malignant transformation analysis |
| Identification of the aberrant gene expression in precancerous and cancerous lesions by comparing the gene expression of stem-like cells in diseased tissues with normal stem cells |
| Entrez ID | Symbol | Replicates | Species | Organ | Tissue | Adj P-value | Log2FC | Malignancy |
| 1944 | EFNA3 | LZE4T | Human | Esophagus | ESCC | 2.37e-02 | 9.70e-02 | 0.0811 |
| 1944 | EFNA3 | LZE24T | Human | Esophagus | ESCC | 6.29e-04 | 1.19e-01 | 0.0596 |
| 1944 | EFNA3 | LZE21T | Human | Esophagus | ESCC | 9.73e-05 | 2.53e-01 | 0.0655 |
| 1944 | EFNA3 | P1T-E | Human | Esophagus | ESCC | 4.62e-03 | 1.80e-01 | 0.0875 |
| 1944 | EFNA3 | P2T-E | Human | Esophagus | ESCC | 4.61e-28 | 4.73e-01 | 0.1177 |
| 1944 | EFNA3 | P4T-E | Human | Esophagus | ESCC | 2.81e-13 | 2.86e-01 | 0.1323 |
| 1944 | EFNA3 | P5T-E | Human | Esophagus | ESCC | 6.05e-12 | 1.92e-01 | 0.1327 |
| 1944 | EFNA3 | P9T-E | Human | Esophagus | ESCC | 5.23e-05 | 1.39e-01 | 0.1131 |
| 1944 | EFNA3 | P10T-E | Human | Esophagus | ESCC | 1.38e-40 | 8.16e-01 | 0.116 |
| 1944 | EFNA3 | P11T-E | Human | Esophagus | ESCC | 4.74e-03 | 1.54e-01 | 0.1426 |
| 1944 | EFNA3 | P12T-E | Human | Esophagus | ESCC | 1.04e-15 | 3.11e-01 | 0.1122 |
| 1944 | EFNA3 | P15T-E | Human | Esophagus | ESCC | 1.19e-13 | 2.55e-01 | 0.1149 |
| 1944 | EFNA3 | P16T-E | Human | Esophagus | ESCC | 7.21e-28 | 4.79e-01 | 0.1153 |
| 1944 | EFNA3 | P20T-E | Human | Esophagus | ESCC | 1.65e-17 | 3.77e-01 | 0.1124 |
| 1944 | EFNA3 | P21T-E | Human | Esophagus | ESCC | 6.95e-08 | 2.16e-01 | 0.1617 |
| 1944 | EFNA3 | P22T-E | Human | Esophagus | ESCC | 4.78e-16 | 2.75e-01 | 0.1236 |
| 1944 | EFNA3 | P23T-E | Human | Esophagus | ESCC | 4.42e-05 | 1.25e-01 | 0.108 |
| 1944 | EFNA3 | P24T-E | Human | Esophagus | ESCC | 1.79e-13 | 2.67e-01 | 0.1287 |
| 1944 | EFNA3 | P26T-E | Human | Esophagus | ESCC | 1.76e-30 | 5.66e-01 | 0.1276 |
| 1944 | EFNA3 | P27T-E | Human | Esophagus | ESCC | 7.02e-15 | 2.14e-01 | 0.1055 |
| Page: 1 2 3 4 |
| Tissue | Expression Dynamics | Abbreviation |
| Esophagus | 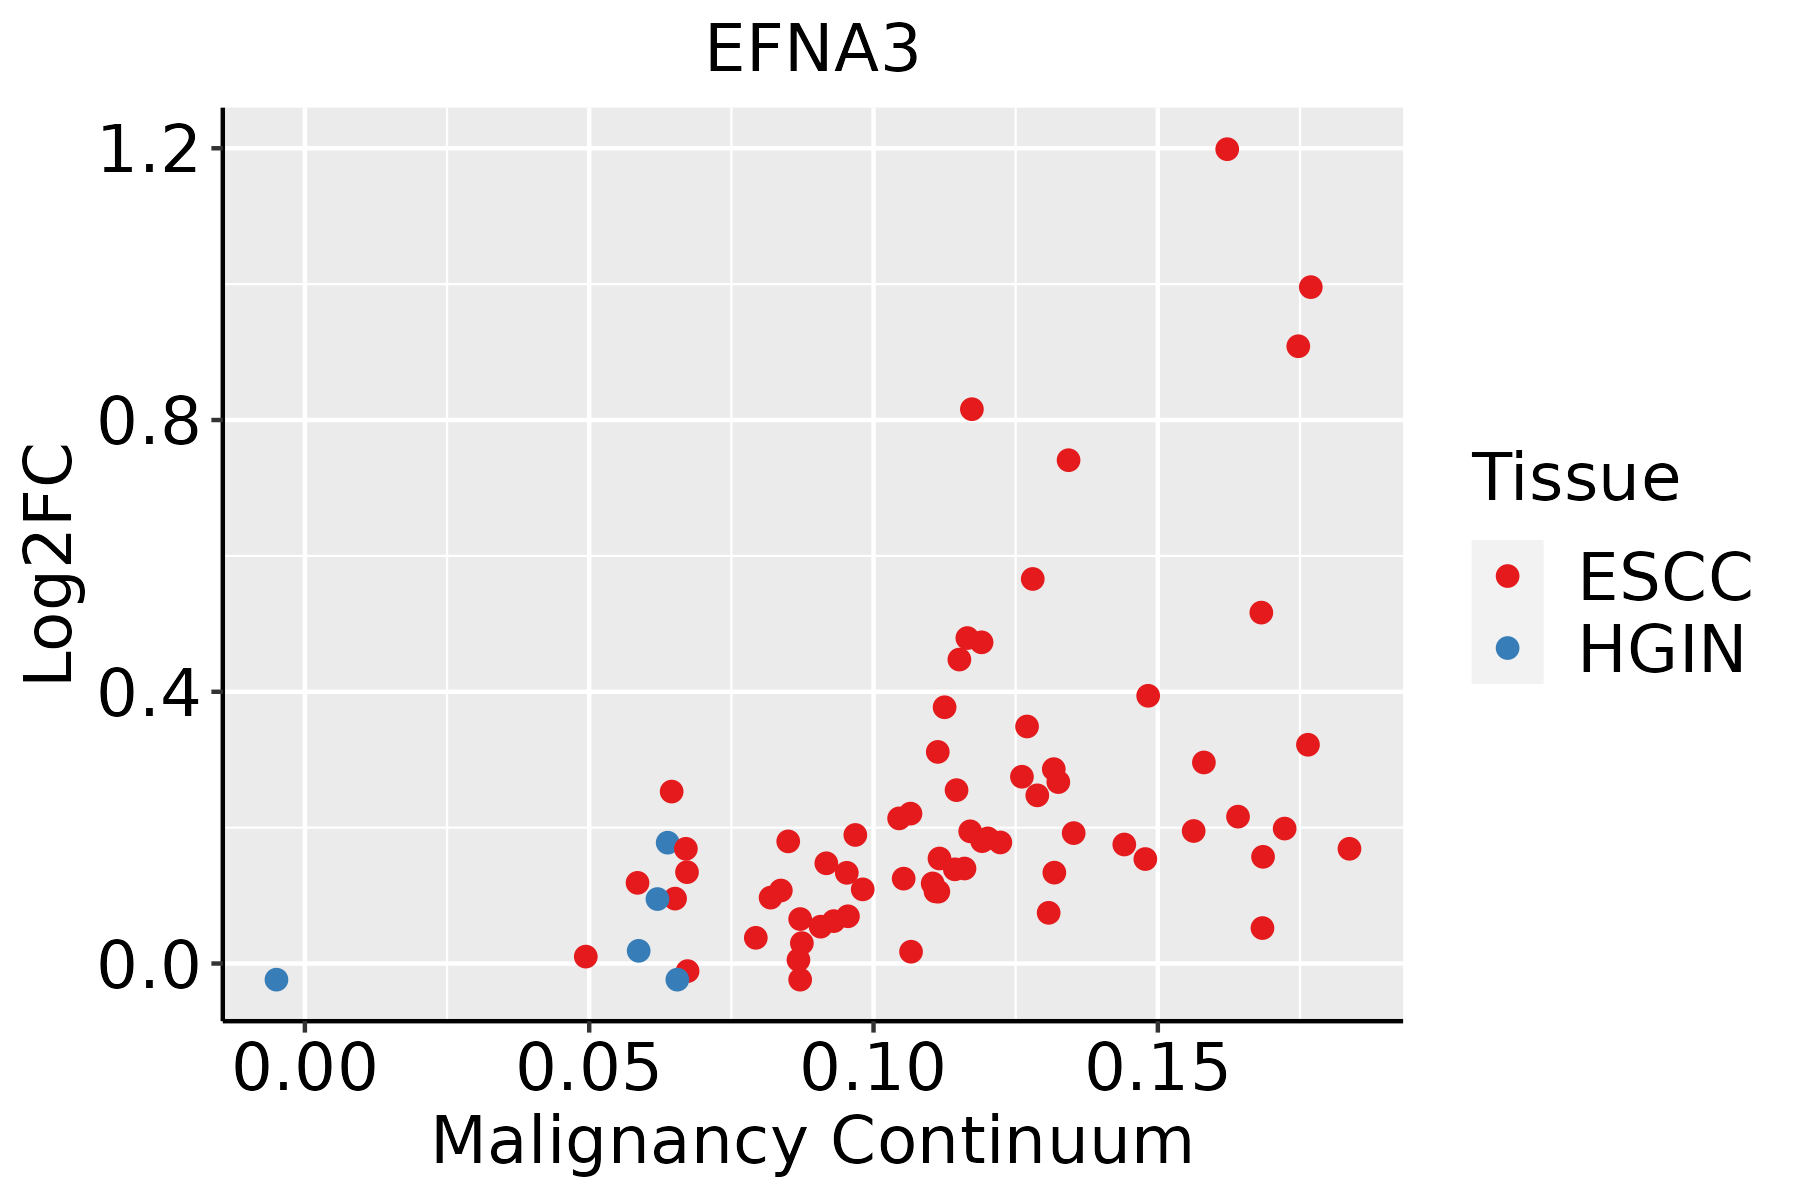 | ESCC: Esophageal squamous cell carcinoma |
| HGIN: High-grade intraepithelial neoplasias | ||
| LGIN: Low-grade intraepithelial neoplasias | ||
| Oral Cavity | 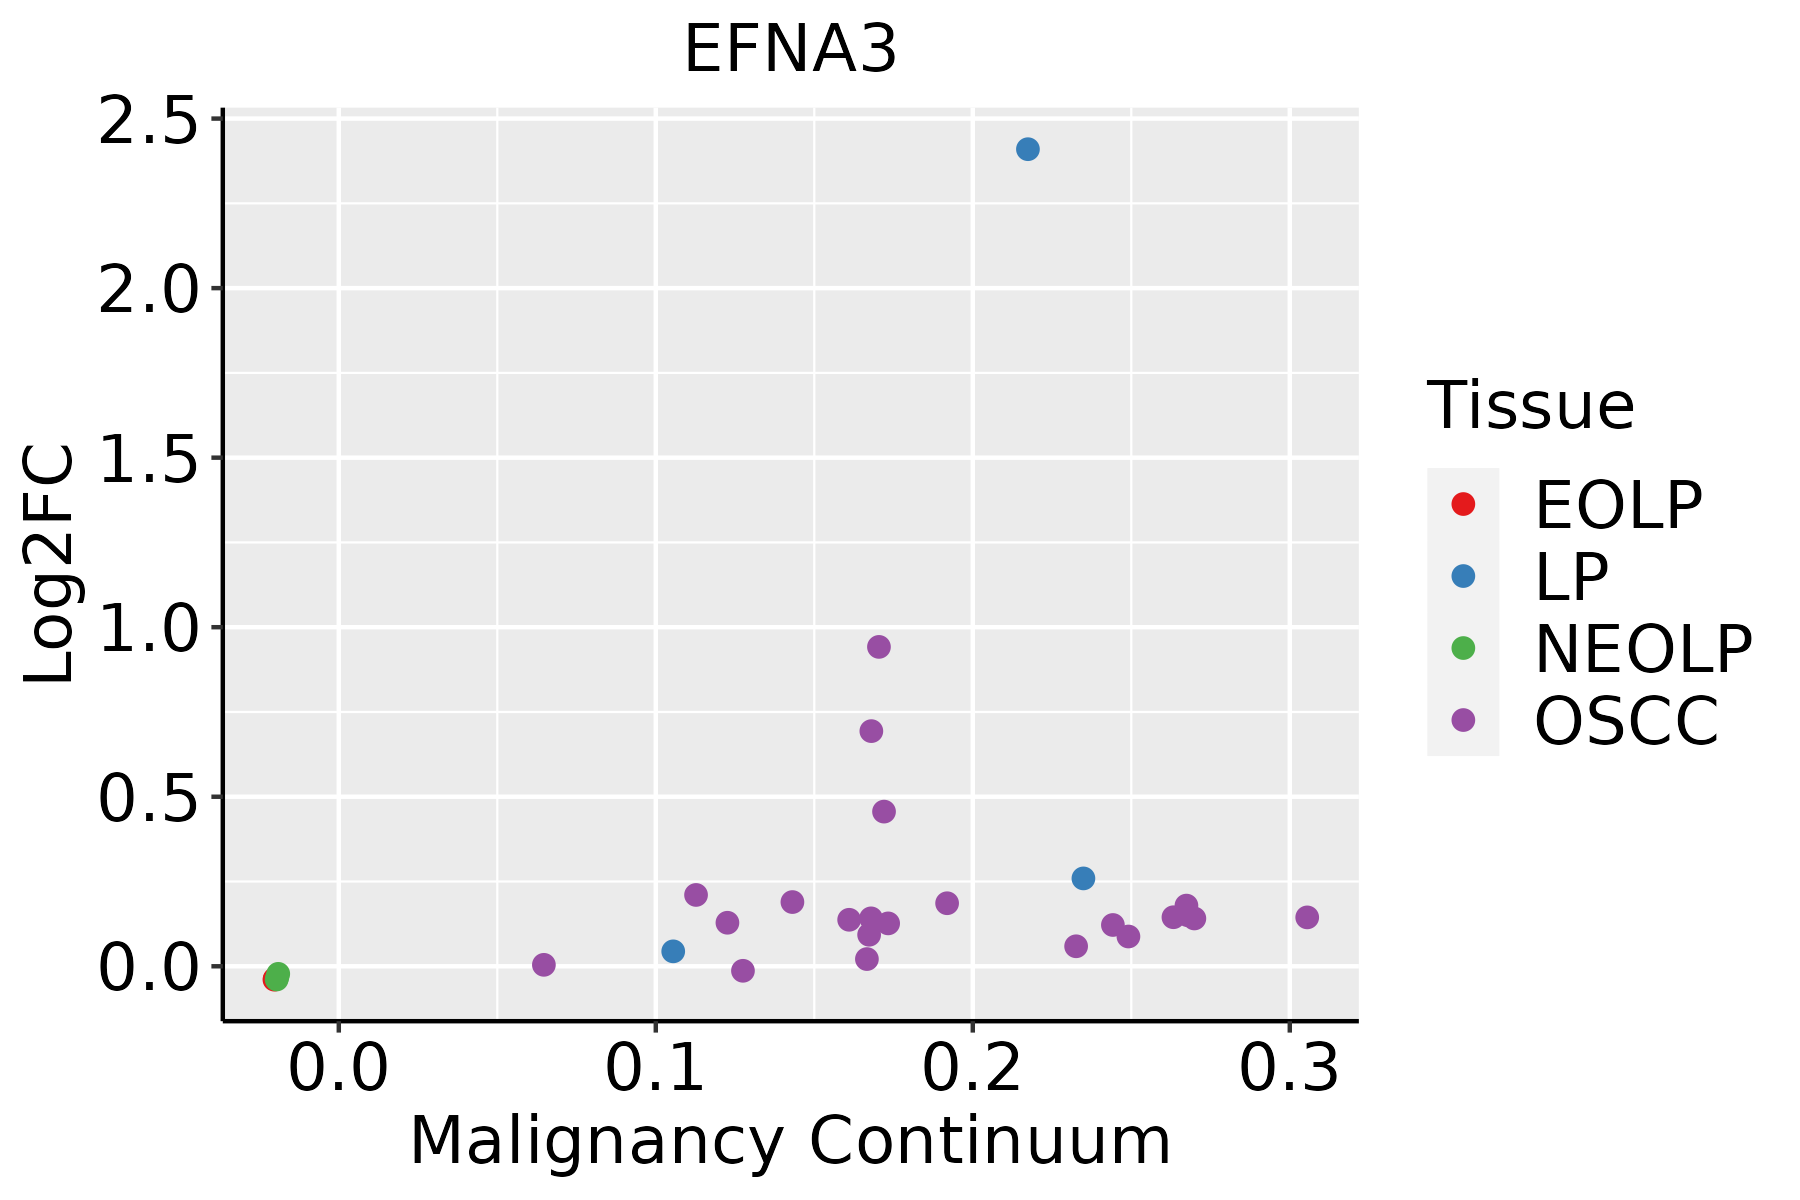 | EOLP: Erosive Oral lichen planus |
| LP: leukoplakia | ||
| NEOLP: Non-erosive oral lichen planus | ||
| OSCC: Oral squamous cell carcinoma | ||
| Skin | 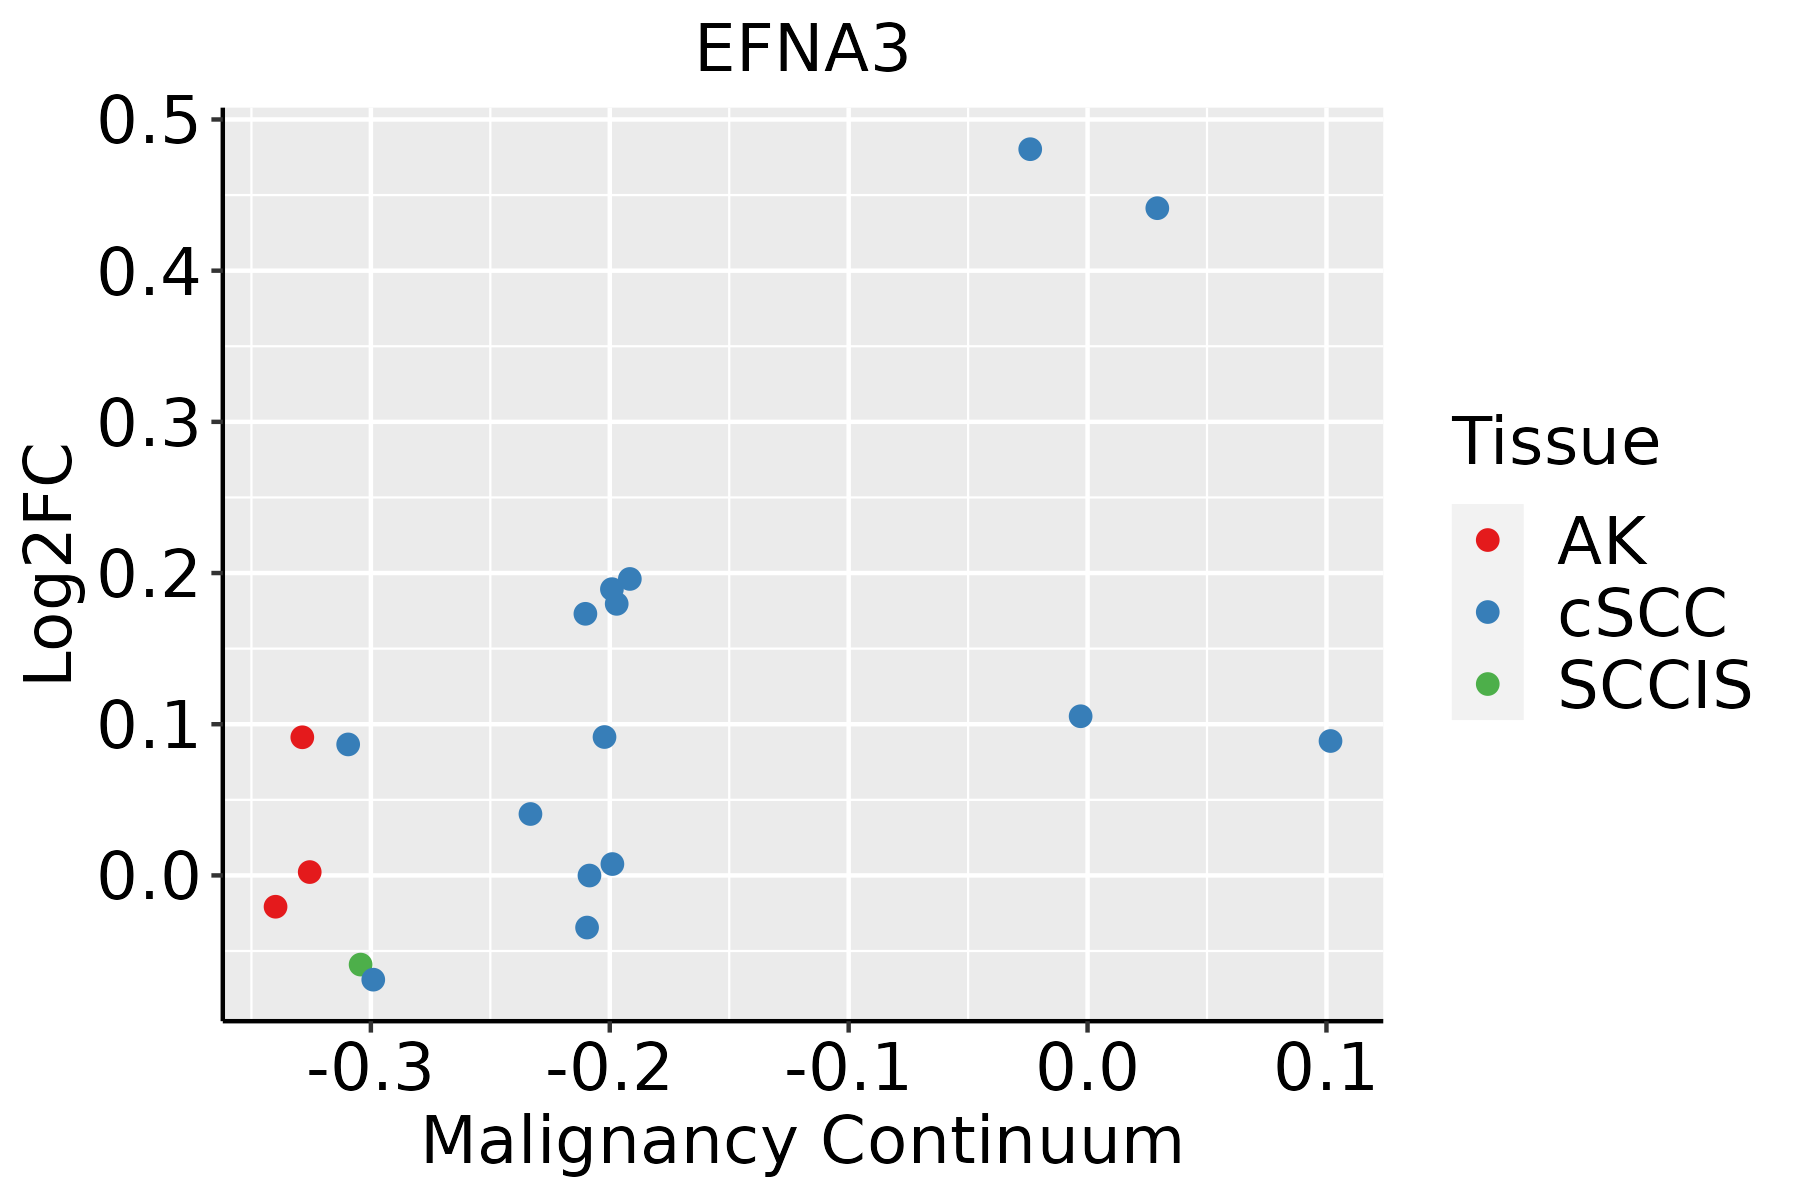 | AK: Actinic keratosis |
| cSCC: Cutaneous squamous cell carcinoma | ||
| SCCIS:squamous cell carcinoma in situ |
| ∗log2FC in expression of this searched gene in stem-like cells from each diseased tissue sample relative to stem-like cells in normal samples in each tissue plotted against the malignancy continuum. Samples are colored based on if they are from different disease stage. |
Top |
Malignant transformation related pathway analysis |
| Find out the enriched GO biological processes and KEGG pathways involved in transition from healthy to precancer to cancer |
| Tissue | Disease Stage | Enriched GO biological Processes |
| Colorectum | AD |  |
| Colorectum | SER |  |
| Colorectum | MSS |  |
| Colorectum | MSI-H |  |
| Colorectum | FAP |  |
| ∗Top 15 enriched GO BP terms are showed in the bar plot of each disease state in each tissue. Each row represents a significant GO biological process which is colored according to the -log10(p.adjust). |
| Page: 1 2 3 4 5 6 7 8 9 |
| GO ID | Tissue | Disease Stage | Description | Gene Ratio | Bg Ratio | pvalue | p.adjust | Count |
| GO:0045862111 | Esophagus | ESCC | positive regulation of proteolysis | 256/8552 | 372/18723 | 7.88e-20 | 9.43e-18 | 256 |
| GO:0010952111 | Esophagus | ESCC | positive regulation of peptidase activity | 133/8552 | 197/18723 | 4.31e-10 | 1.14e-08 | 133 |
| GO:0052547111 | Esophagus | ESCC | regulation of peptidase activity | 275/8552 | 461/18723 | 7.54e-10 | 1.88e-08 | 275 |
| GO:0052548111 | Esophagus | ESCC | regulation of endopeptidase activity | 253/8552 | 432/18723 | 3.68e-08 | 6.78e-07 | 253 |
| GO:0010950111 | Esophagus | ESCC | positive regulation of endopeptidase activity | 116/8552 | 179/18723 | 1.77e-07 | 2.79e-06 | 116 |
| GO:006156415 | Esophagus | ESCC | axon development | 251/8552 | 467/18723 | 2.41e-04 | 1.49e-03 | 251 |
| GO:000740915 | Esophagus | ESCC | axonogenesis | 219/8552 | 418/18723 | 3.14e-03 | 1.31e-02 | 219 |
| GO:00480133 | Esophagus | ESCC | ephrin receptor signaling pathway | 33/8552 | 51/18723 | 4.77e-03 | 1.85e-02 | 33 |
| GO:19029597 | Esophagus | ESCC | regulation of aspartic-type endopeptidase activity involved in amyloid precursor protein catabolic process | 9/8552 | 10/18723 | 5.09e-03 | 1.92e-02 | 9 |
| GO:19052457 | Esophagus | ESCC | regulation of aspartic-type peptidase activity | 10/8552 | 12/18723 | 8.94e-03 | 3.12e-02 | 10 |
| GO:004586220 | Oral cavity | OSCC | positive regulation of proteolysis | 236/7305 | 372/18723 | 6.53e-22 | 1.38e-19 | 236 |
| GO:005254720 | Oral cavity | OSCC | regulation of peptidase activity | 255/7305 | 461/18723 | 5.78e-13 | 2.75e-11 | 255 |
| GO:001095220 | Oral cavity | OSCC | positive regulation of peptidase activity | 123/7305 | 197/18723 | 2.12e-11 | 7.21e-10 | 123 |
| GO:005254820 | Oral cavity | OSCC | regulation of endopeptidase activity | 235/7305 | 432/18723 | 4.35e-11 | 1.40e-09 | 235 |
| GO:001095019 | Oral cavity | OSCC | positive regulation of endopeptidase activity | 107/7305 | 179/18723 | 1.38e-08 | 2.78e-07 | 107 |
| GO:00429873 | Oral cavity | OSCC | amyloid precursor protein catabolic process | 40/7305 | 68/18723 | 7.28e-04 | 3.98e-03 | 40 |
| GO:00429823 | Oral cavity | OSCC | amyloid precursor protein metabolic process | 52/7305 | 95/18723 | 1.33e-03 | 6.62e-03 | 52 |
| GO:00480132 | Oral cavity | OSCC | ephrin receptor signaling pathway | 29/7305 | 51/18723 | 7.33e-03 | 2.71e-02 | 29 |
| GO:006156410 | Oral cavity | OSCC | axon development | 207/7305 | 467/18723 | 1.01e-02 | 3.51e-02 | 207 |
| GO:0045862110 | Oral cavity | LP | positive regulation of proteolysis | 165/4623 | 372/18723 | 5.40e-17 | 8.46e-15 | 165 |
| Page: 1 2 |
| Pathway ID | Tissue | Disease Stage | Description | Gene Ratio | Bg Ratio | pvalue | p.adjust | qvalue | Count |
| hsa0436016 | Esophagus | ESCC | Axon guidance | 108/4205 | 182/8465 | 5.13e-03 | 1.30e-02 | 6.67e-03 | 108 |
| hsa041517 | Esophagus | ESCC | PI3K-Akt signaling pathway | 197/4205 | 354/8465 | 1.24e-02 | 2.83e-02 | 1.45e-02 | 197 |
| hsa0436017 | Esophagus | ESCC | Axon guidance | 108/4205 | 182/8465 | 5.13e-03 | 1.30e-02 | 6.67e-03 | 108 |
| hsa0415114 | Esophagus | ESCC | PI3K-Akt signaling pathway | 197/4205 | 354/8465 | 1.24e-02 | 2.83e-02 | 1.45e-02 | 197 |
| hsa0401014 | Oral cavity | OSCC | MAPK signaling pathway | 165/3704 | 302/8465 | 7.11e-05 | 2.74e-04 | 1.40e-04 | 165 |
| hsa041516 | Oral cavity | OSCC | PI3K-Akt signaling pathway | 185/3704 | 354/8465 | 6.26e-04 | 1.86e-03 | 9.49e-04 | 185 |
| hsa0436014 | Oral cavity | OSCC | Axon guidance | 97/3704 | 182/8465 | 5.59e-03 | 1.33e-02 | 6.76e-03 | 97 |
| hsa0401518 | Oral cavity | OSCC | Rap1 signaling pathway | 107/3704 | 210/8465 | 2.01e-02 | 4.34e-02 | 2.21e-02 | 107 |
| hsa0401015 | Oral cavity | OSCC | MAPK signaling pathway | 165/3704 | 302/8465 | 7.11e-05 | 2.74e-04 | 1.40e-04 | 165 |
| hsa0415113 | Oral cavity | OSCC | PI3K-Akt signaling pathway | 185/3704 | 354/8465 | 6.26e-04 | 1.86e-03 | 9.49e-04 | 185 |
| hsa0436015 | Oral cavity | OSCC | Axon guidance | 97/3704 | 182/8465 | 5.59e-03 | 1.33e-02 | 6.76e-03 | 97 |
| hsa0401519 | Oral cavity | OSCC | Rap1 signaling pathway | 107/3704 | 210/8465 | 2.01e-02 | 4.34e-02 | 2.21e-02 | 107 |
| Page: 1 |
Top |
Cell-cell communication analysis |
| Identification of potential cell-cell interactions between two cell types and their ligand-receptor pairs for different disease states |
| Ligand | Receptor | LRpair | Pathway | Tissue | Disease Stage |
| EFNA3 | EPHA2 | EFNA3_EPHA2 | EPHA | CRC | MSI-H |
| EFNA3 | EPHA4 | EFNA3_EPHA4 | EPHA | CRC | MSI-H |
| EFNA3 | EPHA5 | EFNA3_EPHA5 | EPHA | CRC | MSI-H |
| EFNA3 | EPHA2 | EFNA3_EPHA2 | EPHA | Esophagus | ESCC |
| EFNA3 | EPHA3 | EFNA3_EPHA3 | EPHA | Esophagus | ESCC |
| EFNA3 | EPHA4 | EFNA3_EPHA4 | EPHA | Esophagus | ESCC |
| EFNA3 | EPHA1 | EFNA3_EPHA1 | EPHA | HNSCC | OSCC |
| EFNA3 | EPHA2 | EFNA3_EPHA2 | EPHA | HNSCC | OSCC |
| EFNA3 | EPHA4 | EFNA3_EPHA4 | EPHA | HNSCC | OSCC |
| EFNA3 | EPHA1 | EFNA3_EPHA1 | EPHA | HNSCC | Precancer |
| EFNA3 | EPHA2 | EFNA3_EPHA2 | EPHA | HNSCC | Precancer |
| EFNA3 | EPHA4 | EFNA3_EPHA4 | EPHA | HNSCC | Precancer |
| EFNA3 | EPHA2 | EFNA3_EPHA2 | EPHA | Skin | ADJ |
| EFNA3 | EPHA4 | EFNA3_EPHA4 | EPHA | Skin | ADJ |
| EFNA3 | EPHA2 | EFNA3_EPHA2 | EPHA | Skin | AK |
| EFNA3 | EPHA4 | EFNA3_EPHA4 | EPHA | Skin | AK |
| Page: 1 |
Top |
Single-cell gene regulatory network inference analysis |
| Find out the significant the regulons (TFs) and the target genes of each regulon across cell types for different disease states |
| TF | Cell Type | Tissue | Disease Stage | Target Gene | RSS | Regulon Activity |
| ∗The dot plots of a searched regulon are shown for all cell subpopulations in each disease state of each tissue based on the regulon specific score inferred using pySCENIC and by calculating the average expression. |
| Page: 1 |
Top |
Somatic mutation of malignant transformation related genes |
| Annotation of somatic variants for genes involved in malignant transformation |
| Hugo Symbol | Variant Class | Variant Classification | dbSNP RS | HGVSc | HGVSp | HGVSp Short | SWISSPROT | BIOTYPE | SIFT | PolyPhen | Tumor Sample Barcode | Tissue | Histology | Sex | Age | Stage | Therapy Types | Drugs | Outcome |
| EFNA3 | SNV | Missense_Mutation | c.601G>C | p.Glu201Gln | p.E201Q | P52797 | protein_coding | tolerated(0.18) | benign(0.017) | TCGA-AC-A23H-01 | Breast | breast invasive carcinoma | Female | >=65 | I/II | Unknown | Unknown | PD | |
| EFNA3 | SNV | Missense_Mutation | novel | c.647G>T | p.Ser216Ile | p.S216I | P52797 | protein_coding | deleterious(0) | probably_damaging(0.979) | TCGA-AC-A3W5-01 | Breast | breast invasive carcinoma | Female | >=65 | I/II | Chemotherapy | docetaxel | CR |
| EFNA3 | SNV | Missense_Mutation | c.673N>T | p.Ala225Ser | p.A225S | P52797 | protein_coding | tolerated(0.28) | benign(0.018) | TCGA-C8-A12Q-01 | Breast | breast invasive carcinoma | Female | >=65 | III/IV | Unknown | Unknown | PD | |
| EFNA3 | SNV | Missense_Mutation | novel | c.536N>A | p.Pro179His | p.P179H | P52797 | protein_coding | deleterious(0.04) | possibly_damaging(0.839) | TCGA-AA-3947-01 | Colorectum | colon adenocarcinoma | Female | <65 | I/II | Unknown | Unknown | SD |
| EFNA3 | SNV | Missense_Mutation | novel | c.252N>T | p.Glu84Asp | p.E84D | P52797 | protein_coding | deleterious(0) | benign(0.009) | TCGA-AA-A010-01 | Colorectum | colon adenocarcinoma | Female | <65 | I/II | Chemotherapy | folinic | CR |
| EFNA3 | SNV | Missense_Mutation | rs200827058 | c.667C>T | p.Pro223Ser | p.P223S | P52797 | protein_coding | tolerated(0.17) | benign(0.122) | TCGA-AP-A051-01 | Endometrium | uterine corpus endometrioid carcinoma | Female | >=65 | I/II | Unknown | Unknown | SD |
| EFNA3 | SNV | Missense_Mutation | novel | c.366N>A | p.Phe122Leu | p.F122L | P52797 | protein_coding | deleterious(0) | probably_damaging(0.995) | TCGA-AX-A05Z-01 | Endometrium | uterine corpus endometrioid carcinoma | Female | <65 | III/IV | Chemotherapy | adriamycin | SD |
| EFNA3 | SNV | Missense_Mutation | novel | c.301G>A | p.Ala101Thr | p.A101T | P52797 | protein_coding | tolerated(0.59) | benign(0.003) | TCGA-B5-A3FC-01 | Endometrium | uterine corpus endometrioid carcinoma | Female | <65 | I/II | Unknown | Unknown | SD |
| EFNA3 | SNV | Missense_Mutation | novel | c.545N>T | p.Pro182Leu | p.P182L | P52797 | protein_coding | deleterious(0.04) | possibly_damaging(0.829) | TCGA-BK-A13B-01 | Endometrium | uterine corpus endometrioid carcinoma | Female | <65 | I/II | Unknown | Unknown | PD |
| EFNA3 | SNV | Missense_Mutation | novel | c.583N>A | p.Leu195Met | p.L195M | P52797 | protein_coding | tolerated(0.06) | possibly_damaging(0.831) | TCGA-EY-A215-01 | Endometrium | uterine corpus endometrioid carcinoma | Female | <65 | I/II | Unknown | Unknown | SD |
| Page: 1 2 |
Top |
Related drugs of malignant transformation related genes |
| Identification of chemicals and drugs interact with genes involved in malignant transfromation |
| (DGIdb 4.0) |
| Entrez ID | Symbol | Category | Interaction Types | Drug Claim Name | Drug Name | PMIDs |
| Page: 1 |

Copyright 2023-Present -The University of Texas Health Science Center at Houston |