
|
|||||
|
 | |
| |
| |
| |
| |
| |
|
Gene: EFL1 |
Gene summary for EFL1 |
| Gene information | Species | Human | Gene symbol | EFL1 | Gene ID | 79631 |
| Gene name | elongation factor like GTPase 1 | |
| Gene Alias | EFTUD1 | |
| Cytomap | 15q25.2 | |
| Gene Type | protein-coding | GO ID | GO:0006139 | UniProtAcc | Q7Z2Z2 |
Top |
Malignant transformation analysis |
| Identification of the aberrant gene expression in precancerous and cancerous lesions by comparing the gene expression of stem-like cells in diseased tissues with normal stem cells |
| Entrez ID | Symbol | Replicates | Species | Organ | Tissue | Adj P-value | Log2FC | Malignancy |
| 79631 | EFL1 | HTA11_3410_2000001011 | Human | Colorectum | AD | 2.56e-07 | -4.28e-01 | 0.0155 |
| 79631 | EFL1 | HTA11_696_2000001011 | Human | Colorectum | AD | 2.15e-04 | -2.67e-01 | -0.1464 |
| 79631 | EFL1 | HTA11_866_2000001011 | Human | Colorectum | AD | 7.07e-08 | -3.47e-01 | -0.1001 |
| 79631 | EFL1 | HTA11_866_3004761011 | Human | Colorectum | AD | 2.87e-07 | -4.22e-01 | 0.096 |
| 79631 | EFL1 | HTA11_7696_3000711011 | Human | Colorectum | AD | 6.98e-06 | -3.26e-01 | 0.0674 |
| 79631 | EFL1 | HTA11_99999970781_79442 | Human | Colorectum | MSS | 1.87e-07 | -3.51e-01 | 0.294 |
| 79631 | EFL1 | HTA11_99999971662_82457 | Human | Colorectum | MSS | 1.62e-03 | -3.13e-01 | 0.3859 |
| 79631 | EFL1 | HTA11_99999973899_84307 | Human | Colorectum | MSS | 3.24e-02 | -4.66e-01 | 0.2585 |
| 79631 | EFL1 | HTA11_99999974143_84620 | Human | Colorectum | MSS | 2.93e-19 | -5.30e-01 | 0.3005 |
| 79631 | EFL1 | A002-C-010 | Human | Colorectum | FAP | 2.88e-03 | -1.72e-01 | 0.242 |
| 79631 | EFL1 | A001-C-207 | Human | Colorectum | FAP | 3.34e-02 | -1.29e-01 | 0.1278 |
| 79631 | EFL1 | A015-C-203 | Human | Colorectum | FAP | 2.04e-23 | -4.43e-01 | -0.1294 |
| 79631 | EFL1 | A015-C-204 | Human | Colorectum | FAP | 2.32e-07 | -3.47e-01 | -0.0228 |
| 79631 | EFL1 | A014-C-040 | Human | Colorectum | FAP | 1.20e-03 | -3.80e-01 | -0.1184 |
| 79631 | EFL1 | A002-C-201 | Human | Colorectum | FAP | 3.50e-15 | -3.98e-01 | 0.0324 |
| 79631 | EFL1 | A001-C-119 | Human | Colorectum | FAP | 5.32e-11 | -4.80e-01 | -0.1557 |
| 79631 | EFL1 | A001-C-108 | Human | Colorectum | FAP | 6.52e-15 | -3.85e-01 | -0.0272 |
| 79631 | EFL1 | A002-C-205 | Human | Colorectum | FAP | 3.18e-18 | -4.37e-01 | -0.1236 |
| 79631 | EFL1 | A001-C-104 | Human | Colorectum | FAP | 4.79e-03 | -2.06e-01 | 0.0184 |
| 79631 | EFL1 | A015-C-005 | Human | Colorectum | FAP | 4.74e-05 | -3.01e-01 | -0.0336 |
| Page: 1 2 3 |
| Tissue | Expression Dynamics | Abbreviation |
| Colorectum (GSE201348) |  | FAP: Familial adenomatous polyposis |
| CRC: Colorectal cancer | ||
| Colorectum (HTA11) |  | AD: Adenomas |
| SER: Sessile serrated lesions | ||
| MSI-H: Microsatellite-high colorectal cancer | ||
| MSS: Microsatellite stable colorectal cancer | ||
| Prostate | 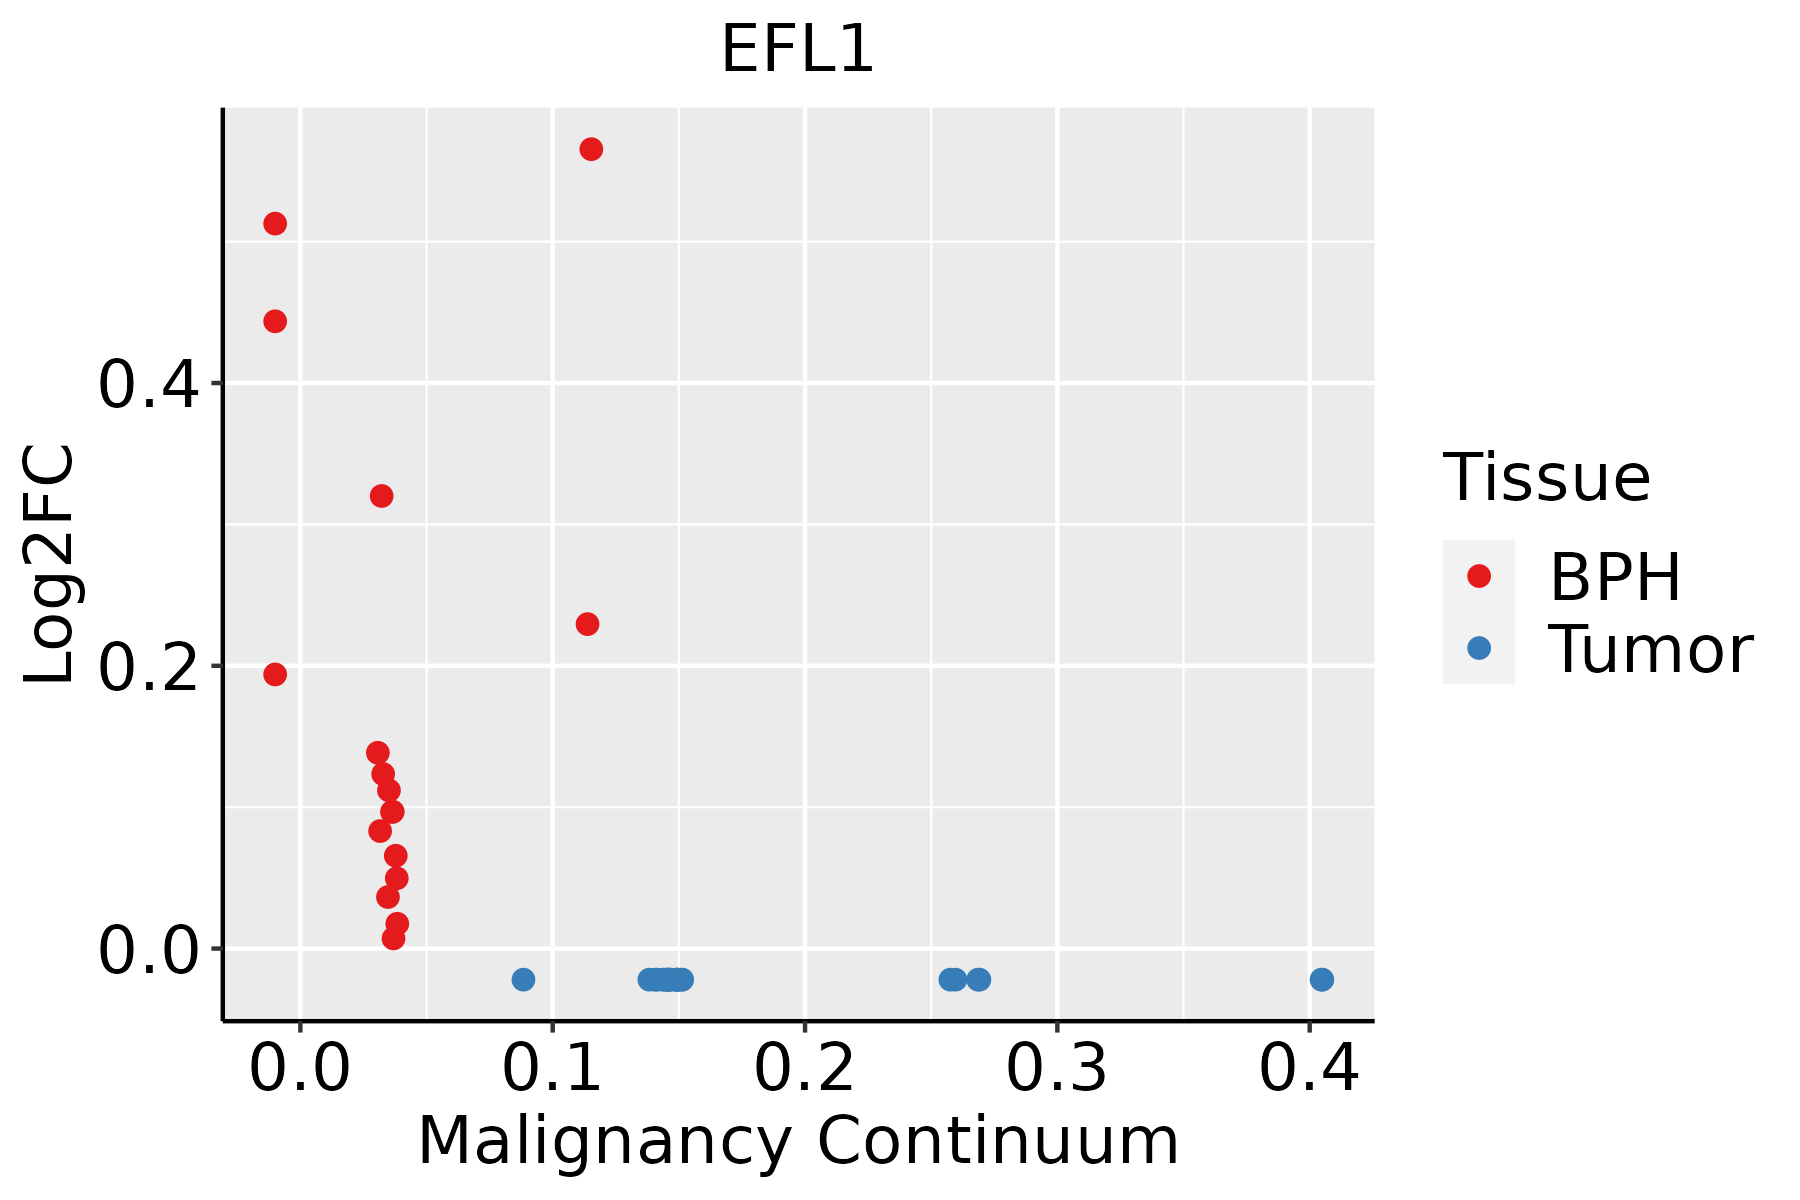 | BPH: Benign Prostatic Hyperplasia |
| ∗log2FC in expression of this searched gene in stem-like cells from each diseased tissue sample relative to stem-like cells in normal samples in each tissue plotted against the malignancy continuum. Samples are colored based on if they are from different disease stage. |
Top |
Malignant transformation related pathway analysis |
| Find out the enriched GO biological processes and KEGG pathways involved in transition from healthy to precancer to cancer |
| Tissue | Disease Stage | Enriched GO biological Processes |
| Colorectum | AD |  |
| Colorectum | SER |  |
| Colorectum | MSS |  |
| Colorectum | MSI-H |  |
| Colorectum | FAP |  |
| ∗Top 15 enriched GO BP terms are showed in the bar plot of each disease state in each tissue. Each row represents a significant GO biological process which is colored according to the -log10(p.adjust). |
| Page: 1 2 3 4 5 6 7 8 9 |
| GO ID | Tissue | Disease Stage | Description | Gene Ratio | Bg Ratio | pvalue | p.adjust | Count |
| GO:0009150 | Colorectum | AD | purine ribonucleotide metabolic process | 142/3918 | 368/18723 | 4.29e-15 | 1.17e-12 | 142 |
| GO:0006163 | Colorectum | AD | purine nucleotide metabolic process | 149/3918 | 396/18723 | 1.08e-14 | 2.80e-12 | 149 |
| GO:0072521 | Colorectum | AD | purine-containing compound metabolic process | 153/3918 | 416/18723 | 4.34e-14 | 1.01e-11 | 153 |
| GO:0009259 | Colorectum | AD | ribonucleotide metabolic process | 144/3918 | 385/18723 | 5.25e-14 | 1.13e-11 | 144 |
| GO:0019693 | Colorectum | AD | ribose phosphate metabolic process | 145/3918 | 396/18723 | 3.01e-13 | 5.71e-11 | 145 |
| GO:0009117 | Colorectum | AD | nucleotide metabolic process | 168/3918 | 489/18723 | 2.20e-12 | 3.36e-10 | 168 |
| GO:0006753 | Colorectum | AD | nucleoside phosphate metabolic process | 169/3918 | 497/18723 | 4.99e-12 | 6.98e-10 | 169 |
| GO:0022613 | Colorectum | AD | ribonucleoprotein complex biogenesis | 151/3918 | 463/18723 | 1.96e-09 | 1.39e-07 | 151 |
| GO:0009144 | Colorectum | AD | purine nucleoside triphosphate metabolic process | 43/3918 | 88/18723 | 5.05e-09 | 3.19e-07 | 43 |
| GO:0009205 | Colorectum | AD | purine ribonucleoside triphosphate metabolic process | 39/3918 | 82/18723 | 6.58e-08 | 3.40e-06 | 39 |
| GO:0009141 | Colorectum | AD | nucleoside triphosphate metabolic process | 48/3918 | 112/18723 | 1.27e-07 | 6.02e-06 | 48 |
| GO:0009199 | Colorectum | AD | ribonucleoside triphosphate metabolic process | 40/3918 | 89/18723 | 3.04e-07 | 1.21e-05 | 40 |
| GO:0042255 | Colorectum | AD | ribosome assembly | 28/3918 | 61/18723 | 1.08e-05 | 2.47e-04 | 28 |
| GO:0042254 | Colorectum | AD | ribosome biogenesis | 84/3918 | 299/18723 | 1.82e-03 | 1.50e-02 | 84 |
| GO:0006414 | Colorectum | AD | translational elongation | 21/3918 | 55/18723 | 2.53e-03 | 1.93e-02 | 21 |
| GO:00061632 | Colorectum | MSS | purine nucleotide metabolic process | 128/3467 | 396/18723 | 2.04e-11 | 3.02e-09 | 128 |
| GO:00091502 | Colorectum | MSS | purine ribonucleotide metabolic process | 121/3467 | 368/18723 | 2.08e-11 | 3.02e-09 | 121 |
| GO:00226132 | Colorectum | MSS | ribonucleoprotein complex biogenesis | 144/3467 | 463/18723 | 2.76e-11 | 3.67e-09 | 144 |
| GO:00725212 | Colorectum | MSS | purine-containing compound metabolic process | 132/3467 | 416/18723 | 4.13e-11 | 4.86e-09 | 132 |
| GO:00092592 | Colorectum | MSS | ribonucleotide metabolic process | 123/3467 | 385/18723 | 1.17e-10 | 1.20e-08 | 123 |
| Page: 1 2 3 4 |
| Pathway ID | Tissue | Disease Stage | Description | Gene Ratio | Bg Ratio | pvalue | p.adjust | qvalue | Count |
| Page: 1 |
Top |
Cell-cell communication analysis |
| Identification of potential cell-cell interactions between two cell types and their ligand-receptor pairs for different disease states |
| Ligand | Receptor | LRpair | Pathway | Tissue | Disease Stage |
| Page: 1 |
Top |
Single-cell gene regulatory network inference analysis |
| Find out the significant the regulons (TFs) and the target genes of each regulon across cell types for different disease states |
| TF | Cell Type | Tissue | Disease Stage | Target Gene | RSS | Regulon Activity |
| ∗The dot plots of a searched regulon are shown for all cell subpopulations in each disease state of each tissue based on the regulon specific score inferred using pySCENIC and by calculating the average expression. |
| Page: 1 |
Top |
Somatic mutation of malignant transformation related genes |
| Annotation of somatic variants for genes involved in malignant transformation |
| Hugo Symbol | Variant Class | Variant Classification | dbSNP RS | HGVSc | HGVSp | HGVSp Short | SWISSPROT | BIOTYPE | SIFT | PolyPhen | Tumor Sample Barcode | Tissue | Histology | Sex | Age | Stage | Therapy Types | Drugs | Outcome |
| EFL1 | SNV | Missense_Mutation | rs753483096 | c.2986N>G | p.Leu996Val | p.L996V | Q7Z2Z2 | protein_coding | deleterious(0.02) | probably_damaging(0.936) | TCGA-AC-A3W7-01 | Breast | breast invasive carcinoma | Female | >=65 | I/II | Hormone Therapy | femara | SD |
| EFL1 | SNV | Missense_Mutation | c.365N>A | p.Gly122Glu | p.G122E | Q7Z2Z2 | protein_coding | deleterious(0) | probably_damaging(0.955) | TCGA-BH-A0BP-01 | Breast | breast invasive carcinoma | Female | >=65 | I/II | Unknown | Unknown | SD | |
| EFL1 | SNV | Missense_Mutation | c.1961N>T | p.Thr654Met | p.T654M | Q7Z2Z2 | protein_coding | deleterious(0) | probably_damaging(0.991) | TCGA-E2-A14V-01 | Breast | breast invasive carcinoma | Female | <65 | I/II | Chemotherapy | cyclophosphamide | SD | |
| EFL1 | SNV | Missense_Mutation | c.1997A>G | p.His666Arg | p.H666R | Q7Z2Z2 | protein_coding | deleterious(0) | probably_damaging(0.999) | TCGA-EW-A1OY-01 | Breast | breast invasive carcinoma | Female | <65 | I/II | Chemotherapy | doxorubicin | SD | |
| EFL1 | insertion | Nonsense_Mutation | novel | c.1785_1786insAAGACATACCCCTAGCCATTAAGGATCCCTGGATCCCC | p.Ala596LysfsTer5 | p.A596Kfs*5 | Q7Z2Z2 | protein_coding | TCGA-A2-A0EX-01 | Breast | breast invasive carcinoma | Female | <65 | I/II | Hormone Therapy | tamoxiphen | SD | ||
| EFL1 | insertion | Frame_Shift_Ins | novel | c.2065_2066insAAATCTTGTTTTTGAGACAGGGTCTCATTCTGTCGCCCCAGCTGGAG | p.Ile689LysfsTer37 | p.I689Kfs*37 | Q7Z2Z2 | protein_coding | TCGA-BH-A0B1-01 | Breast | breast invasive carcinoma | Female | >=65 | I/II | Chemotherapy | adriamycin | SD | ||
| EFL1 | SNV | Missense_Mutation | c.2845N>T | p.Pro949Ser | p.P949S | Q7Z2Z2 | protein_coding | tolerated(1) | benign(0) | TCGA-FU-A3HY-01 | Cervix | cervical & endocervical cancer | Female | <65 | I/II | Chemotherapy | cisplatin | CR | |
| EFL1 | SNV | Missense_Mutation | c.115N>T | p.Leu39Phe | p.L39F | Q7Z2Z2 | protein_coding | deleterious(0) | probably_damaging(1) | TCGA-JW-A5VL-01 | Cervix | cervical & endocervical cancer | Female | <65 | I/II | Unknown | Unknown | SD | |
| EFL1 | SNV | Missense_Mutation | novel | c.2308N>C | p.Ser770Arg | p.S770R | Q7Z2Z2 | protein_coding | tolerated(0.18) | benign(0.11) | TCGA-MA-AA3W-01 | Cervix | cervical & endocervical cancer | Female | <65 | I/II | Chemotherapy | cisplatin | CR |
| EFL1 | SNV | Missense_Mutation | novel | c.2705T>A | p.Phe902Tyr | p.F902Y | Q7Z2Z2 | protein_coding | tolerated(1) | benign(0.034) | TCGA-VS-A94Y-01 | Cervix | cervical & endocervical cancer | Female | <65 | I/II | Chemotherapy | cisplatin | PD |
| Page: 1 2 3 4 5 6 7 8 9 10 |
Top |
Related drugs of malignant transformation related genes |
| Identification of chemicals and drugs interact with genes involved in malignant transfromation |
| (DGIdb 4.0) |
| Entrez ID | Symbol | Category | Interaction Types | Drug Claim Name | Drug Name | PMIDs |
| Page: 1 |

Copyright 2023-Present -The University of Texas Health Science Center at Houston |